


In the vast virtualization world, VMware vCenter has firmly established its foothold as an indispensable tool for overseeing your virtual environment. But even with its reputation, vCenter occasionally throws a curveball your way. But fear not, because you’re in for a treat in troubleshooting vCenter logs — your ticket to seamless resolution.
Throughout this tutorial, you’ll unravel the mysteries within vCenter logs through troubleshooting, employing various methods to collect information.
Transform log-related frustrations into a mastery of troubleshooting insights!
Prerequisites
This tutorial comprises hands-on demonstrations. Before diving in, ensure you have the following in place:
- VMware vCenter Server (Windows-based or vCenter Server Appliance) – This tutorial uses VMware vCenter Server Version 8.0.0.10000 Build 20519528.
- VMware’s vRealize Log Insight – This tutorial uses vRealize Log Insight version 8.6.2-21638565.
- Admin access to the VMware vCenter Server.
Accessing and Viewing vCenter Logs
vCenter logs are treasure troves of information, documenting everything happening within your vCenter server. These logs provide insights into the operations, errors, and status messages from your virtual machines (VMs) and other vCenter components.
Accessing vCenter logs slightly varies between the Windows-based vCenter Server and the VMware vCenter Server Appliance (VCSA). But in this example, you’ll access the vCenter logs in the VCSA via SSH.
To access vCenter logs via SSH, follow these steps:
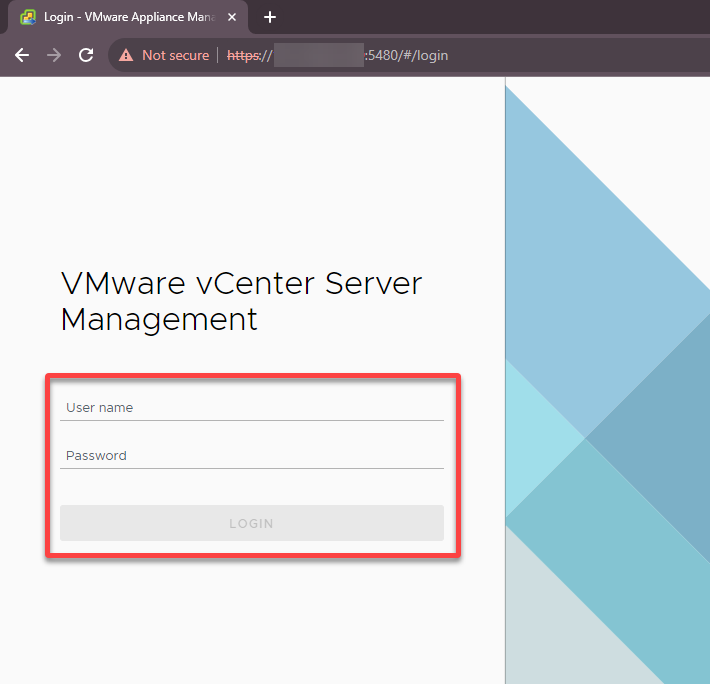
1. Open your favorite web browser and log in to your VMware vCenter Server Management interface.
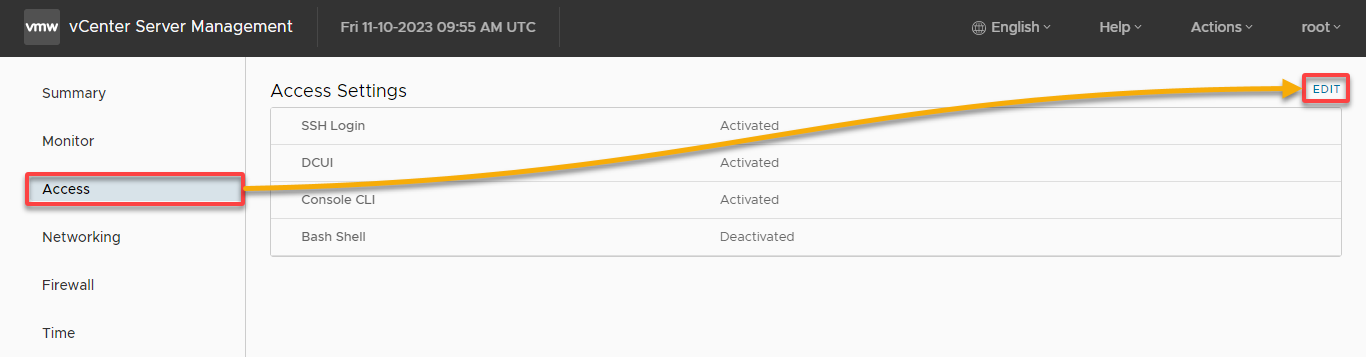
2. Next, navigate to Access (left pane), then click on EDIT (top-right), which opens a dialog box where you can configure access to your VCSA.
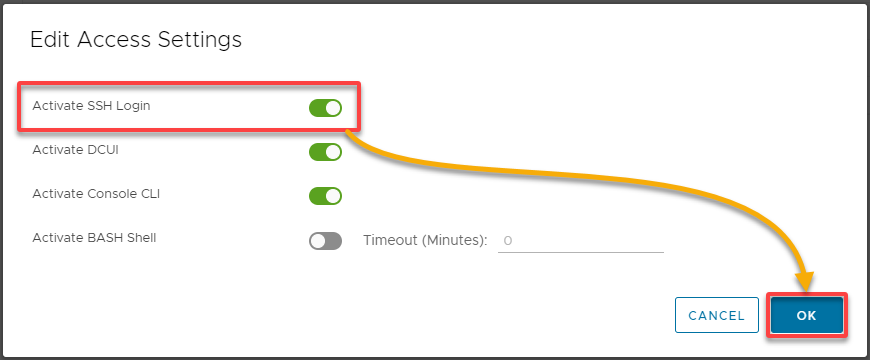
3. In the Edit Access Setting dialog box, toggle Activate SSH Login to enable SSH access to your VCSA and OK to save the changes.
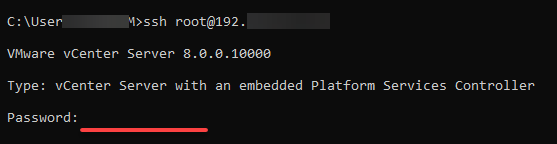
4. Now, launch an SSH client of your choice (i.e., PuTTY or Command Prompt) and establish an SSH connection to your VCSA. This tutorial uses Command Prompt throughout this section.
Ensure you replace the placeholders below accordingly with your appliance’s username and IP address (or hostname).
ssh <username>@<vCenter_IP_Address>When prompted, provide your password to authenticate the SSH connection.
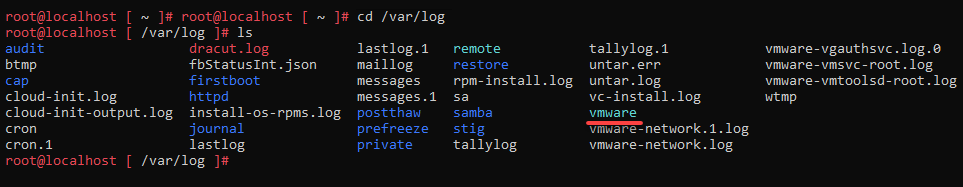
5. Once logged in, execute the following commands to navigate (cd) to the /var/log directory and list (ls) its contents (files and directories).
cd /var/log
ls
Within the /var/log directory, you can find logs related to various vCenter components, services, and system activities.
💡 For Windows, the logs are found in the following logs directory.
%ALLUSERSPROFILE%\\VMware\\vCenterServer\\
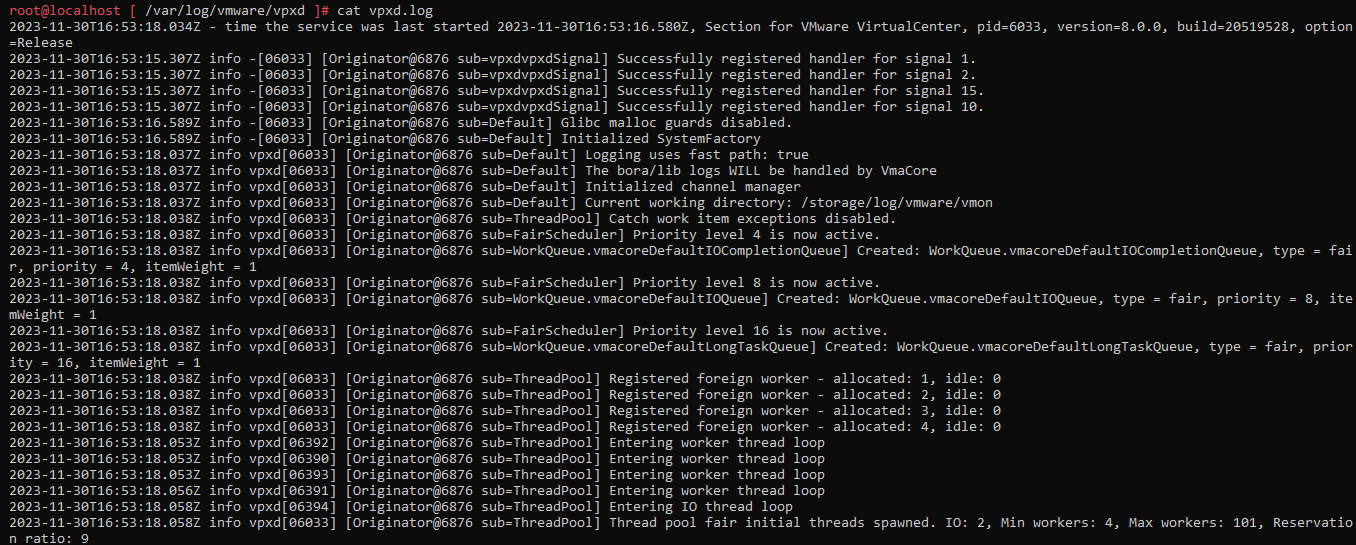
Pick one log from the list you wish to view, but this tutorial’s choice is the /var/log/vmware/vpxd/vpxd.log.
6. Execute the below cat command to view your preferred log, replacing <vCenterLog> with the log name you noted in step five.
cat <vCenterLog>💡 You can also use the
tailorlesscommands to view the logs.
Understanding vCenter logs is critical for maintaining a healthy and efficient virtual environment. You’ll have raw data to start your investigation by accessing these logs
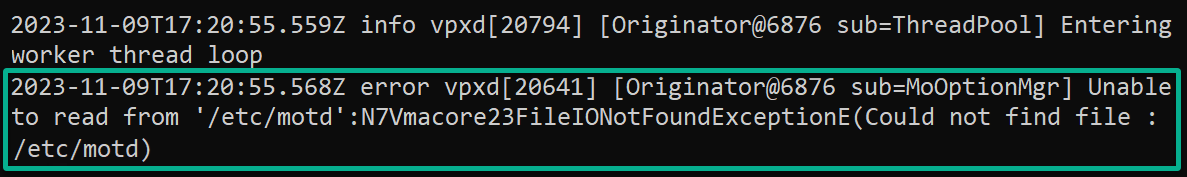
7. Lastly, pick one log entry, like the one below, and familiarize yourself with its structure for better reading and understanding of vCenter logs. A vCenter log entry includes a timestamp, a severity level (info, warn, error, etc.), the module where the log originated, and the log message itself.
The above vCenter log consists of the following:
- Timestamp (in this case, 2023-11-09T17:20:55.568Z) – Indicates when the event occurred. The timestamp provides precise information about the time of the event in UTC.
- Log Level (error, in this case) – Represents the severity level of the log entry, which, in this case, is an error message denoting being unable to read from a file.
- Process and PID (vpxd[20641], in this case) – Consists of the following:
| Process | vpxd is the vCenter Server process responsible for this log entry. |
|---|---|
| Process ID (PID) | 20641 is a unique identifier for this instance of the vpxd process. |
- Thread Information ([Originator@6876 sub=MoOptionMgr]) – Contains the following:
| Originator | Refers to the initial point where the operation started. |
|---|---|
| 6876 | The Thread ID identifies the specific thread handling this operation. |
| sub=MoOptionMgr | Additional information about the thread or processing pool involved. |
- Log Message – A message that describes the specific event or operation that occurred. In this case, an error message below indicates a failure in reading the specified file.
Unable to read from ‘/etc/motd’:N7Vmacore23FileIONotFoundExceptionE(Could not find file : /etc/motd)
Identifying Error Logs
Coming off the heels of accessing and viewing vCenter logs, you now delve into a crucial aspect of troubleshooting – identifying error logs. Like inspecting file integrity, where silent corruption can lurk beneath the surface, error logs can hide vital clues behind seemingly innocuous messages.
To identify error logs, you’ll typically search logs for entries marked as “error” or “warning,” as follows:
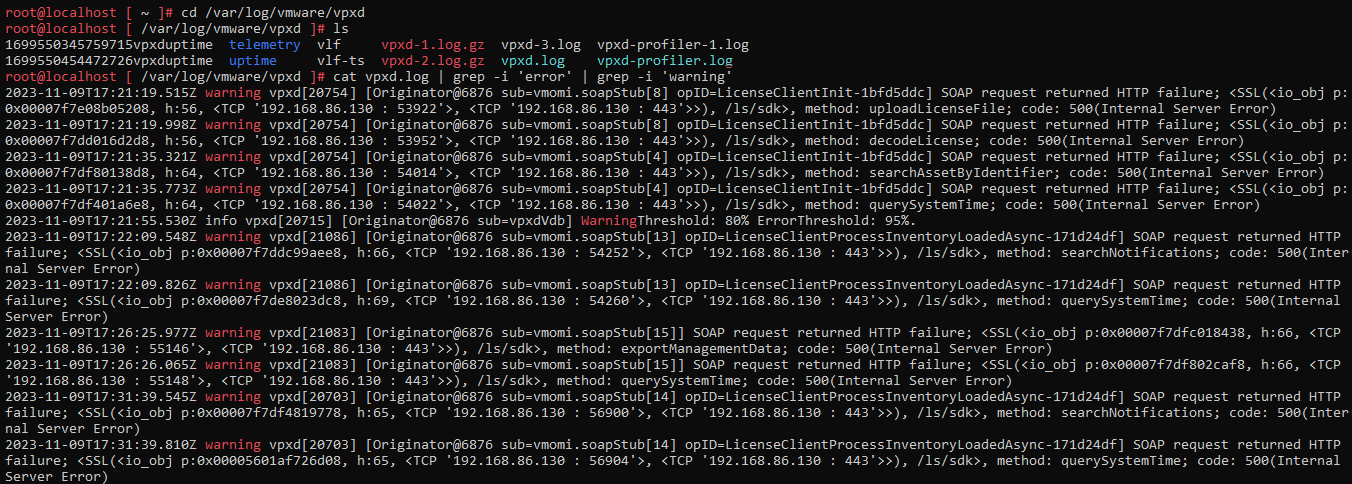
Navigate into the logs directory (cd) where vCenter logs are stored (i.e., /var/log/vmware/vpxd), and list (ls) the logs.
cd /var/log/vmware/vpxd
ls
Next, run the below cat command to search for error or warning entries in a specific log file of your choice while ignoring case sensitivity (-i).
Ensure you replace the <file.log> placeholder with your target log file (i.e., vpxd.log).
cat <file.log> | grep -i 'error' | grep -i 'warning'Now, you can pick specific error log entries you wish to review for troubleshooting.
Leveraging VMware’s vRealize Log Insight
From uncovering hidden errors within vCenter logs, you can harness a sophisticated tool to elevate your troubleshooting game — vRealize Log Insight. This tool not only pinpoints errors but also conducts a thorough analysis of your vCenter logs.
What sets vRealize Log Insight apart is its ability to group similar logs, spotlight common patterns, and offer visualizations for a more comprehensive understanding.
To leverage vRealize Log Insight in your vCenter environment, complete the steps below:
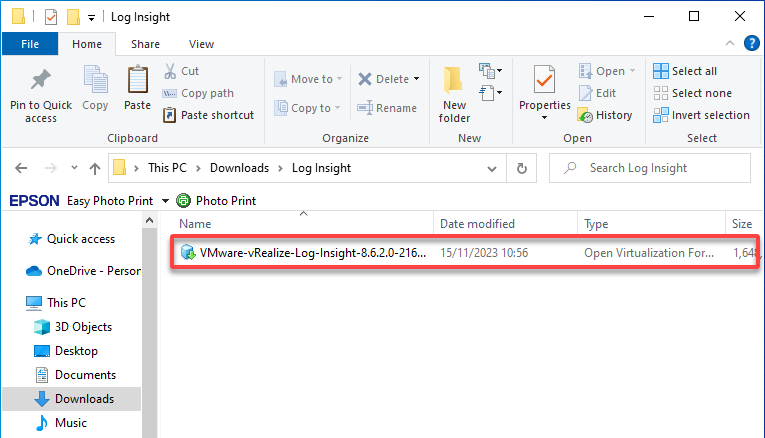
1. Download the .OVA file from the VMware website and deploy it using the vSphere Web Client.
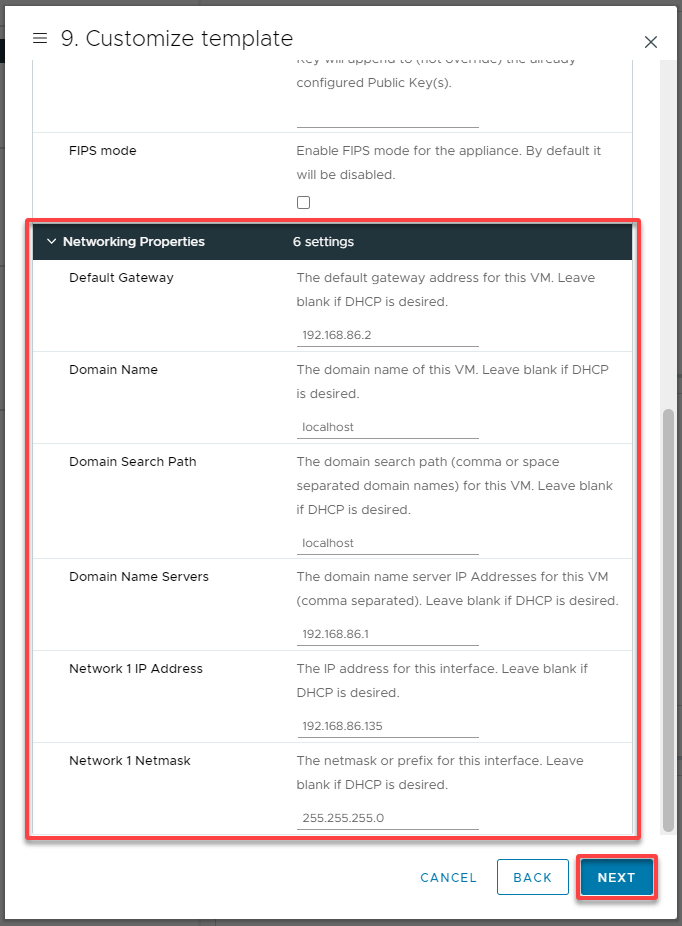
2. During deployment, configure the Network Properties for the vRealize Log Insight appliance, as shown below, and click NEXT.
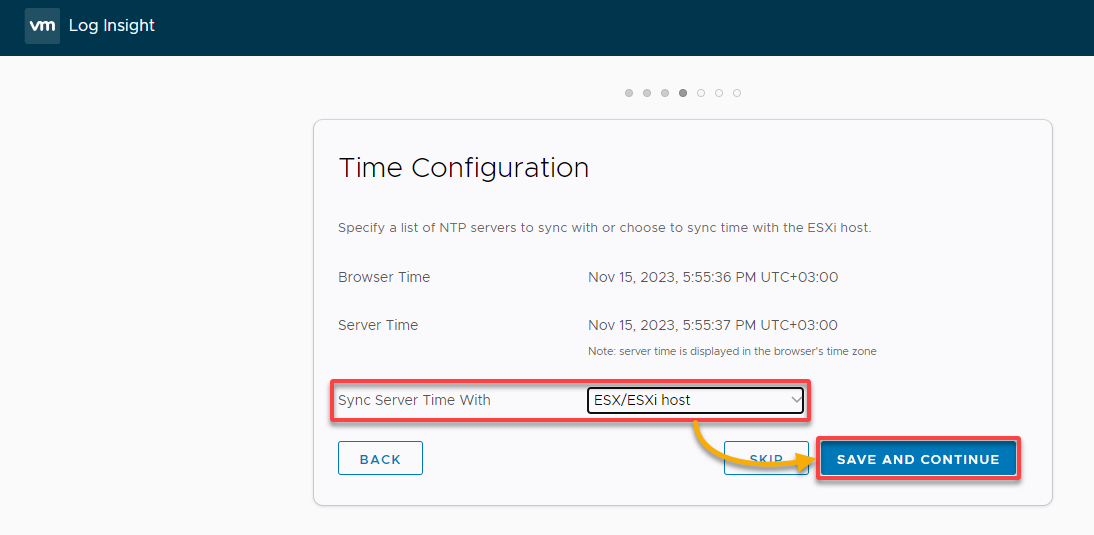
3. Complete the initial configuration wizard, including the time zone, Network Time Protocol (NTP), and other basic configurations, and click SAVE AND CONTINUE.
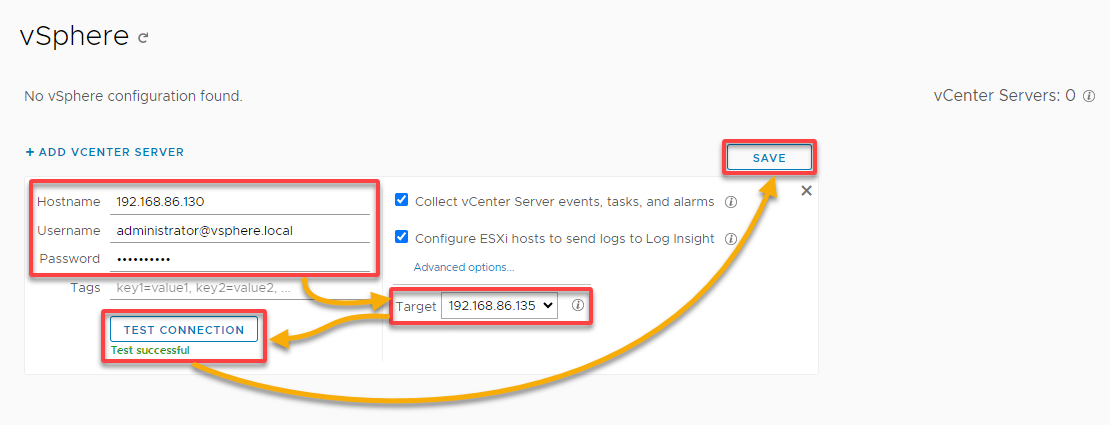
4. Provide the IP address or Hostname of your vCenter Server, along with appropriate credentials, test the connection, and click SAVE.
This process connects vRealize Log Insight to your vCenter server.
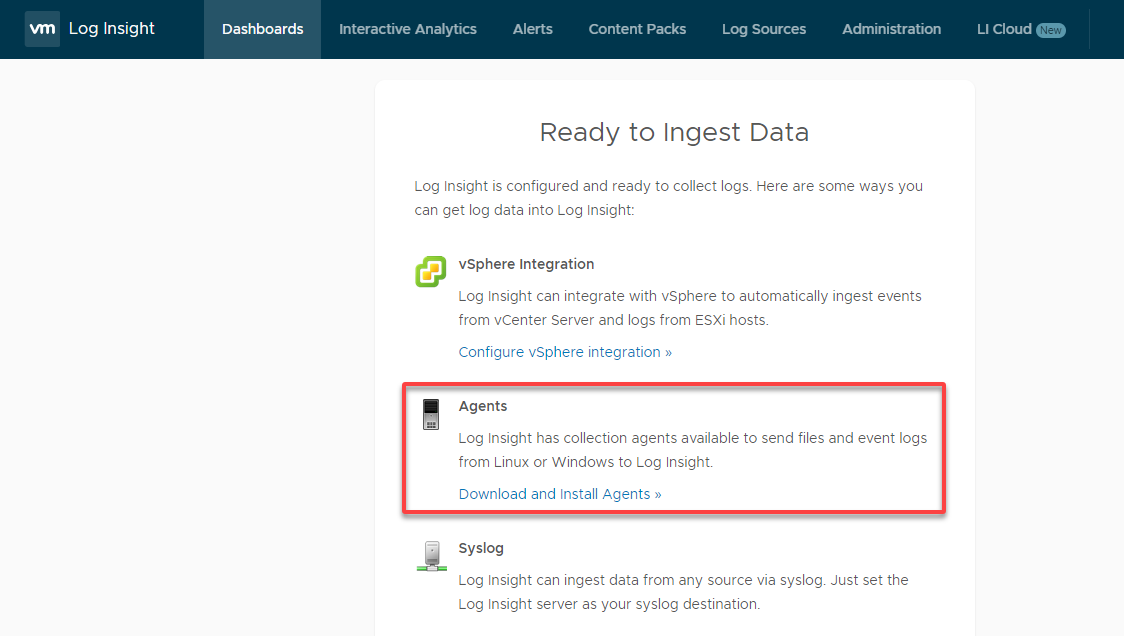
Depending on your requirements, you may need to download, install, and configure agents on specific servers or VMs to collect logs and send them to vRealize Log Insight.
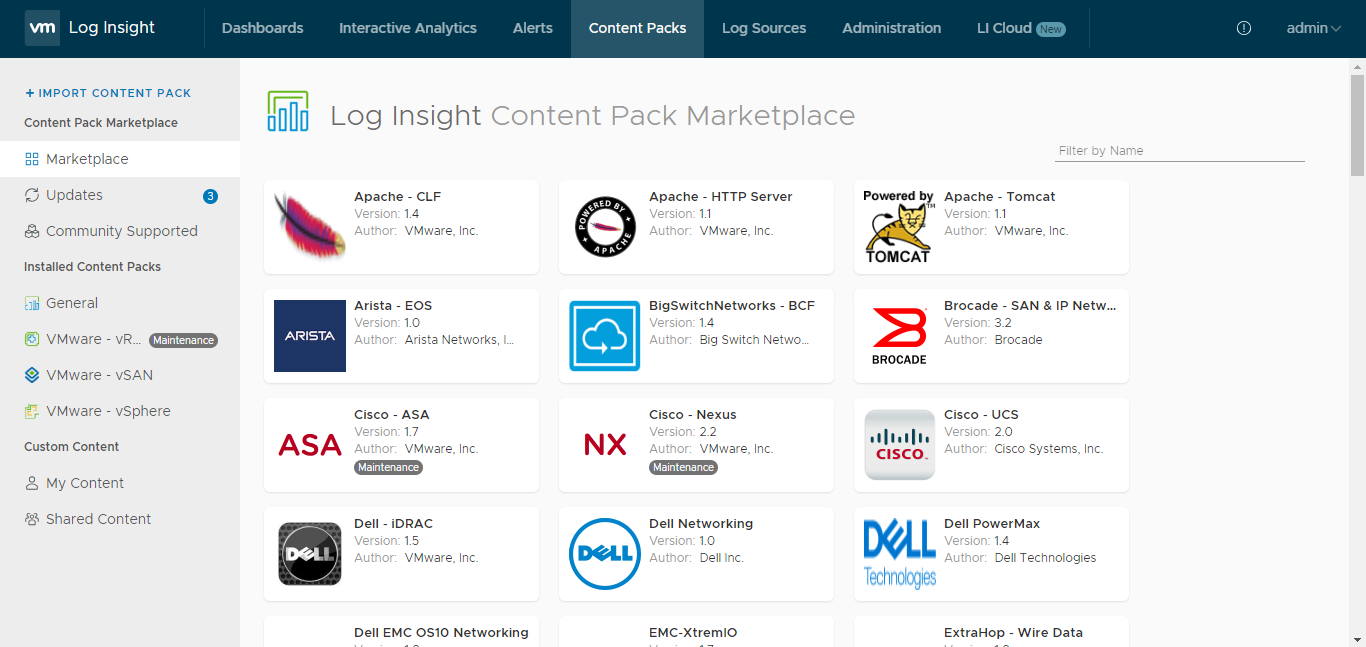
5. Now, explore and install relevant Content Packs in vRealize Log Insight that provide predefined dashboards and queries for various technologies.
These technologies span across vCenter, ESXi hosts, and various other VMware products.
Comparing and Correlating Logs Within vRealize Log Insight
Understanding an issue requires looking at several logs; correlating events from different logs can provide a fuller picture of what transpired. Imagine your virtual machine throwing a fit and refusing to power up. In such cases, you’ve got to peek into logs from the vCenter Server, the ESXi host, and the VM itself.
By comparing and correlating information from multiple logs, you’ll uncover the root cause of the problem.
To perform correlation and analysis using vRealize Log Insight, carry out the following:
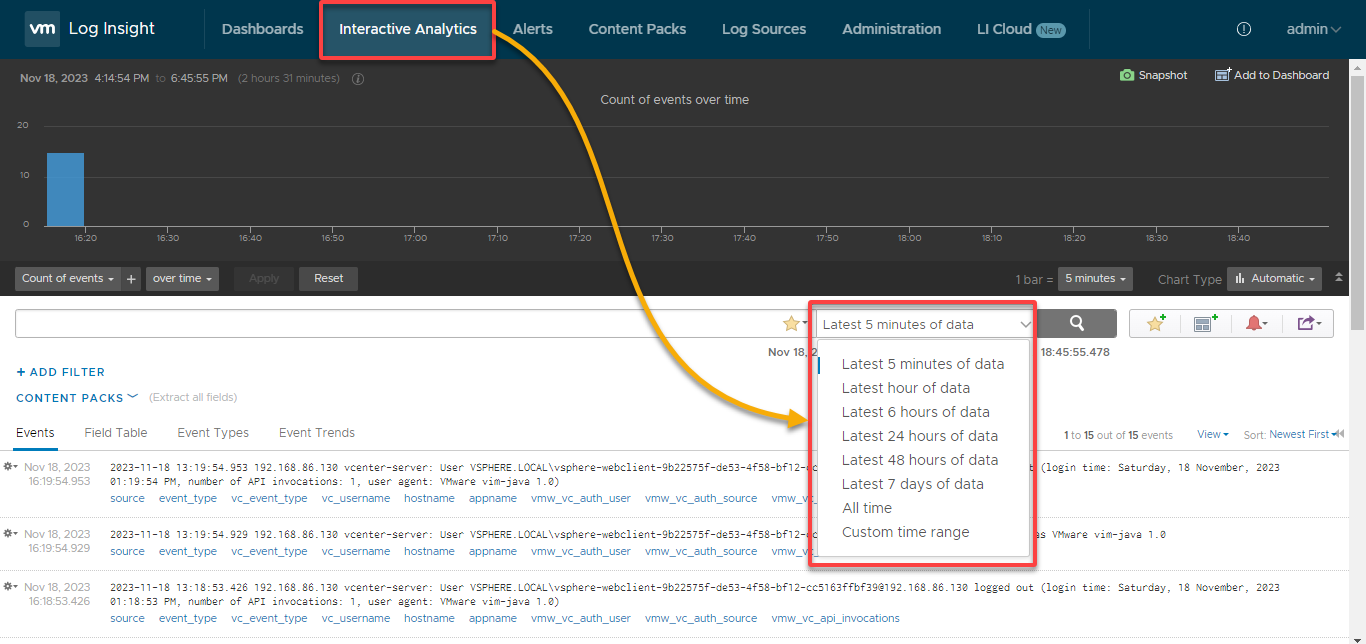
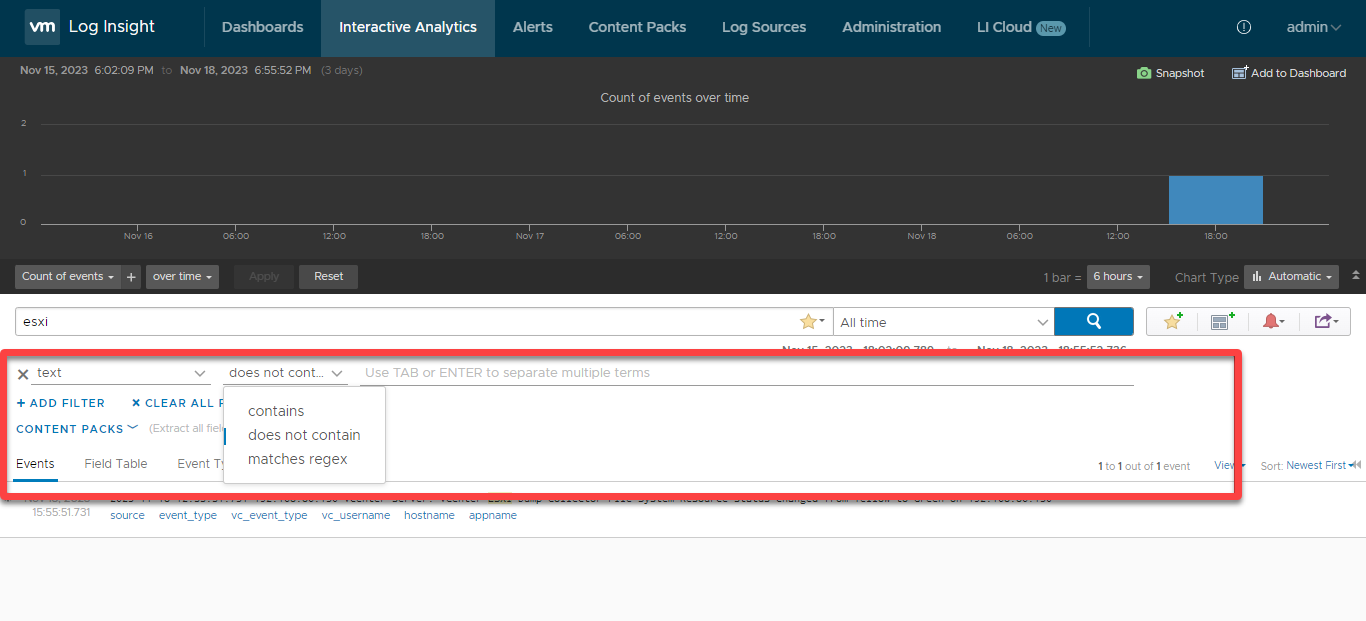
1. In vRealize Log Insight, navigate to Interactive Analytics and set the time range (i.e., All time) for log data analysis using the time picker in the query panel, as shown below.
This feature lets you leverage the powerful search capabilities to filter and drill down into specific log entries.
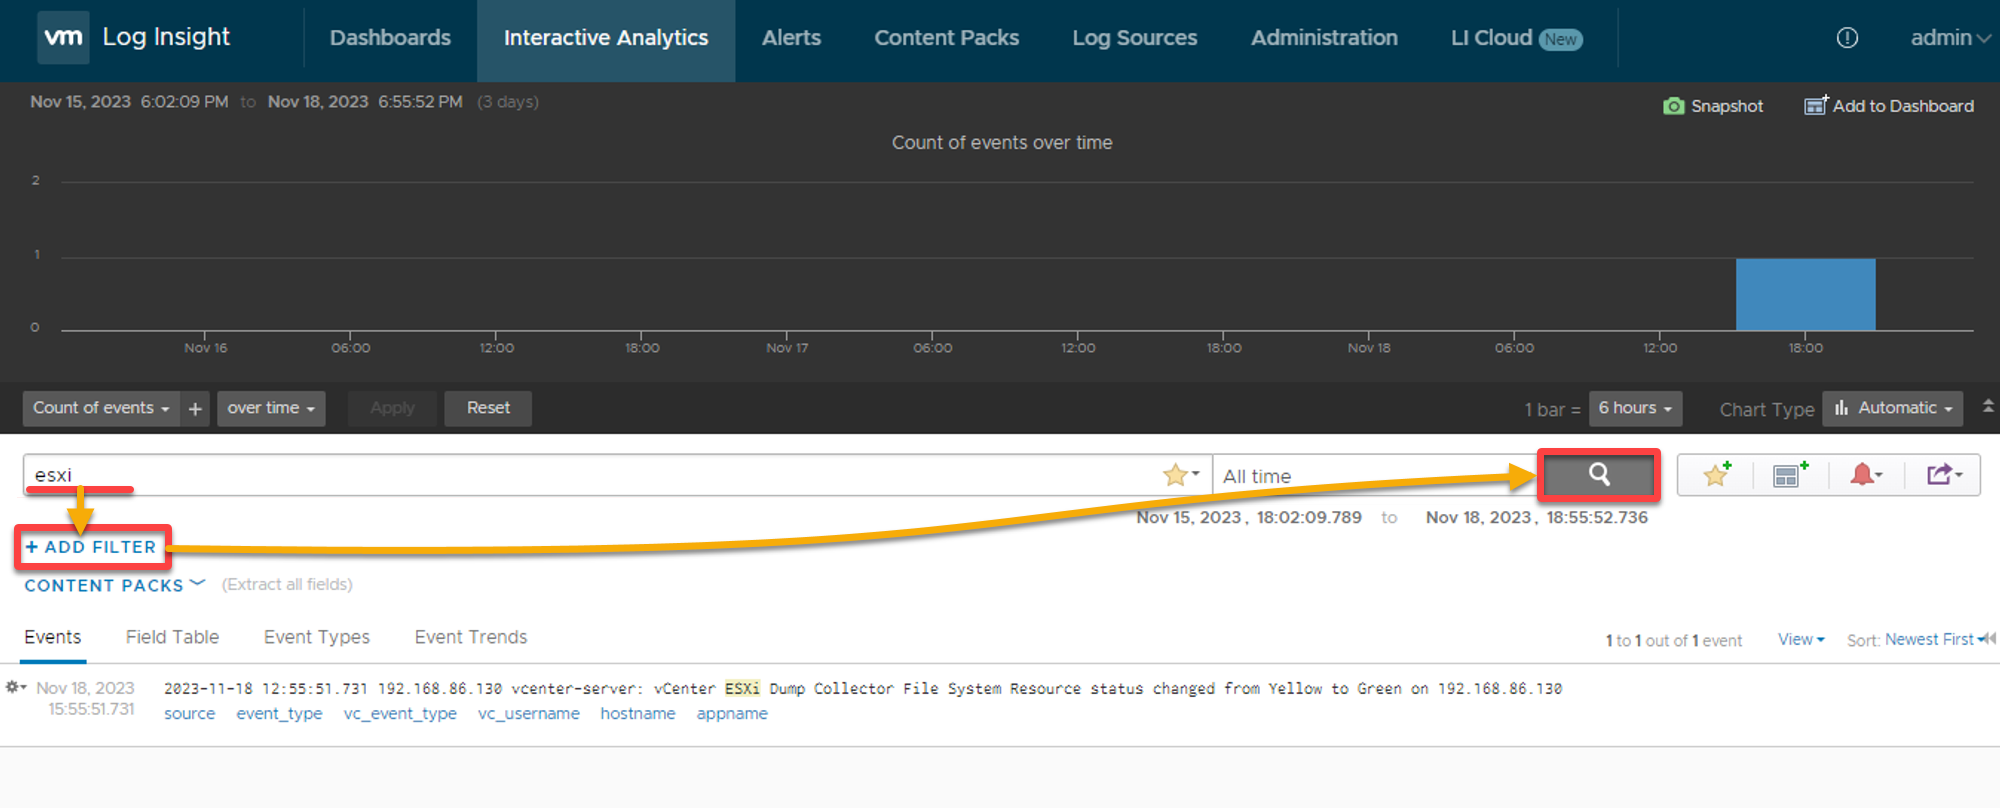
2. Next, type in a value in the search query field (i.e., esxi) using the Log Insight Query Language (LIQL), add filters (if applicable), and click the search icon to execute a basic search query.
This example searches for log entries related to esxi, as shown below.
3. Refine your query by adding more filters to narrow the log data, and use logical operators (AND, OR) to combine multiple conditions.
4. Now, examine log entries to identify common fields or attributes that may serve as correlation points. Look for identifiers like timestamps, transaction IDs, or unique identifiers.

Below are some of the common vCenter log errors and their fixes.
| Issue | Details | Fix |
|---|---|---|
| High Host Memory Usage | This error often arises from insufficient resources. | Check your ESXi host’s CPU and memory utilization and consider migrating some VMs to other hosts to free up resources. |

| Issue | Details | Fix |
|---|---|---|
| VMware vSphere Profile-Driven Storage Service Alarming Health | Indicates a potential issue or warning related to the health of the Profile-Driven Storage Service in your VMware vSphere environment. | Check the status of the Profile-Driven Storage Service to ensure that the service is running and there are no reported errors. Verify that the storage devices are healthy, accessible, and properly configured within vSphere. |

Creating a Log Management Strategy via vSphere Client
By comparing and correlating logs, you’ve unveiled the hidden stories behind vCenter’s operational tapestry. Yet, armed with this knowledge, the question arises: what’s the proactive measure to not just uncover but to prevent log-related mysteries in the first place?
A robust log management strategy can proactively mitigate potential issues before adversely affecting your environment. This approach involves consistently reviewing logs to identify warnings and errors, configuring alerts for critical events, and archiving older logs to sustain optimal system performance.
To create a log management strategy in vCenter, fulfill the following steps:
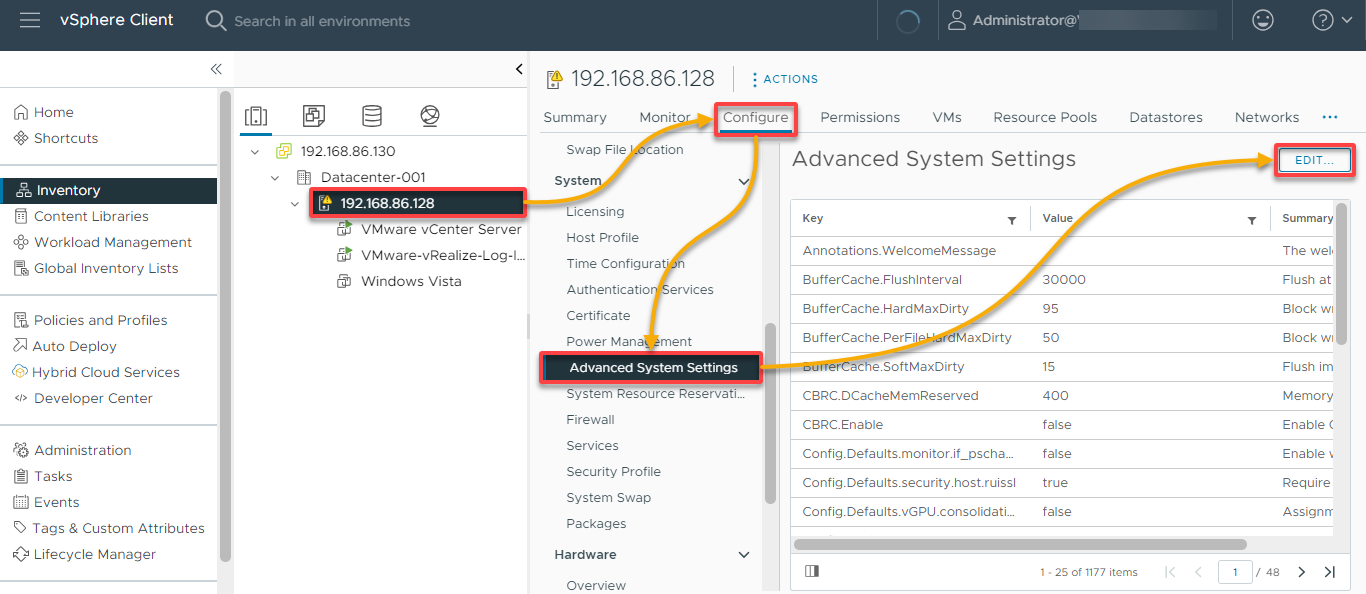
1. In the vSphere Client, select your ESXi host, navigate to the Configure tab, choose Advanced System Settings, and click EDIT.
A dialog box appears (step two) where you can configure syslog settings for your ESXi hosts to centralize log storage.
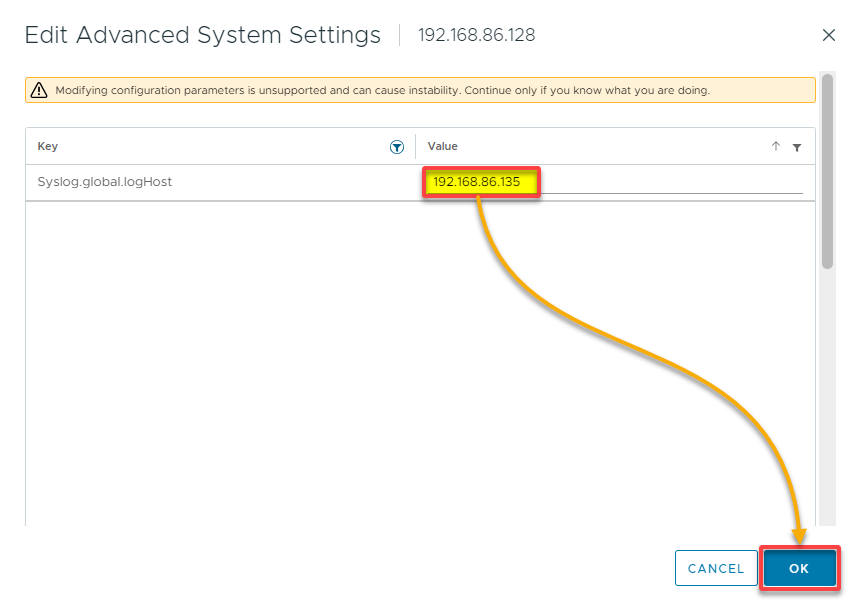
2. Next, search for Syslog.global.logHost and edit its value to point to your Syslog server, as shown below, and click OK to save the changes.
This parameter is set to specify a central syslog server (i.e., 192.168.86.135) to collect and store log messages from multiple ESXi Hosts and vCenter servers.
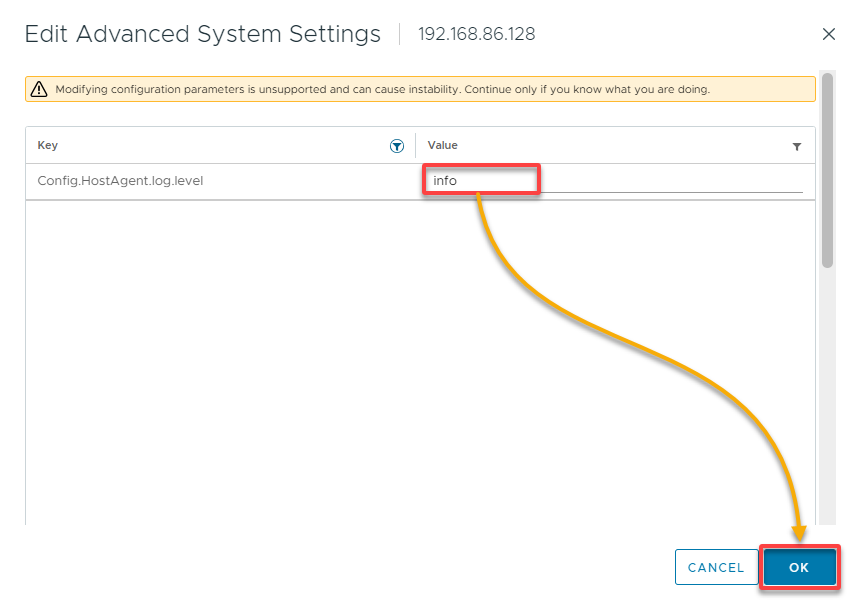
3. Edit the advanced system settings on the same ESXi host or vCenter Server again.
But this time, search for entries that have the prefix Config.HostAgent.level, provide your preferred value, and click OK. Note that one of the valid values, info, is set by default.
This process lets you adjust log levels based on your requirements, which helps manage the volume of logs generated.
Optimizing Advanced Log Management Tools
Now that you’ve crafted your log management strategy, how can you extract more wealth of information? Optimize advanced log management tools, such as Loggly or Splunk. These tools can ingest, analyze, and visualize logs, making it easier to spot trends or issues.
But in this example, you’ll stick with vRealize Log Insight by creating a custom dashboard and setting up alerts and notifications.
To optimize vRealize Log Insight, continue with the following:
1. Navigate to the Dashboards section and click NEW DASHBOARD to initiate creating a custom dashboard.
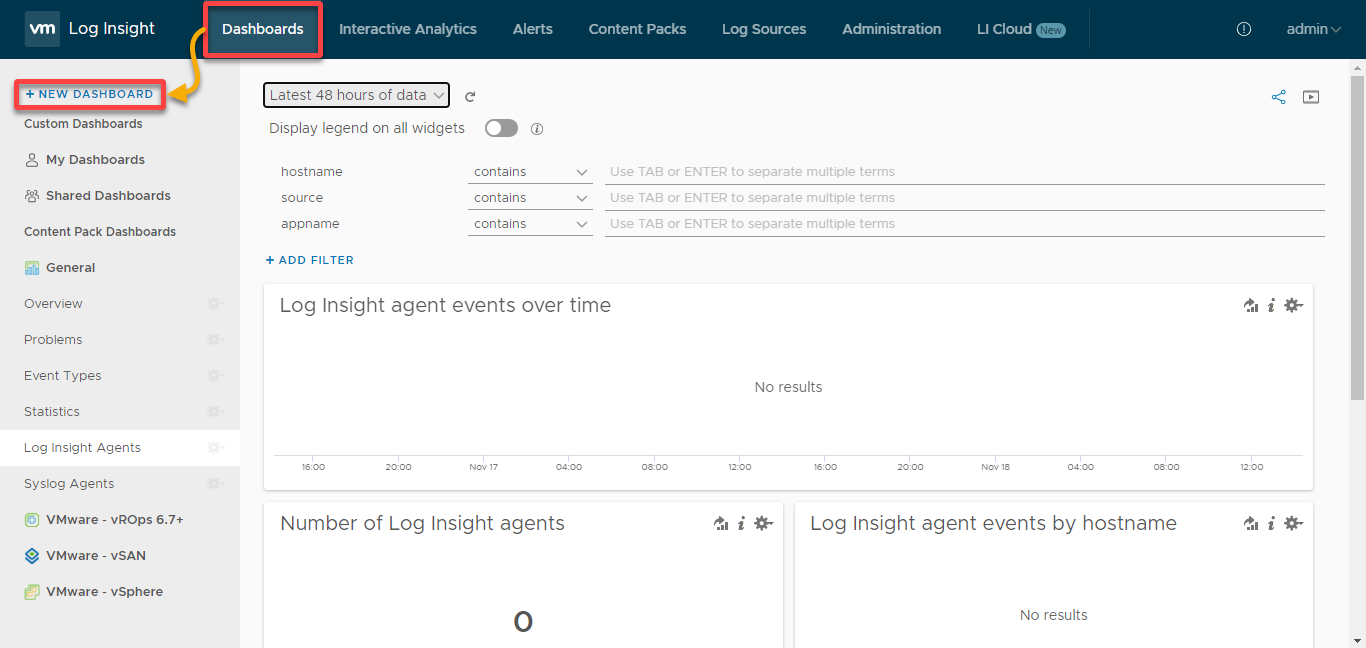
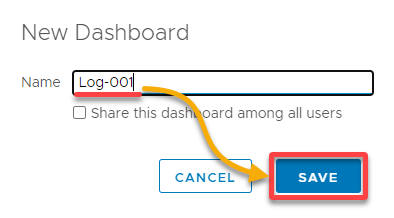
2. Next, provide a dashboard name (i.e., Log-001), and click SAVE to finalize creating your dashboard.
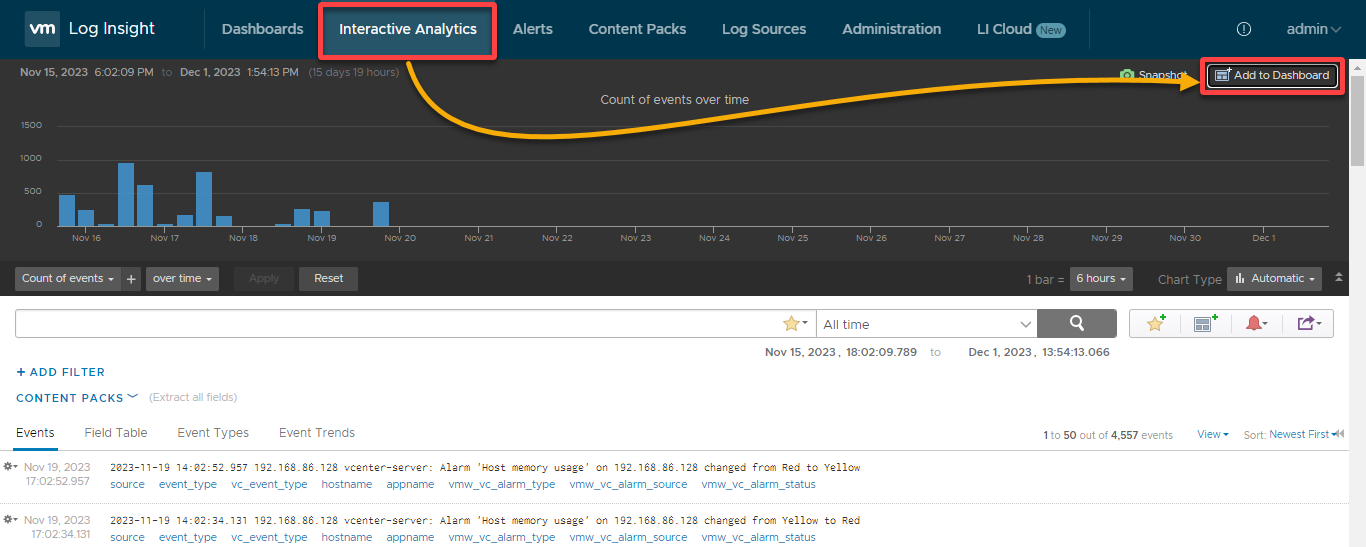
3. Once created, navigate to Interactive Analytics and click Add to Dashboard (top-right) to add widgets to visualize log events on your dashboard.
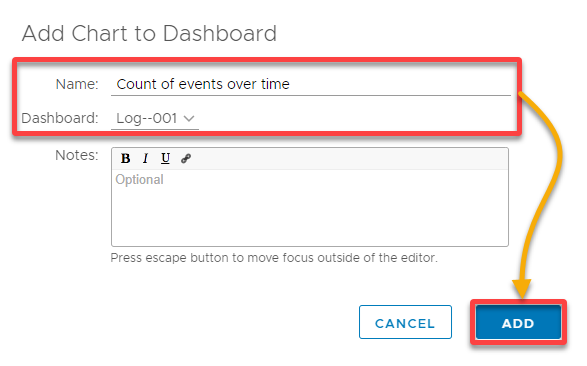
4. In the dialog box, name your widget, select your preferred dashboard (i.e., Log-001) to add the widget, and then click ADD to save the changes.
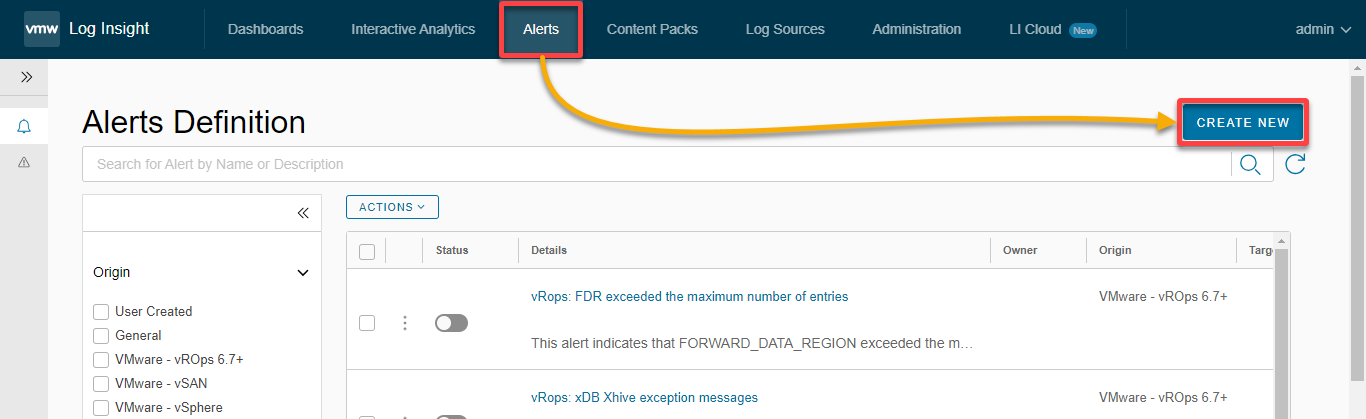
5. Now, navigate to the Alerts tab and click CREATE NEW to initiate setting up alerts and notifications.
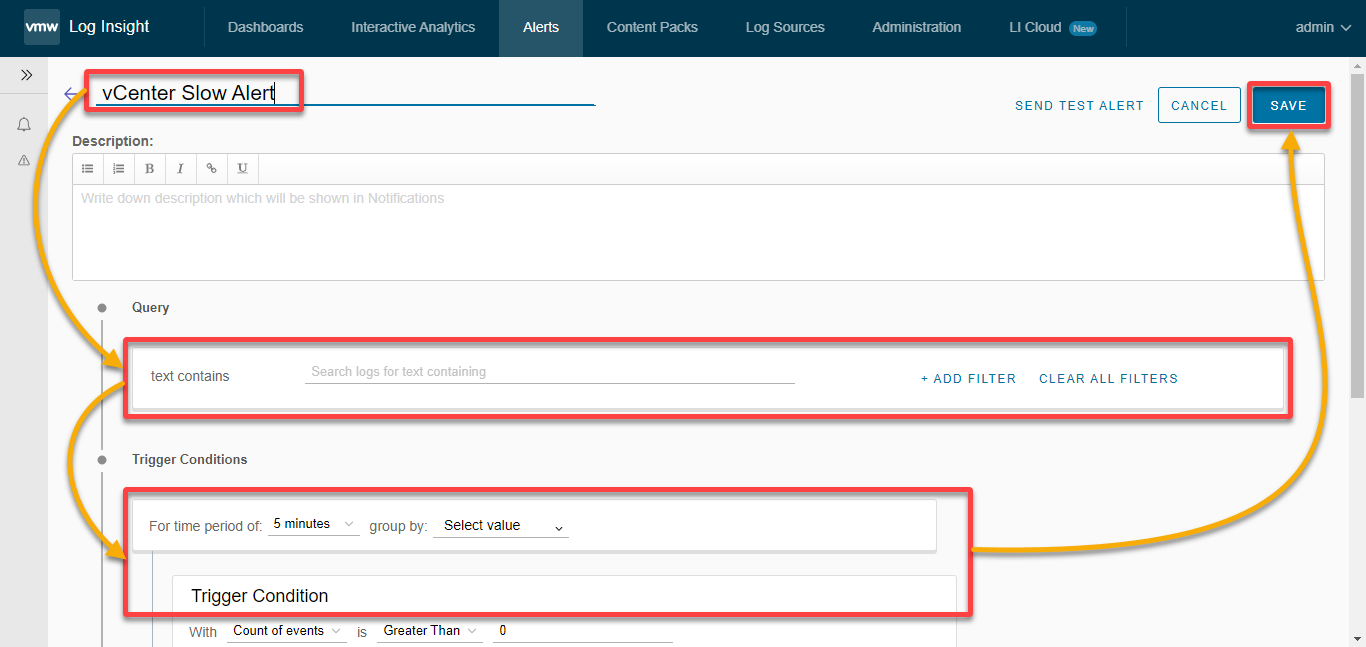
6. Finally, set up an alert as follows:
- Provide a descriptive name for the alert.
- Create alert queries based on specific log events or patterns.
- Define conditions for triggering alerts.
- Click Save to finalize setting up the alert.
Conclusion
On your troubleshooting journey, you walked through the intricacies of vCenter logs and kicked off by mastering the art of accessing and viewing vCenter logs. You’ve learned to identify those elusive error logs and harnessed the power of VMware’s vRealize Log Insight.
You also touched on comparing and correlating logs, crafted a strategic approach through the vSphere Client, and even took a deep dive into optimizing advanced log management tools.
In a nutshell, you’ve acquired the skills to navigate the labyrinth of vCenter logs and honed your troubleshooting prowess. Now, you can dissect error messages precisely, uncover hidden patterns, and fortify your virtualized environment against potential disruptions.
As you step away from this tutorial, consider how you can build on this newfound expertise. Why not automate repetitive processes to save time and increase efficiency in handling logs with scripting languages like PowerShell or Python? Or investigate how your log management tools can integrate with other IT management and monitoring solutions, like ELK Stack or Graylog?


