


Are you seeking a system that can interpret your log files, store them in a secure environment, and collect well-organized data for analysis? Well, centralizing log management with Graylog Docker could be what you’re looking for!
In this tutorial, you’ll learn how to use Graylog and Docker to construct a centralized log system for collecting Syslog data from your Ubuntu machine.
Read on and start centralizing your log management!
Prerequisites
This post will be a step-by-step tutorial. To follow along, be sure to have the following:
- Two Ubuntu machines (one host and one client) – This tutorial uses Ubuntu 20.04, but other Linux distros will work.
- Rsyslog on the client machine.
- Docker installed on the host machine. The version of Docker used for this tutorial is 20.10.7
- Docker-compose installed on the host machine.
- Pwgen utility needs to be installed on the host machine to generate a random secret password.
Deploying Graylog Using Docker Compose
What is Graylog anyway? Graylog is an open-source log management platform. Graylog can gather, index, and analyze structured and unstructured data from sources. One of these sources is operating systems in real-time.
Before deploying Graylog, you’ll first need to install Graylog on your host machine using Docker Compose.
Suppose you’re using a cloud-based Ubuntu 20.04 computer. In that case, you’ll need to modify your security group or firewall rules to allow the following ports:
1514and12201for both TCP and UDP connections and9000for only TCP connections.
1. Open your favorite SSH client, and connect to your machine.
2. Next, run the below commands to create a new directory in your home directory and switch to that directory. You can name the directory as you prefer. But for this demo, the directory is called ~/graylog.
mkdir graylog
cd graylog
3. Create a YAML file named docker-compose.yml in your ~/graylog directory, then populate the file with the configuration below. But don’t save the changes yet. To protect the Graylog login and restrict access to your data, you’ll need to generate a secret password.
In the newly created file, you will find the configuration for setting up Graylog, MongoDB, and ElasticSearch components. Graylog requires all of these components set up and run simultaneously for Graylog to function effectively.
version: '2'
services:
# MongoDB: https://hub.docker.com/_/mongo/
MongoDB: # Mongodb service
image: mongo:4.2 # Version of Mongodb docker image
volumes:
- mongo_data:/data/db # Persisted mongodb data
# Elasticsearch: https://www.elastic.co/guide/en/elasticsearch/reference/7.10/docker.html
elasticsearch: # ElasticSearch service
image: docker.elastic.co/elasticsearch/elasticsearch-oss:7.10.2 # Version of elasticsearch image
volumes:
- es_data:/usr/share/elasticsearch/data # Persisted elasticsearch data
environment:
- http.host=0.0.0.0
- transport.host=localhost
- network.host=0.0.0.0
- "ES_JAVA_OPTS=-Xms512m -Xmx512m"
ulimits:
# Unlimited amount of memory set for elasticsearch container
memlock:
soft: -1
hard: -1
# Resource limit for elasticsearch set to 1 gigabyte
mem_limit: 1g
# Graylog: https://hub.docker.com/r/graylog/graylog/
graylog:
image: graylog/graylog:4.2 # Version of Graylog docker image
volumes:
- graylog_data:/usr/share/graylog/data # Persisted Graylog data
environment:
# CHANGE ME (must be at least 16 characters)!
- GRAYLOG_PASSWORD_SECRET=somepasswordpepper
# Password: admin
- GRAYLOG_ROOT_PASSWORD_SHA2=8c6976e5b5410415bde908bd4dee15dfb167a9c873fc4bb8a81f6f2ab448a918
- GRAYLOG_HTTP_EXTERNAL_URI=http://127.0.0.1:9000/
- GRAYLOG_WEB_ENDPOINT_URI=http://127.0.0.1:9000/api
# Command to run as soon as components are started
entrypoint: /usr/bin/tini -- wait-for-it elasticsearch:9200 -- /docker-entrypoint.sh
# Containers that Graylog depends on
links:
- mongodb:mongo
- elasticsearch
restart: always # Graylog container set to always restart when stopped
depends_on:
- mongodb
- elasticsearch
ports:
# Graylog web interface and REST API
- 9000:9000
# Syslog TCP
- 1514:1514
# Syslog UDP
- 1514:1514/udp
# GELF TCP
- 12201:12201
# GELF UDP
- 12201:12201/udp
# Volumes for persisting data, see https://docs.docker.com/engine/admin/volumes/volumes/
volumes:
mongo_data:
driver: local
es_data:
driver: local
graylog_data:
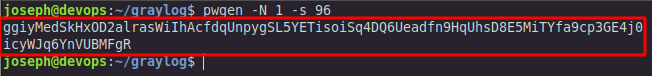
driver: local4. Now, run the pwgen command below to generate a single random password (-N) with 96 (-s 96) characters.
pwgen -N 1 -s 965. Your generated secret password will look similar to the one below. Note your secret password as you’ll set it in the docker-compose.yml file (step six).
6. Go back to the docker-compose.yml file and replace somepasswordpepper in GRAYLOG_PASSWORD_SECRET with your newly generated secret password (step five). You’ll use this password for password encryption and salting. Without this secret password, the Graylog container will not start.
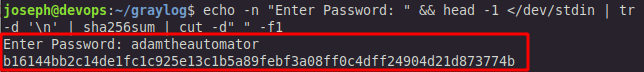
7. Run the command below to generate a SHA2 hash of a password of your choosing. This password is required for the initial log-in to Graylog.
echo -n "Enter Password: " && head -1 </dev/stdin | tr -d '\n' | sha256sum | cut -d" " -f1Enter an admin password of your choice when prompted, as shown below, and hit ENTER. Once you’ve entered a password, your hashed password generates.
Note your hashed password as you’ll set it in the docker-compose.yml file (step eight).
8. Replace the value of the GRAYLOG_ROOT_PASSWORD_SHA2 environment variable in the docker-compose.yml file with the SHA2 hash password you previously generated (step seven). Save the changes in the docker-compose.yml file and exit the editor.
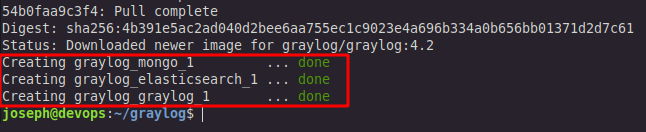
9. Finally, run the docker-compose up command below to deploy ElasticSearch, MongoDB, and Graylog Docker containers in detached mode (-d). This command pulls them from the Docker hub and starts them as containers for Graylog to work correctly.
# Starting up MongoDB, ElasticSearch, and Graylog containers in detached mode
sudo docker-compose up -d
The image below shows that the MongoDB, ElasticSearch, and Graylog Docker images have been pulled from the Docker hub and started as containers.
Changing Index Shards Value for ElasticSearch
You’ve just deployed Graylog, and that’s a big step forward in centralizing log management. But now, it’s time to configure Graylog. You’ll change the ElasticSearch shards value depending on how many ElasticSearch nodes/containers you’re running.
A shard is a unit at which Elasticsearch distributes data around multiple nodes. The optimal number of shards per node is one.
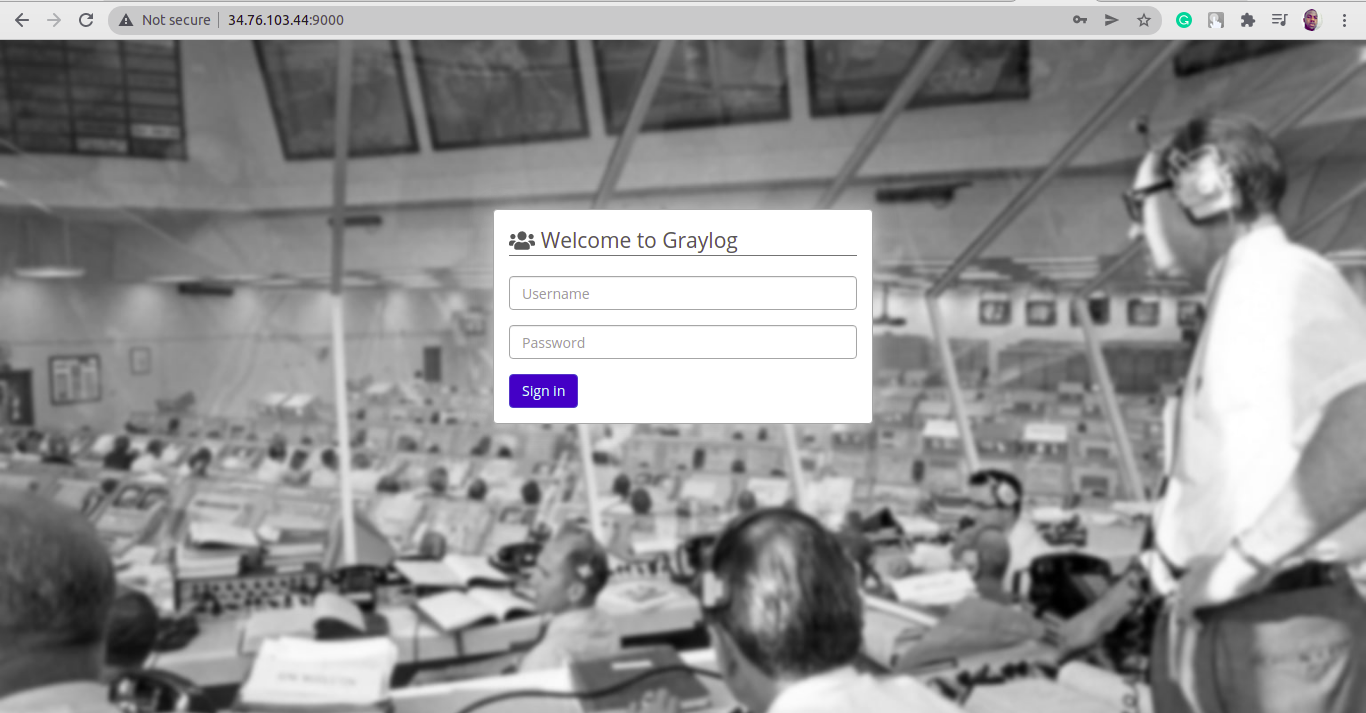
1. Open your favorite web browser and navigate to https://<HOST_IP>:9000, where HOST_IP is your host machine’s IP address. If all goes well, you’ll get to the Graylog’s login screen shown below.
Enter admin as the username, and enter the admin password you created in the “Deploying Graylog Using Docker Compose” section (step seven). For this tutorial, the password is adamtheautomator.
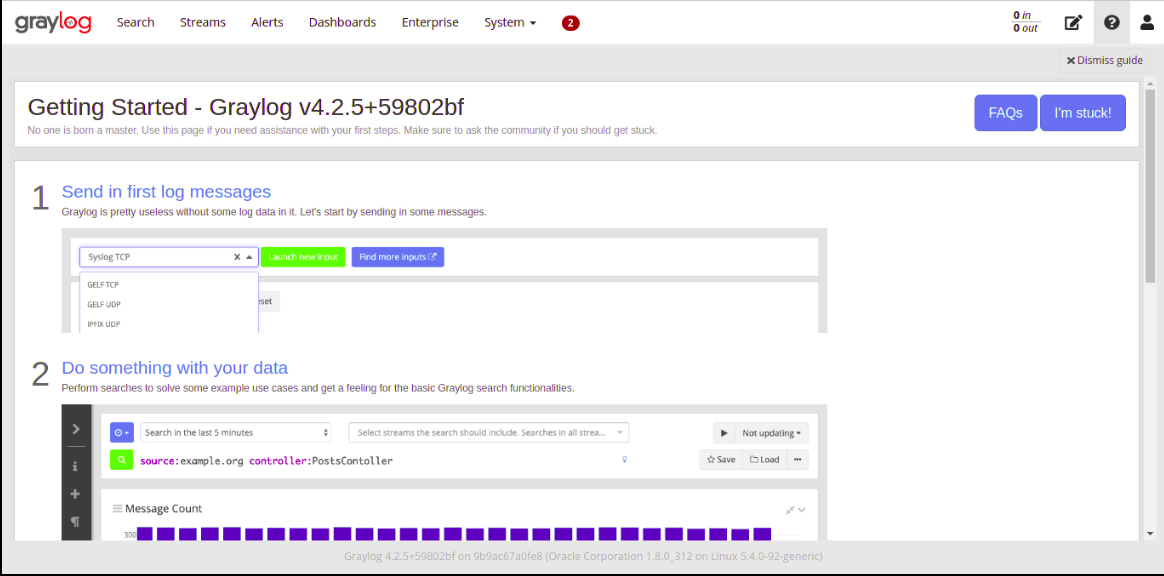
After logging in, you’ll see Graylog’s Getting Started page, as shown below.
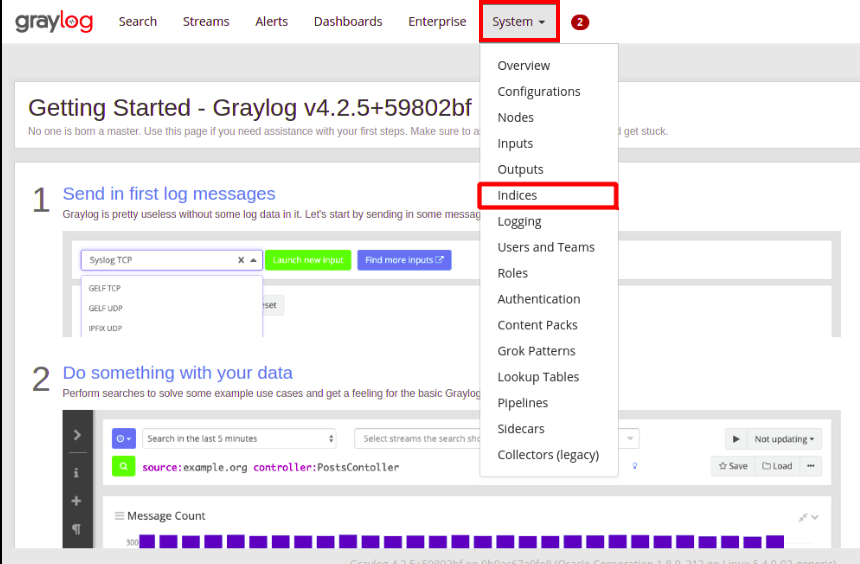
2. Next, click on the System menu —> Indices, as shown below, to access the Indices & Index page (step three), where you can choose to edit the default index set.
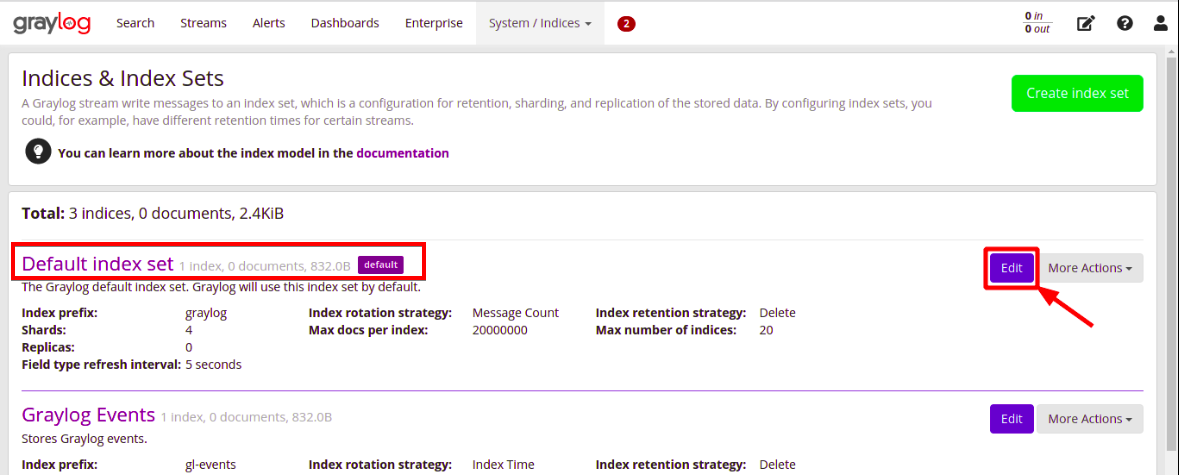
3. Click on Edit to manage Graylog’s default index set and change the ElasticSearch shard value. The default value for ElasticSearch shards is four, and you’ll need to change that (step four).
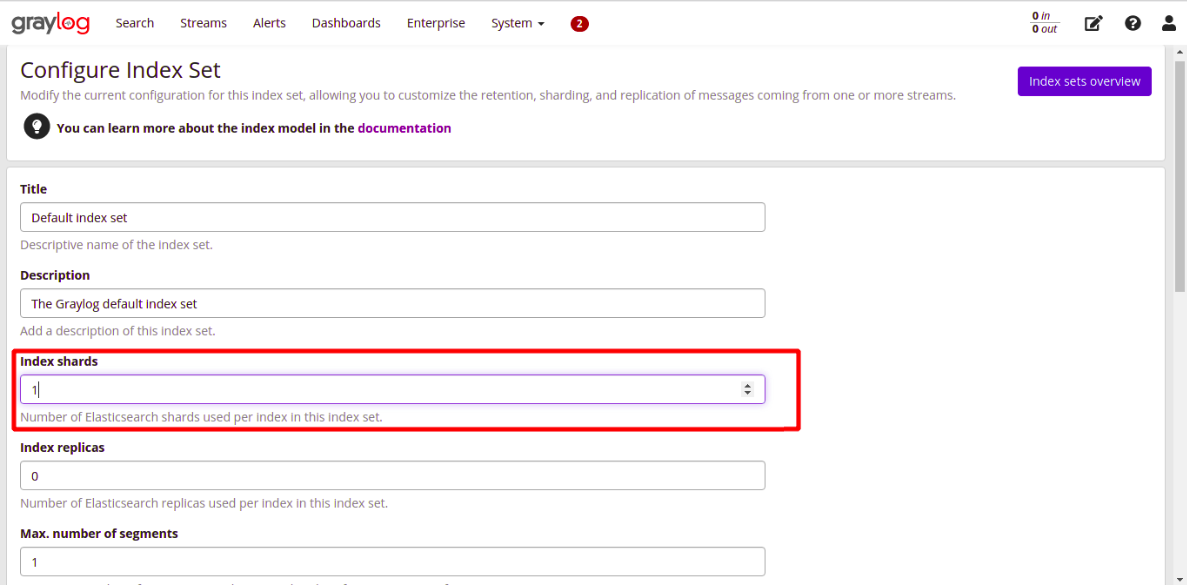
4. Finally, change the number of ElasticSearch shards to one (1) as you’re running only a single ElasticSearch node/container, and click on Save at the bottom of the page.
Setting up Graylog to Collect Logs from Syslog
You’ve just configured Graylog by changing the value for Index shards for ElasticSearch. But you’ll also need to set up Graylog to collect log data from Syslog in the client machine. How? You’ll set up Graylog inputs to receive log data sent from your client machine via Syslog for parsing in the host machine.
With Syslog as a standard network-based logging protocol, you can transport your client machine’s event messages or log data to Graylog.
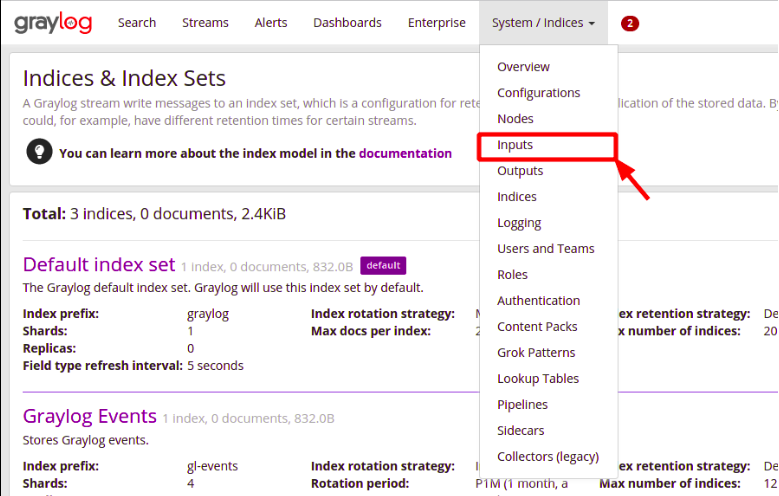
1. Click on the System menu —> Inputs to access the Inputs page, where you’ll set up a Syslog UDP input.
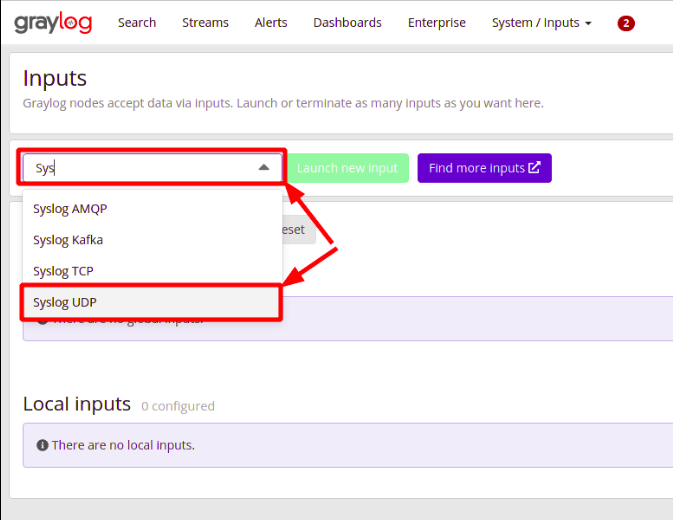
2. Search for and select Syslog UDP in the search box, as shown below, then click on Launch new input.
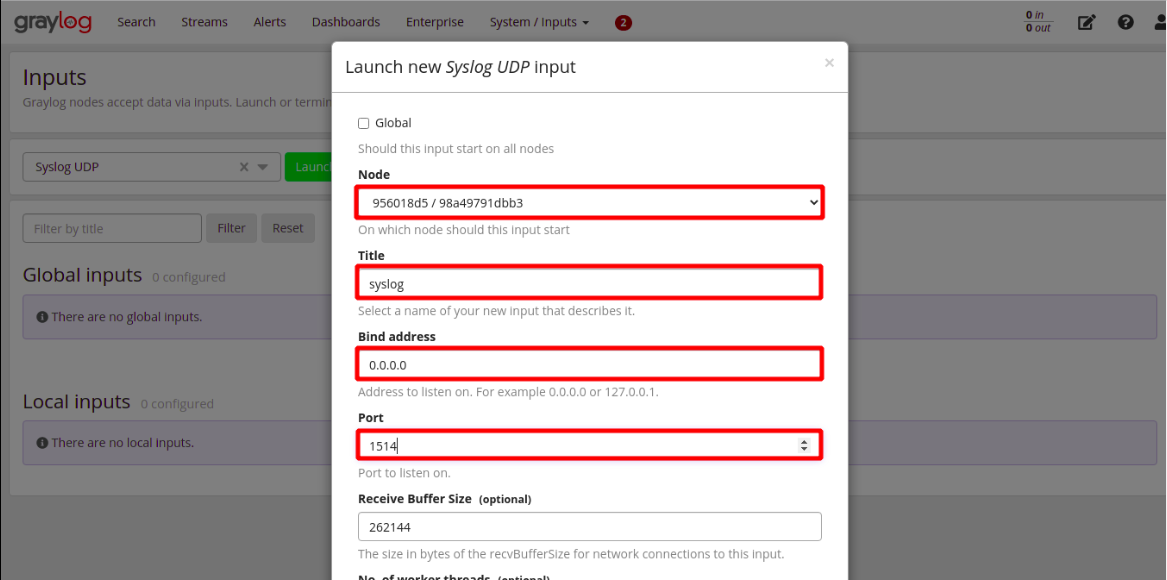
3. Lastly, configure the new Syslog UDP input with the following, and click on Save at the bottom of the pop-up window to keep and apply the changes:
- Select your node from the Node drop-down box.
- Set the Title to any word you wish. For this demo, the title is syslog.
- Set the Bind address to 0.0.0.0, so Graylog can listen to incoming events anywhere.
- Set the Port to the Syslog UDP port
1514as defined in the docker-compose.yml file underSyslog UDP.
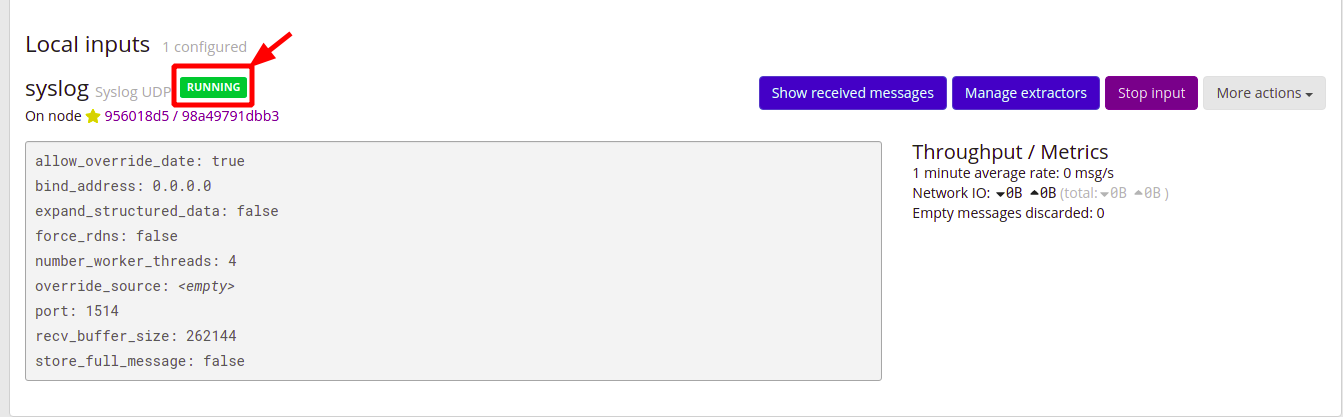
Below, you’ll see the Syslog UDP input is running as part of Local inputs after configuration.
Configuring Rsyslog to Send Syslog Data to Graylog
You’ve set up a Syslog UDP input to receive data sent from your client machine, but how do you send the data to Graylog? Rsyslog will do the trick!
You’ll create a configuration file for Rsyslog to push your Syslog data from your client machine to Graylog running in your host machine.
1. Create a configuration file in the /etc/rsyslog.d directory on your client machine. You can name the file as you prefer, but the file is called 90-graylog.conf for this demo.
2. Next, add the following line to the 90-graylog.conf file, save the changes and close the editor. Replace 34.76.103.44 with your host machine’s IP address where Graylog is running.
The below configuration sends Syslog data (RSYSLOG_SyslogProtocol23Format) from the host machine (@34.76.103.44) to Graylog.
*.* @34.76.103.44:1514;RSYSLOG_SyslogProtocol23Format3. Run the below command to restart rsyslog for the changes to take effect.
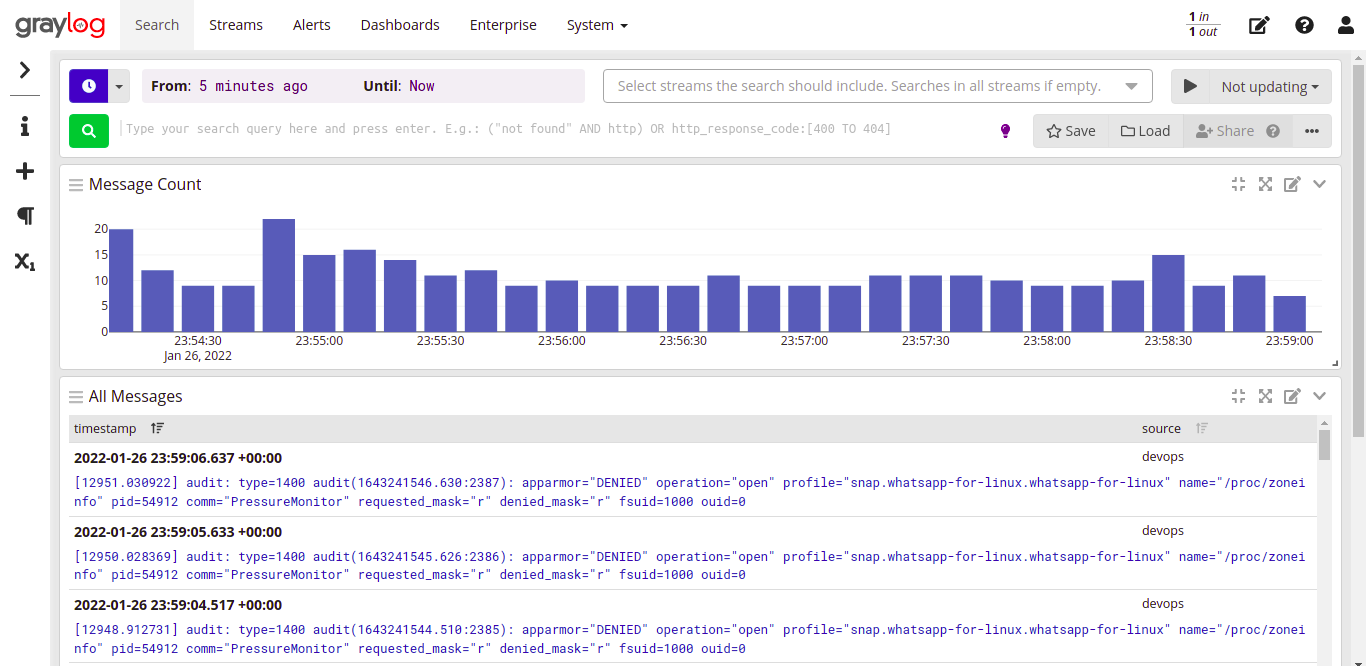
sudo systemctl restart rsyslog4. Switch back to the Graylog web interface and click on the Search menu to see your Syslog data collected neatly parsed similarly to the one below.
Conclusion
In this tutorial, you’ve learned to create your own centralized log management system with Graylog using Docker and verified successfully collected Syslog data from your client machine.
At this point, you’ve realized collecting and storing well-organized data in a secure environment for analysis will not be a pain anymore.
What other logs can you collect with Graylog? Perhaps set up a web host to send NGINX logs to Graylog for further parsing and analysis?


