


Monitoring network traffic may sound like tedious work. Well, not when you have ntop next generation (ntopng) at your fingertips.
In this tutorial, you will learn how to set up and configure ntopng in a Linux server. It lets you gather information about live hosts, SNMP network devices, firewalls, and IDS logs.
Ready? Discover ntopng, and start keeping an eye on your network traffic!
Prerequisites
This tutorial comprises hands-on demonstrations. To follow along, ensure you have the following:
- A Linux server – This demonstration uses an Ubuntu 22.04 server with IP address 192.168.5.100.
- A non-root user with sudo privileges.
- Multiple network interfaces on your Linux server – This tutorial uses two interfaces, enp0s8 and enp0s9.
Installing ntopng and Dependencies
ntopng is a packet capture and traffic recording software available on most operating systems (OSes), including Linux, Unix, MacOS, and Windows. But even though it is cross-platform compatible, it is not installed by default.
Before getting 360° network visibility, you must install it, in this case, on a Linux machine. The good news is that it provides binary packages for multiple Linux distributions, including Ubuntu.
To install on Linux, follow these steps:
1. Open a terminal, and run the following apt install command to install basic dependencies for managing repositories.
sudo apt install software-properties-common curl -y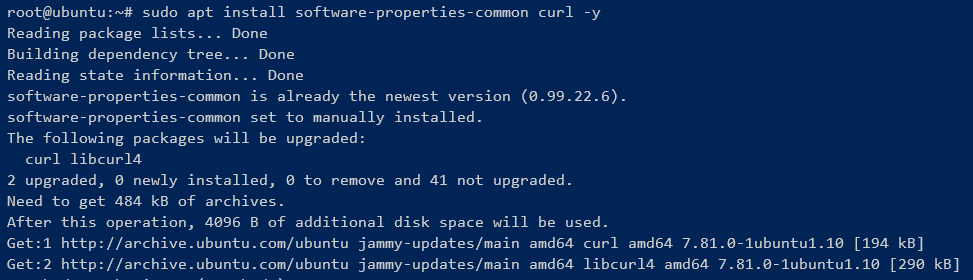
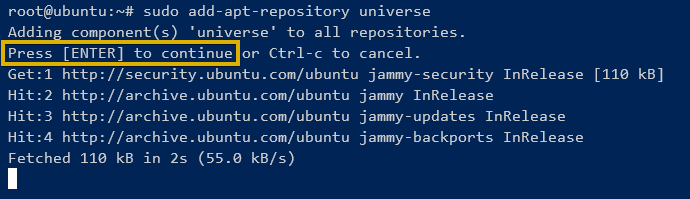
2. Next, run the add-apt-repository command below to enable the Ubuntu universe repository since some dependencies are available on the Ubuntu universe repository.
sudo add-apt-repository universePress ENTER to confirm when prompted, as shown below.
3. Once the universe repository is enabled, run the below commands to download (curl) and add (dpkg) the repository (apt-ntop-stable.deb) to your system.
# Download the ntopng repository
curl -qO <https://packages.ntop.org/apt-stable/22.04/all/apt-ntop-stable.deb>
# Add the ntopng repository to the system
sudo dpkg -i apt-ntop-stable.deb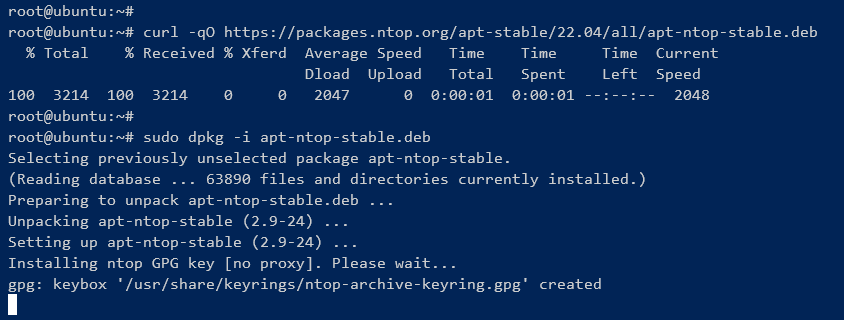
4. Now, run the following apt update command to update and refresh your Ubuntu package index.
sudo apt update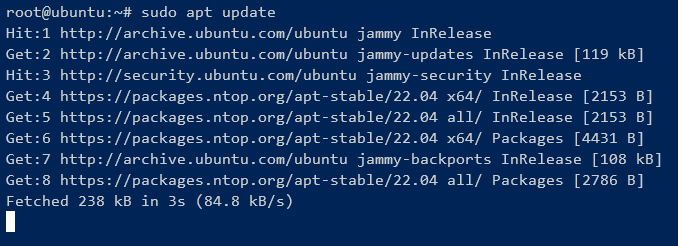
5. Once the package index is updated, run the command below to install it and its tools.
sudo apt install pfring-dkms nprobe ntopng n2disk cento -y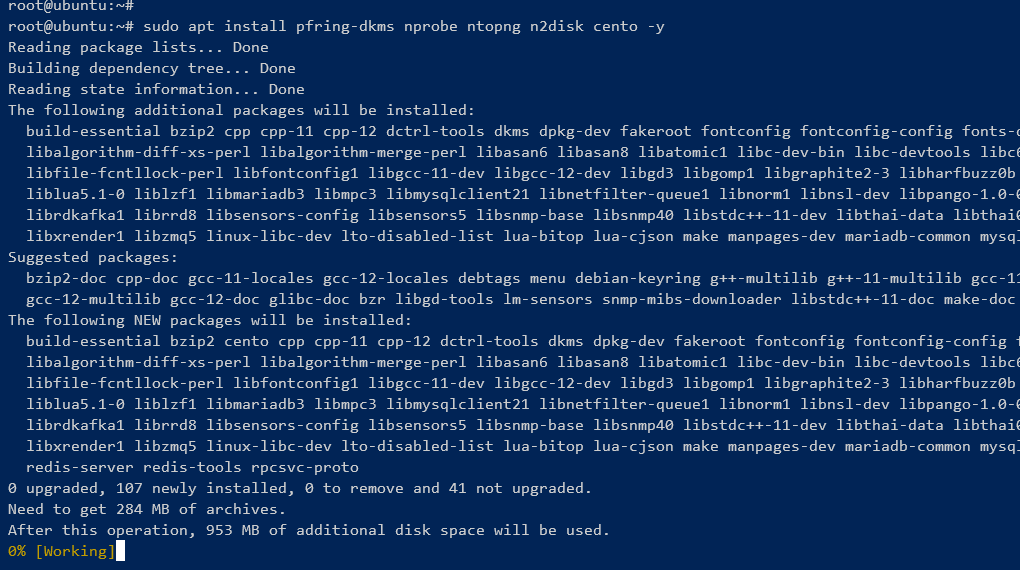
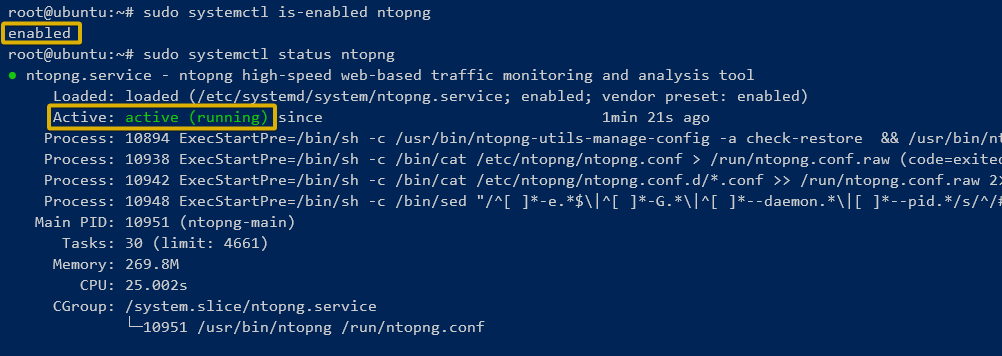
6. Lastly, enter the following systemctl commands to ensure the ntopng service is-enabled and running.
sudo systemctl is-enabled ntopng
sudo systemctl status ntopng
If all goes well, you will see the status below that confirms that ntopng is enabled and running.
Configuring ntopng for Monitoring Network Interfaces
Once installed and running, delve deeper into ensuring it keeps an eye on your network traffic. You will create a custom ntopng configuration for monitoring network interfaces.
To configure, follow these steps:
1. Create a new custom configuration file (/etc/ntopng/ntopng.conf.d/custom.conf) using your preferred text editor.
2. Next, adjust and insert the following configuration into the file, save the changes, and exit the editor.
This configuration makes it in the background as a system daemon and captures network activity on IPv4.
# Run ntopng as a non-root user, which was created during the installation.
--user=ntopng
# Run ntopng on specific Linux server IP address and HTTP port.
-w=192.168.5.100:3000
# The network interface name to monitor.
--interface=enp0s8
# Ingress BPF packet filter. This example only captures network activity on IPv4
# and ignore the host IP address.
--packet-filter="ip and not proto ipv6 and not ip multicast and not ether broadcast and not ether host ff:ff:ff:ff:ff:ff and not host 192.168.5.2"
# Start ntopng community edition.
--community
# Run ntopng in the background as a system daemon.
--daemon
3. With the configuration in place, run the following command to restart the service and apply the changes that you have made.
This command does not provide output, but once the service restarts, it runs with new configurations.
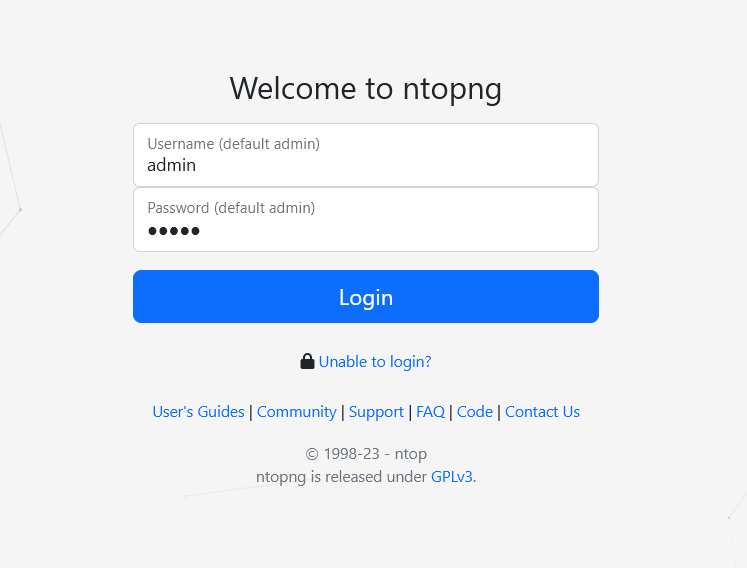
sudo systemctl restart ntopng4. Now, open your preferred web browser and navigate to the server IP address followed by port 3000 (i.e., http://192.168.5.100:3000) to access.
5. Log in to via the default username (admin) and password (admin), as shown below.
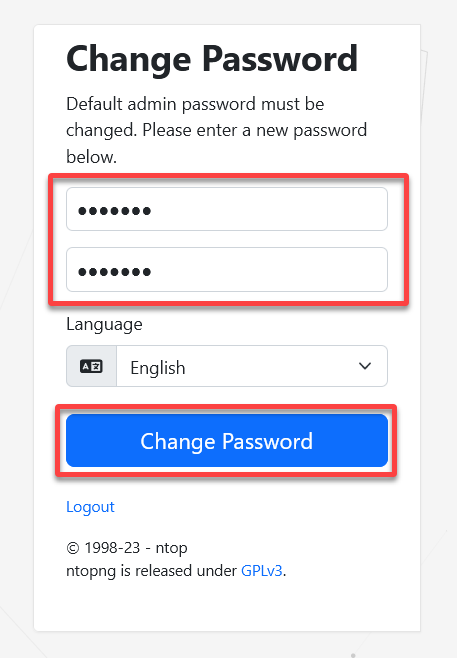
6. When prompted, input a new password to secure the admin account, and click Change Password to confirm the change.
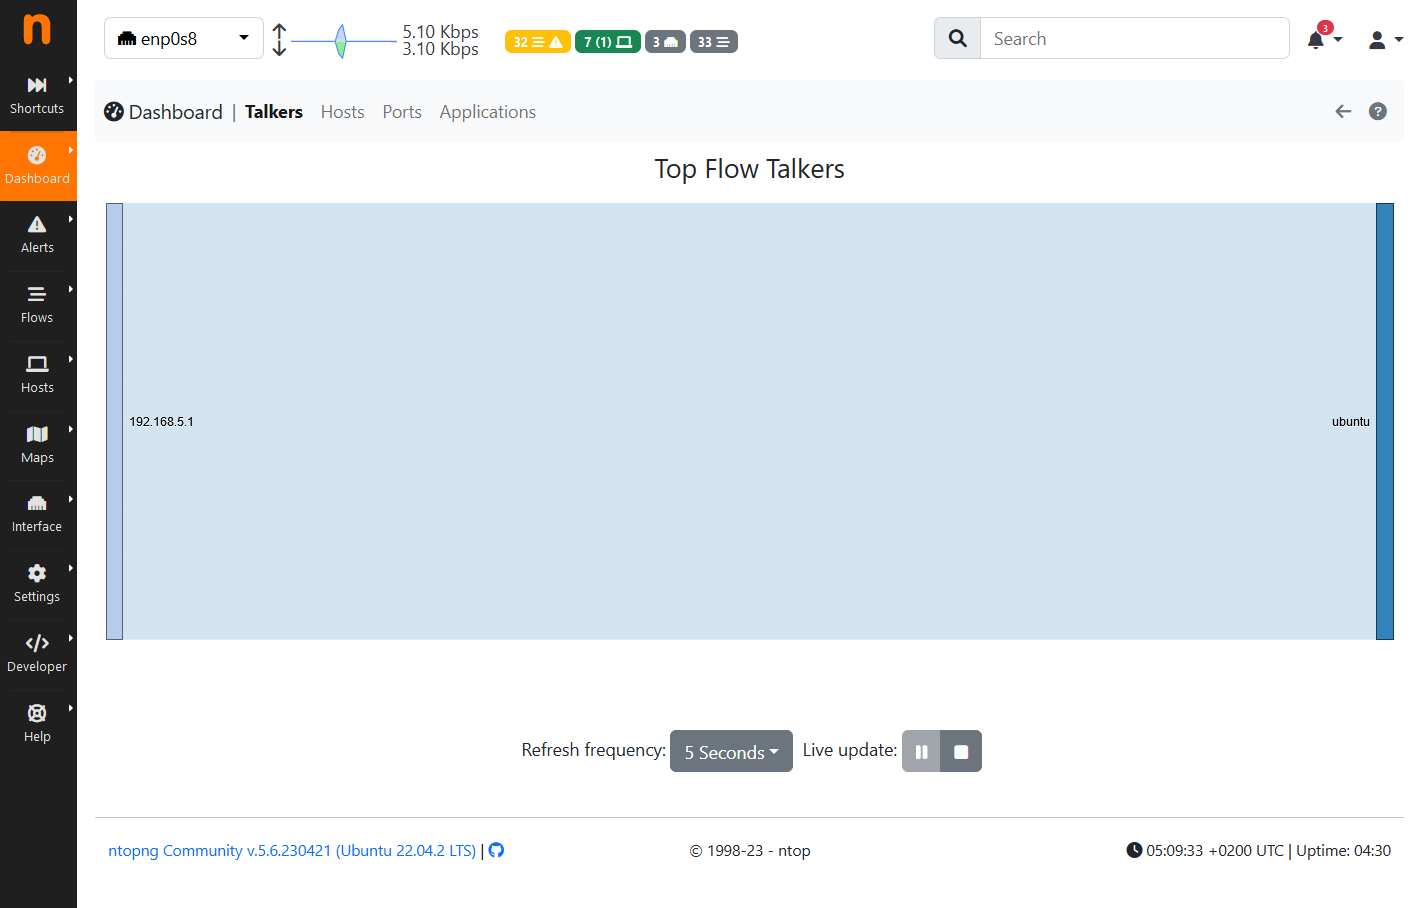
7. Once logged in, you will see the Traffic Dashboard showing the monitoring target of your network interface, as shown below.
ntopng is an open-source network traffic monitoring and flow tool. It’s a drop replacement of ntop, but with enhanced features, high performance, and low resource server.
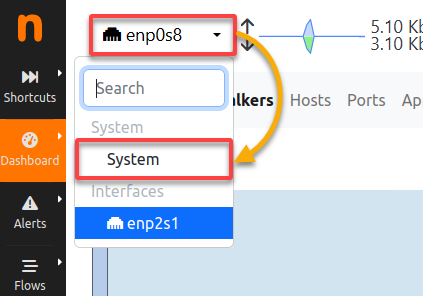
8. Lastly, click on the interface dropdown menu (top-left) and choose System to access the System interface dashboard.
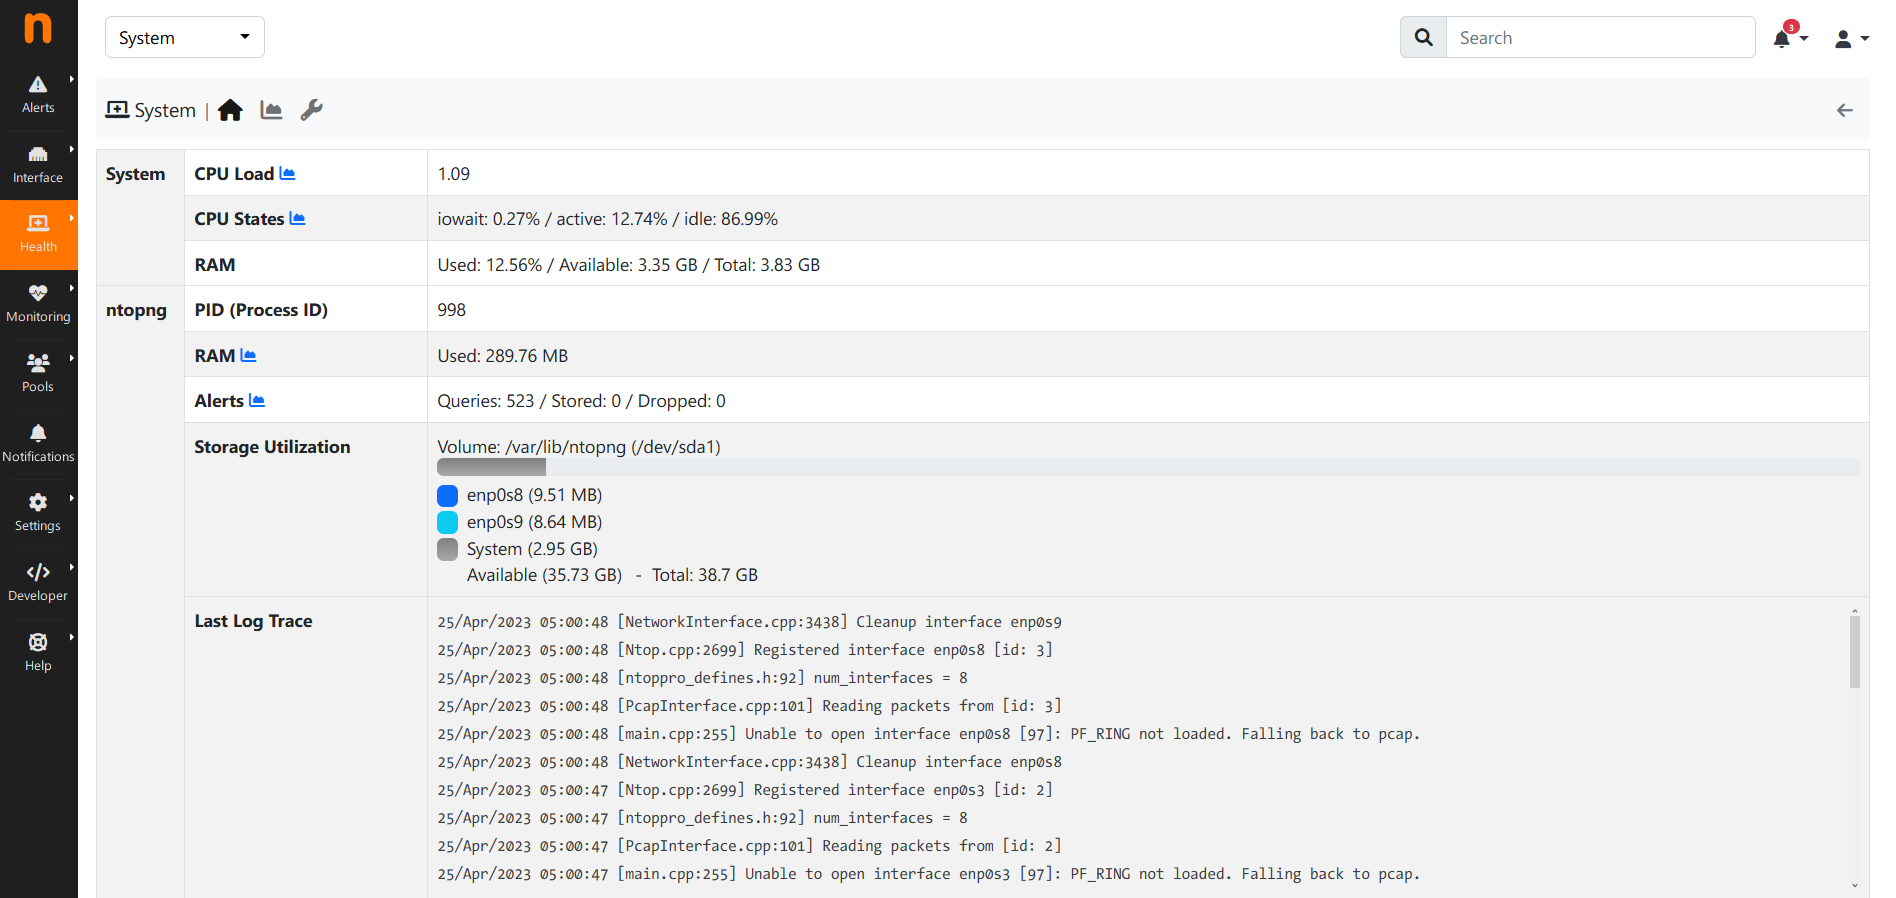
As shown below, the ntopng System interface displays the detailed status of the ntopng system, such as CPU Load, Memory usage, and Last log trace.
Running Network Discovery with ntopng
Network Discovery is a process in which it tries to reach and contact all available hosts within the local network or target network interface. During the process, it uses multiple protocols such as ARP, SSDP, MDNS, and SNMP.
To see how it’s Network Discovery works:
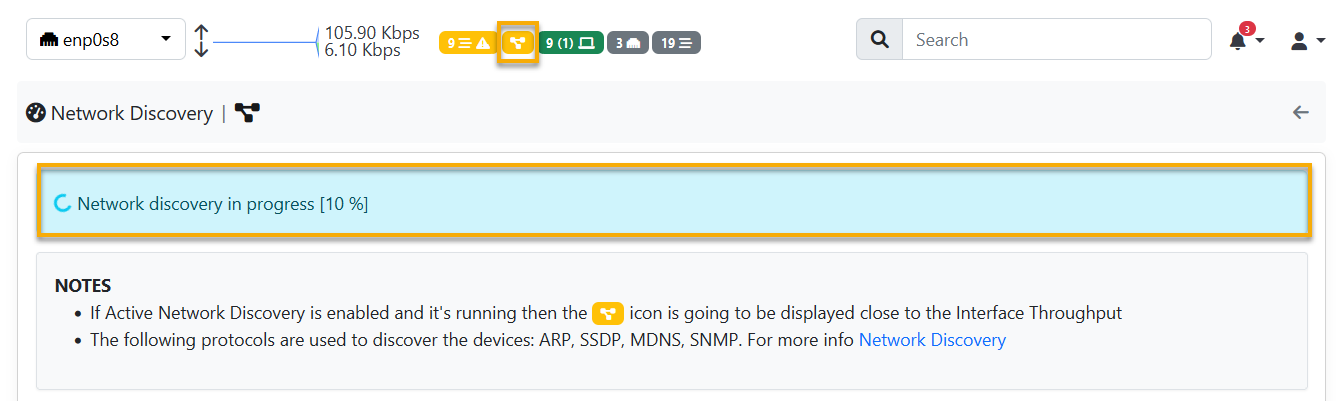
1. Click on the Dashboard menu (left navigation pane) → Network Discovery, and click Run Discovery to run Network Discovery.
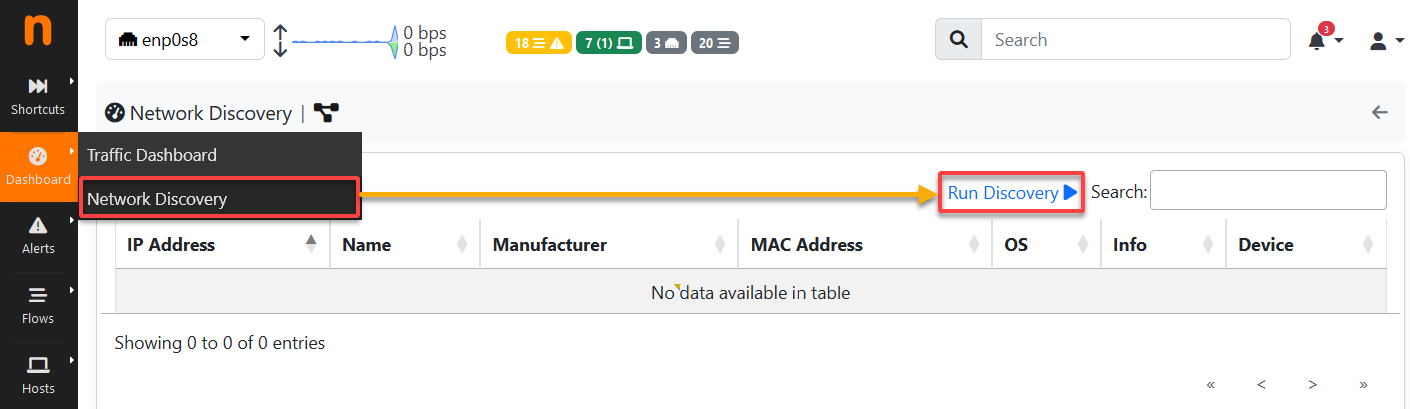
During the process, the Network Discovery icon appears at the top, as shown below, and information progress should be visible.
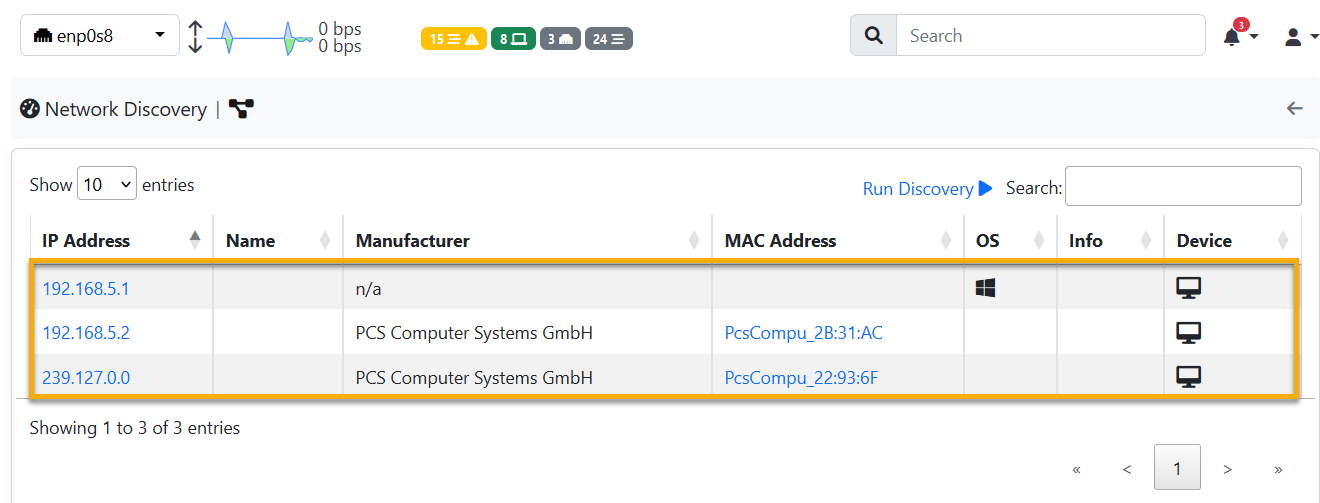
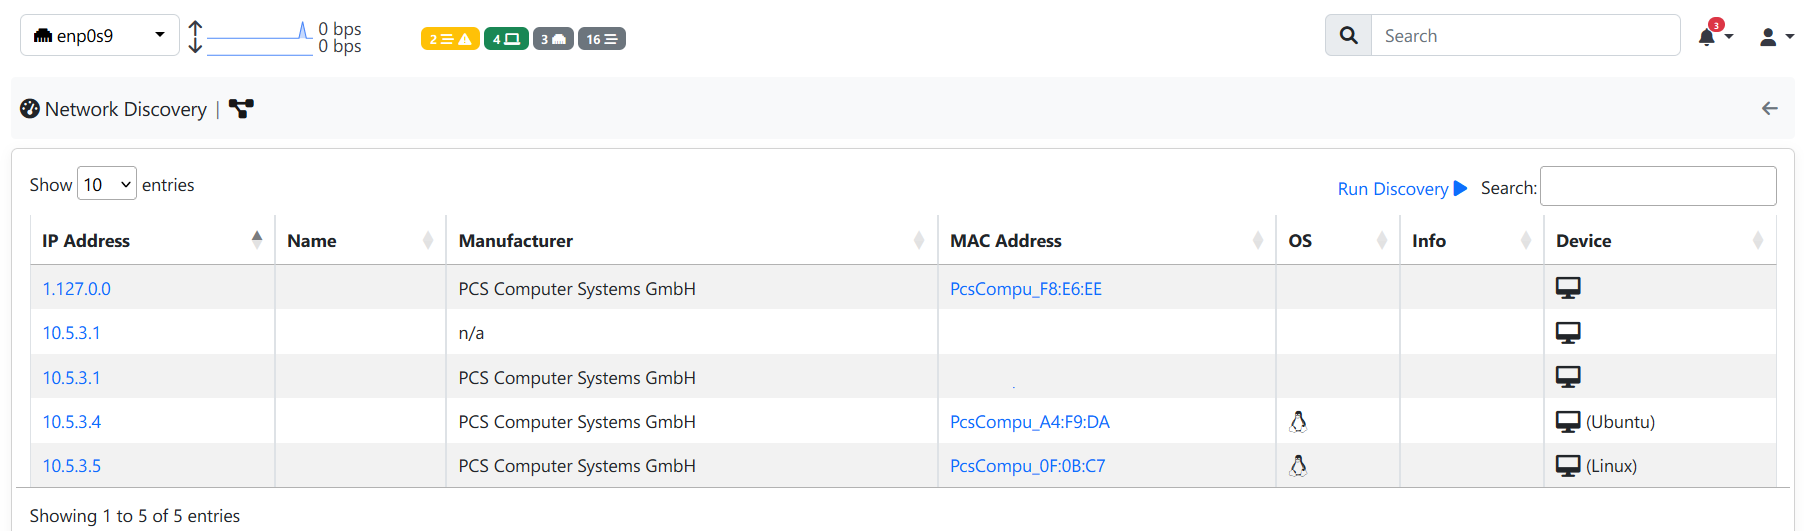
When finished, the live hosts within the local network should be displayed in the Network Discovery section. The information includes the IP address, Manufacturer, MAC address, and the OS.
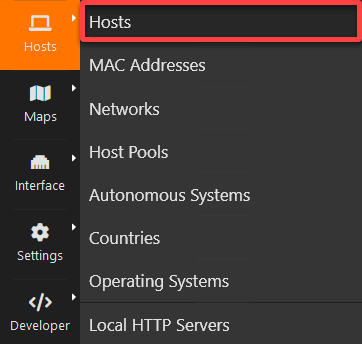
2. Next, click on the Hosts menu and select Hosts to access the list of detected hosts.
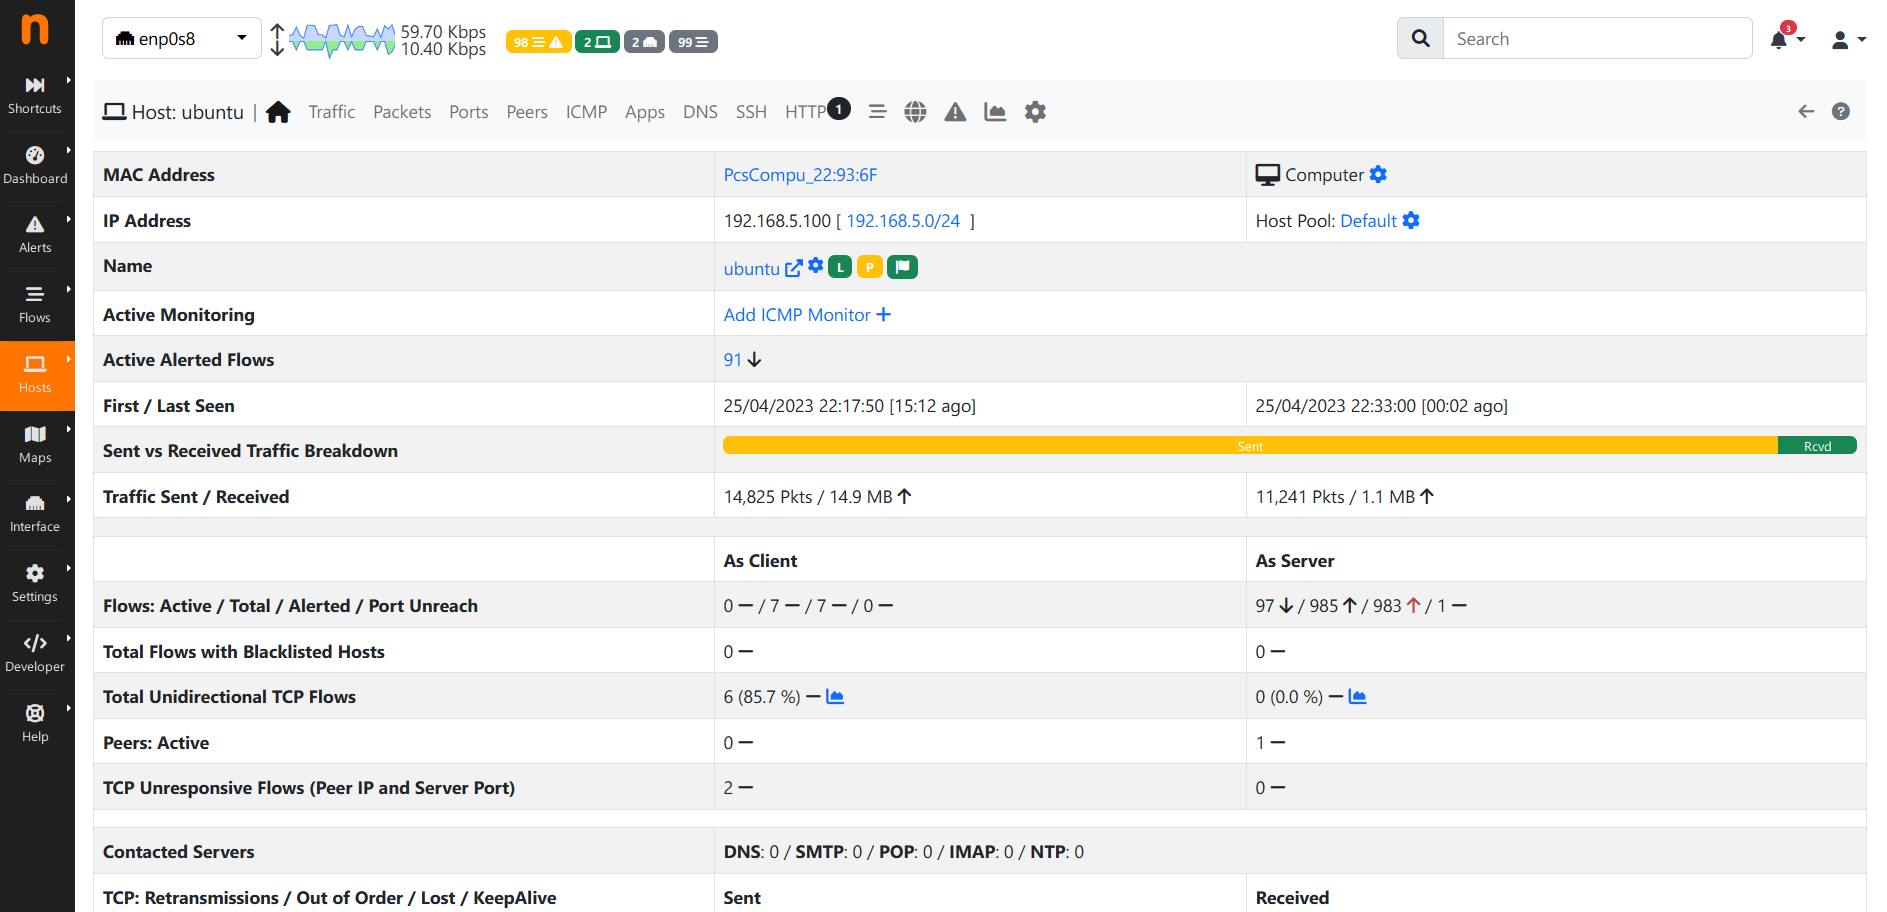
3. Click on a host’s IP address to get its detailed information.
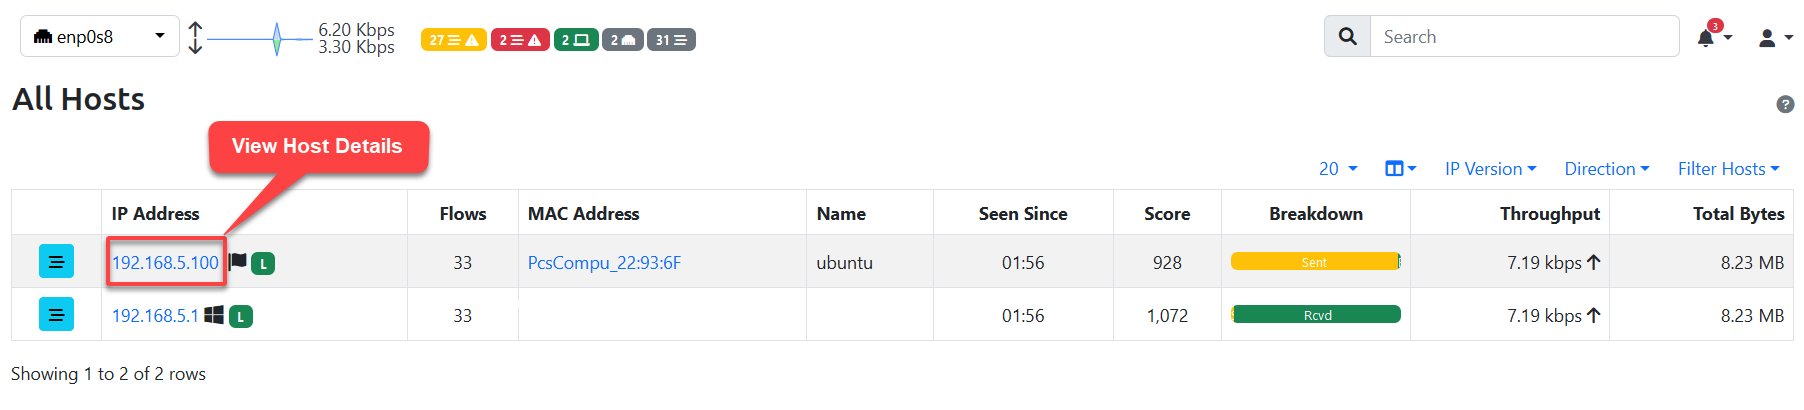
Note that the 192.168.5.2 host is not displayed since you have blacklisted it via the
--packet-filter=parameter in your custom configuration.
Below, you can see a handful of information about the host.
4. Now, return to the All Hosts page, and click the Live Flow icon to see all live connections on the target host.
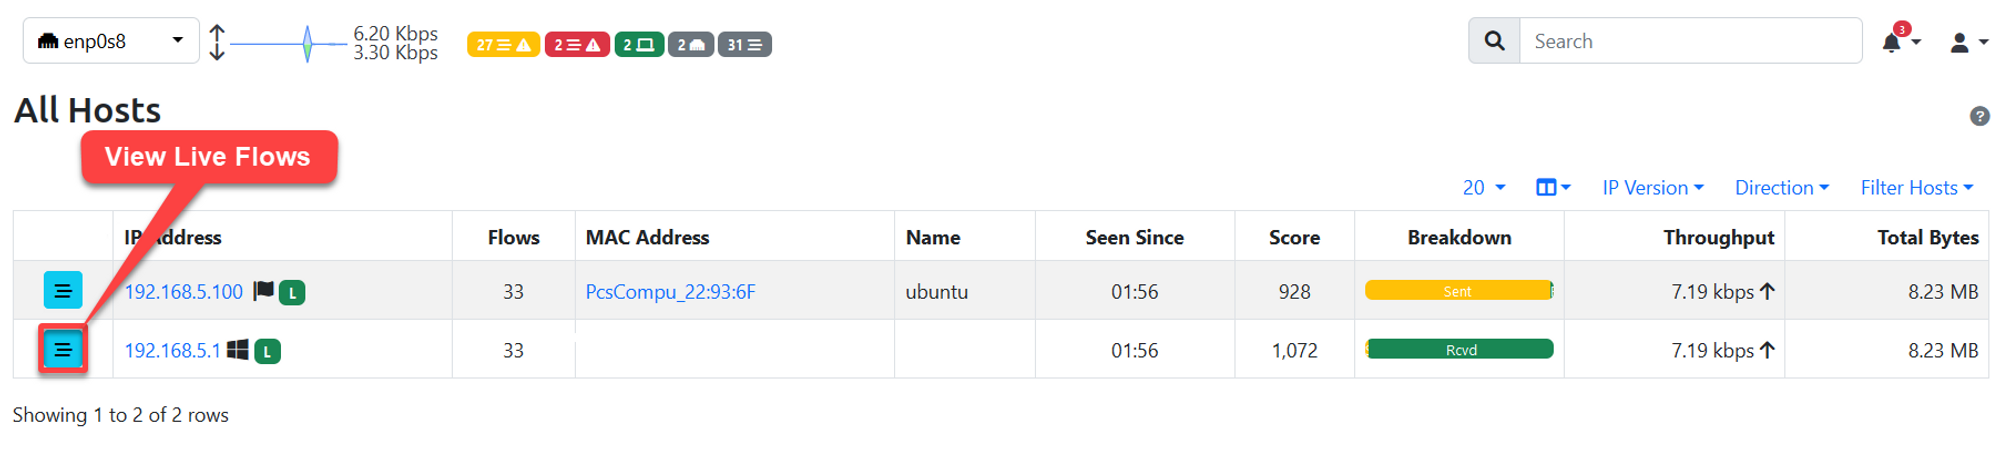
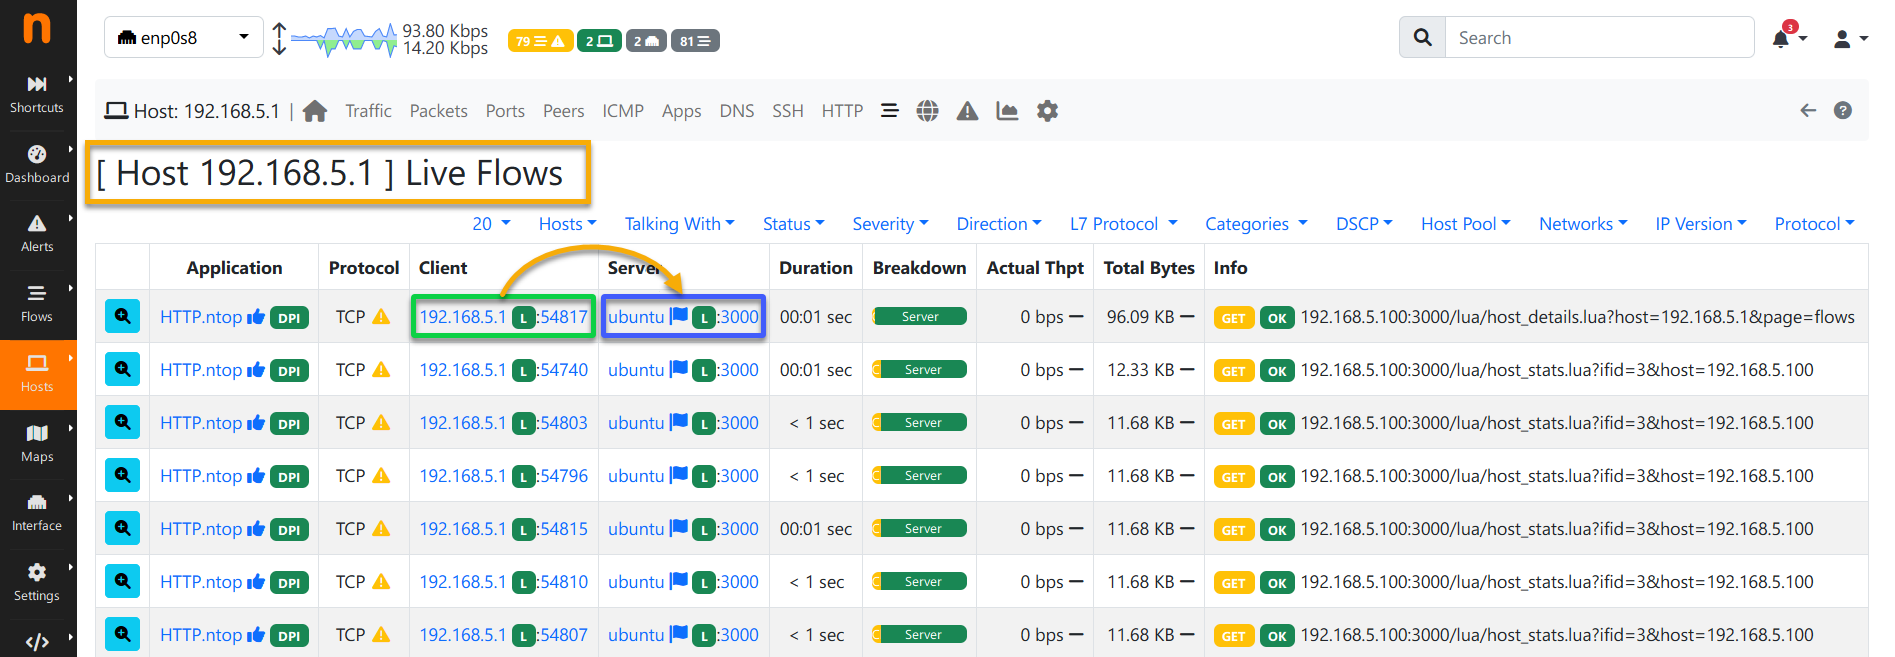
Similar to the one below, you will see all live connections, including the Client and Server addresses.
Managing Host Pools
Managing IP addresses and networks on the target network interface can be tedious. Luckily, host pools come in handy when you are monitoring large networks. How? You will first create a host pool and group up multiple hosts in each department.
A host pool can include the following:
- An IP address – A single host or IP address.
- Mac address – One Mac address is equal to one host.
- Network address – This address can be a Network CIDR IPv4/IPv6.
To create a new host pool, follow the steps below:
1. Click the Shortcut menu → Pools – the + button, which opens a pop-up window where you can name a new host pool.
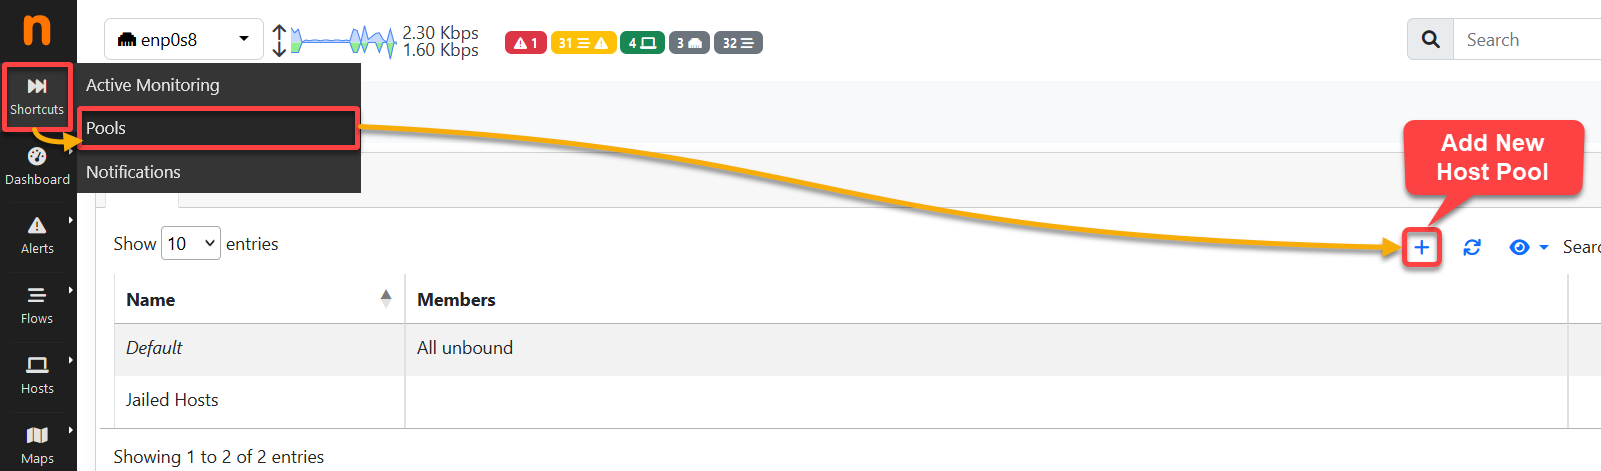
The original Host Pool management is available on the System interface dashboard.
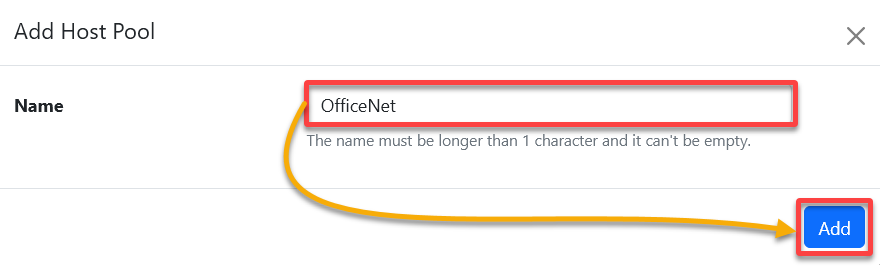
2. Next, provide a descriptive pool name (i.e., OfficeNet), and click Add to confirm adding the new host pool.
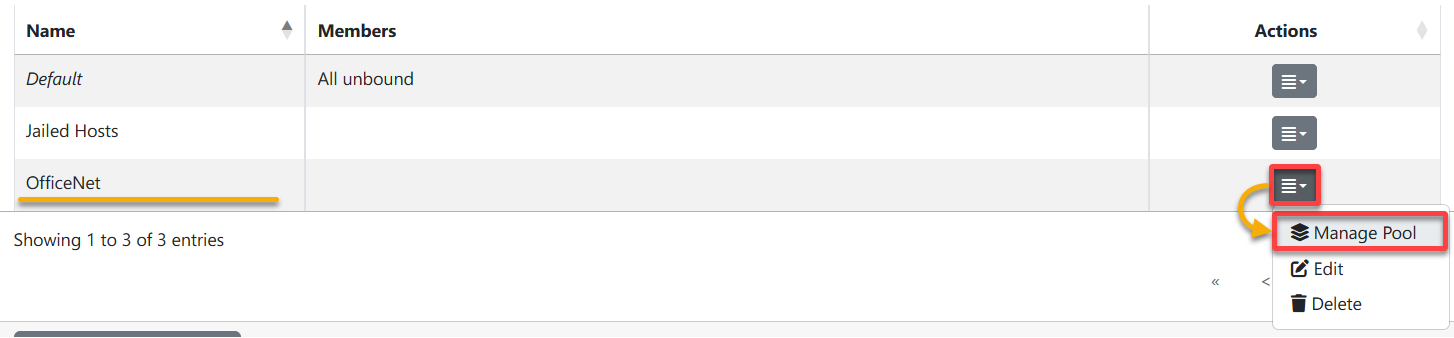
3. Click the Action icon for the newly-created host pool, and select Manage Pool to manage the host pool members.
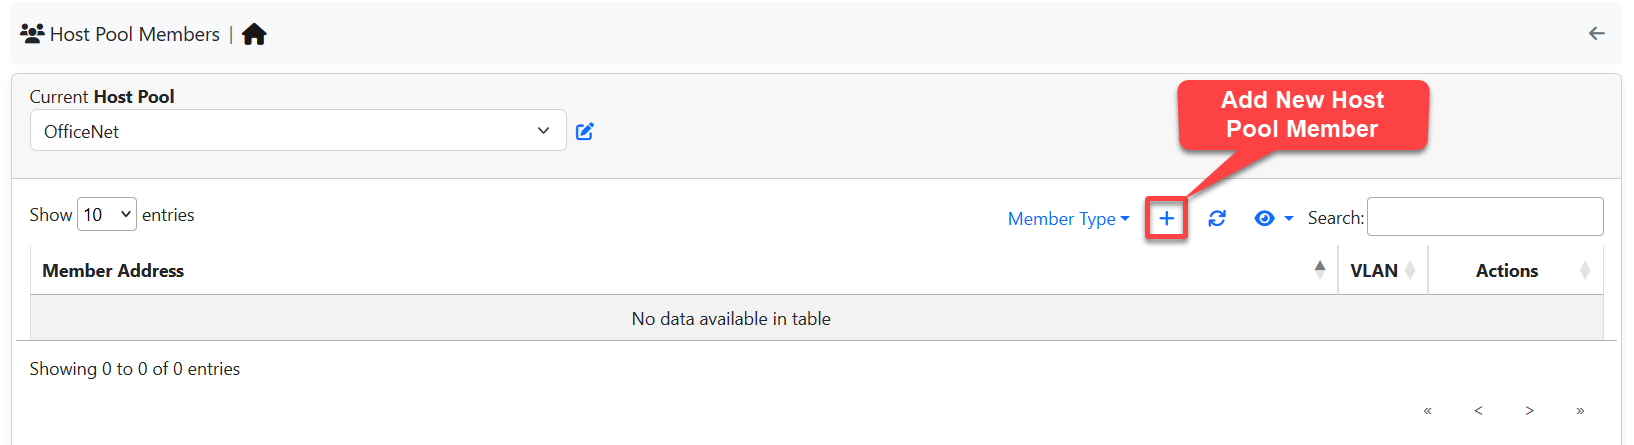
4. Now, on the Host Pool Members page, click the + button, and a pop-up window appears where you can configure the new host pool member.
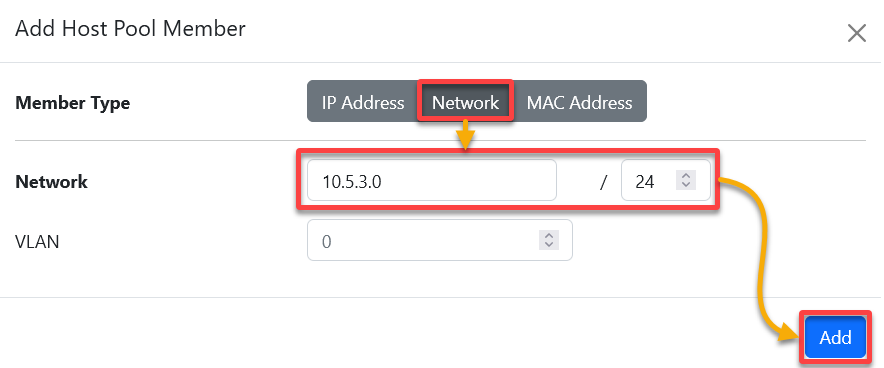
5. On the pop-up window, configure the new host pool member as follows:
- Member Type – Select Network to add your network CIDR.
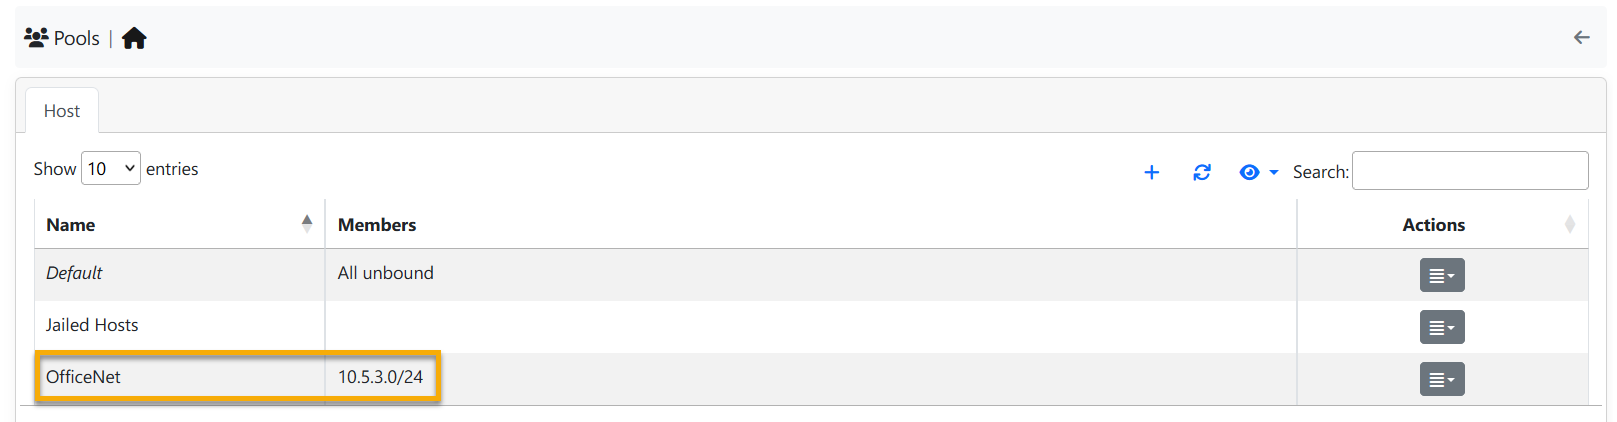
- Network – Provide the Network CIDR to assign (i.e., 10.5.3.0/24).
Once configured, click Add to confirm adding the new network address.
If successful, you will see your network CIDR in the Members column, as shown below.
Monitoring Multiple Network Interfaces
The best scenario for deploying ntopng is right behind your router device. With this deployment type, you can monitor multiple network interfaces and network activity from the top level.
To monitor multiple network interfaces with ntopng:
1. Open the ntopng custom configuration (/etc/ntopng/ntopng.conf.d/custom.conf), and add the new parameter (--interface=enp0s9) for the second network interface.
Change the interface name (enp0s9) to yours, save the changes, and close the editor.
2. Next, run the following command to restart the ntopng service and apply the changes.
This command does not provide output, but you will view the new interface in the following step.
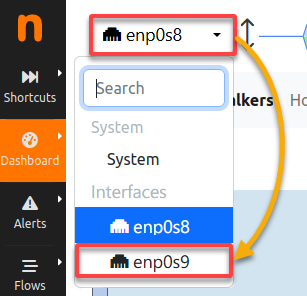
sudo systemctl restart ntopng3. Return to the ntopng dashboard, click the dropdown field (top-left), and select the new interface to monitor, as shown below.
4. Now, run the Network Discovery within the new interface to get the list of available hosts.
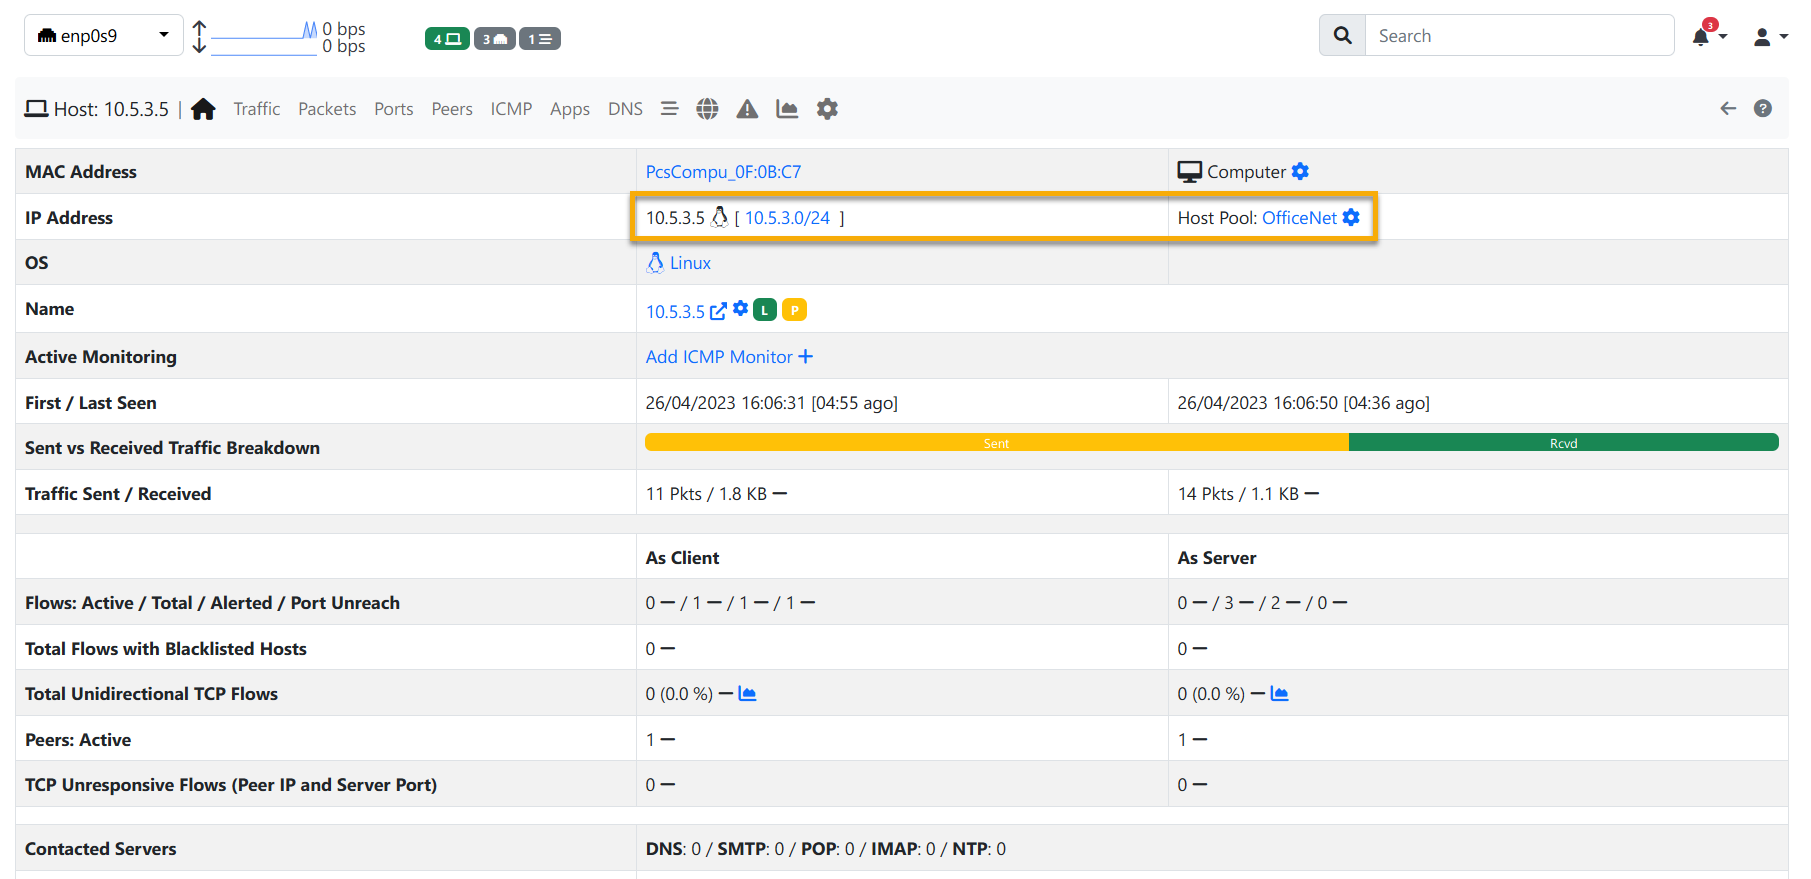
5. After Network Discovery, click the Hosts menu → Hosts → the host’s IP address (i.e., 10.5.3.5) to get detailed information about the host.
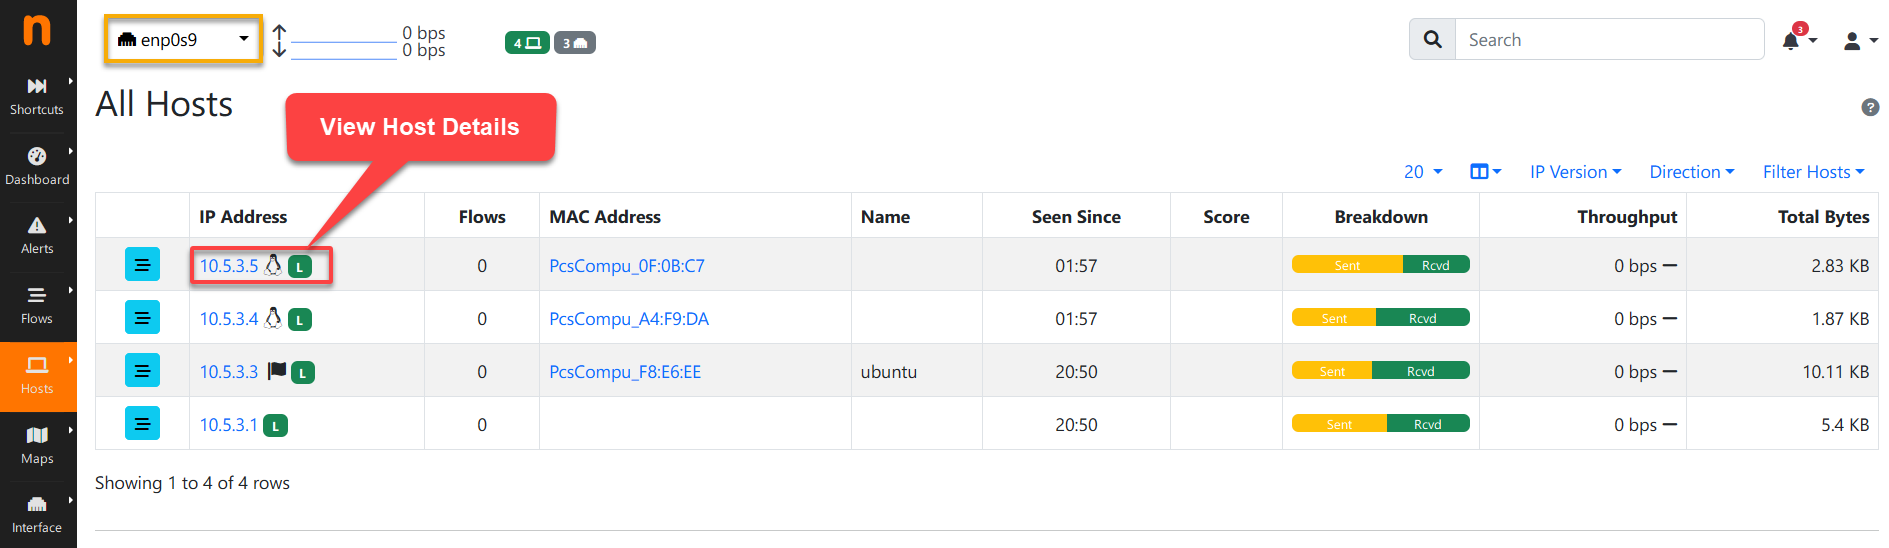
Notice below that the host is part of the OfficeNet pool you created in step two of the “Managing Host Pools” section.
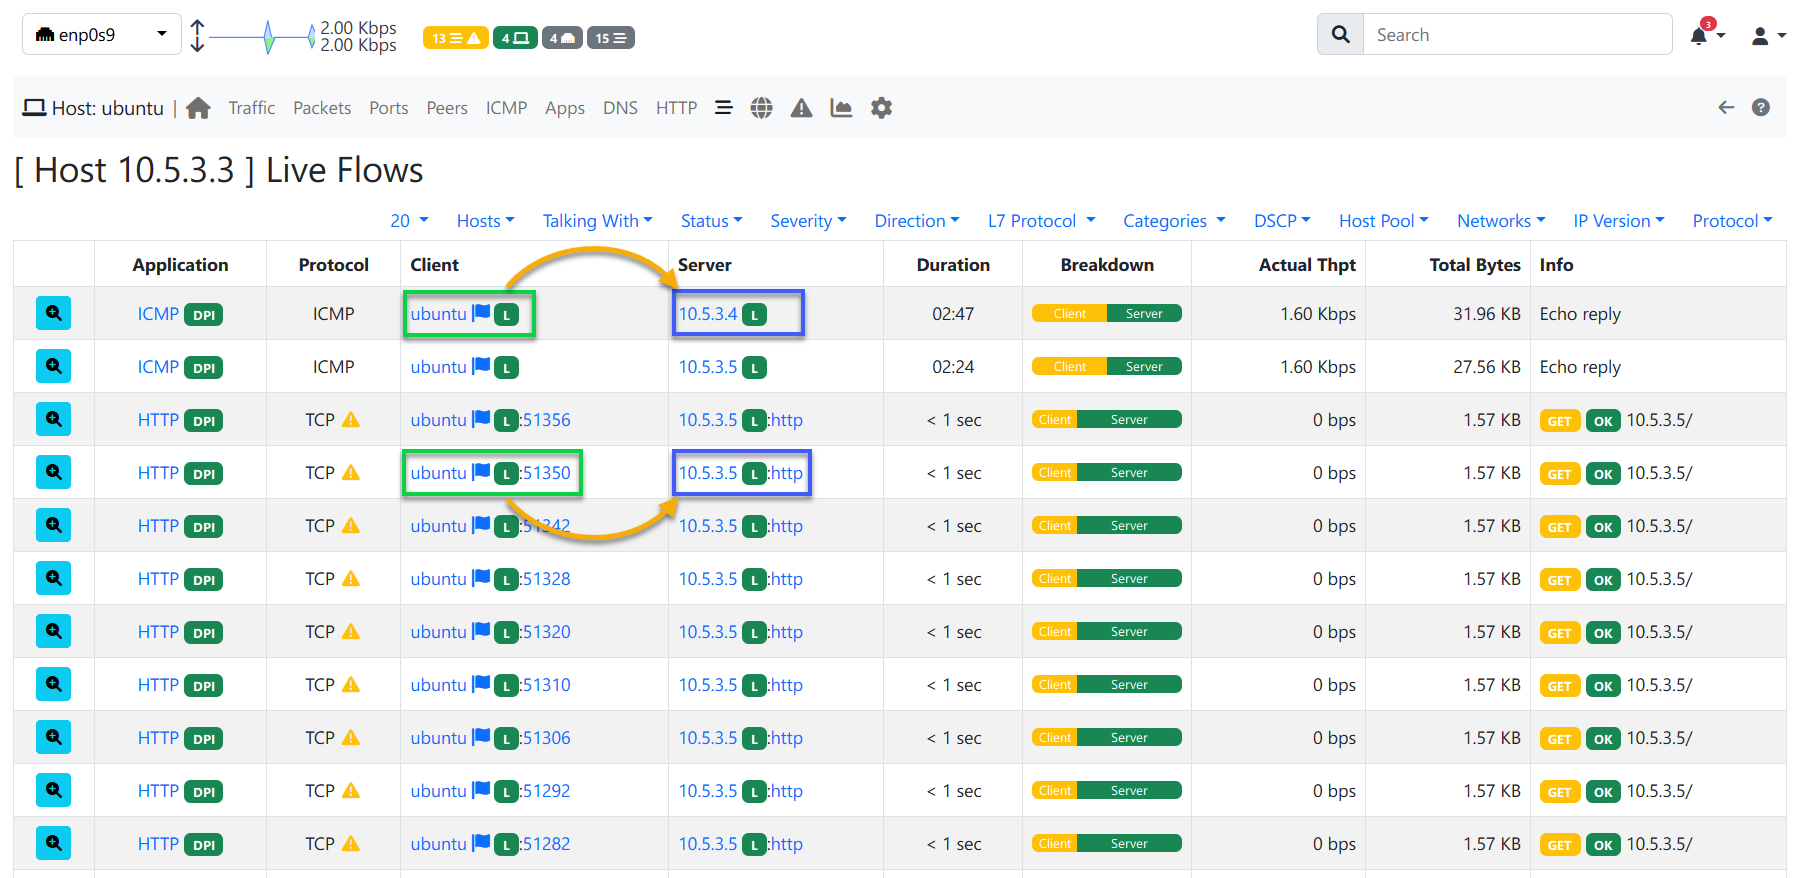
6. Lastly, click the Live Flow icon to view the current network activity on the host.
The Live Flows page below shows you the ICMP ping from the ubuntu host to the 10.5.3.4 host, and the HTTP request to the 10.5.3.5 server.
Conclusion
Great job! Throughout this tutorial, you have learned to set up ntopng, create host pools and monitor multiple network interfaces. Now, you can add more network interfaces and watch over your real-time and historical traffic network activity.
But instead of just viewing network activity, why not store Live Flow network activity in external databases, like Elasticsearch, ClickHouse, and MySQL/MariaDB (deprecated soon)?


