


Need help finding a reliable solution to store and analyze your time series data? Managing time-stamped data on your Linux server can be overwhelming. But with InfluxDB, an open-source time series database (TSDB) for monitoring systems, you can never go wrong.
In this tutorial, you will learn to set up and configure a database for optimal performance with a fully functional InfluxDB installation on your Linux server.
Take control and elevate your data management game to new heights with InfluxDB!
Prerequisites
Before jumping into smooth data management with InfluxDB, ensure you cover the following essential requirements:
- Two Ubuntu servers – This tutorial uses 22.04 servers: one for the InfluxDB server and one for target monitoring.
- A non-root user with root administrator privileges.
Installing InfluxDB on Linux
InfluxDB is the backbone of your time series database, where your data finds its home and purpose. On Ubuntu/Debian, you can install InfluxDB via DEB file, the official InfluxDB repository, or manually via binary file. But in this tutorial, you will install InfluxDB via the DEB file.
To install InfluxDB on your Linux system, follow these steps:
1. Open a terminal, and execute the curl command below to download the InfluxDB DEB package.
curl -O https://dl.influxdata.com/influxdb/releases/influxdb2_2.7.4-1_amd64.deb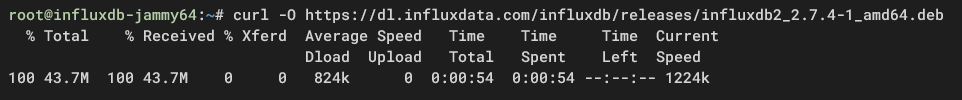
2. Once downloaded, run the following dpkg command to install InfluxDB via the downloaded DEB file (influxdb2_2.7.4-1_amd64.deb).
This command installs InfluxDB to the /etc/influxdb directory with the service file influxdb.
sudo dpkg -i influxdb2_2.7.4-1_amd64.deb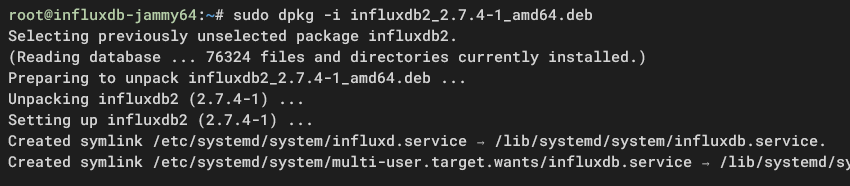
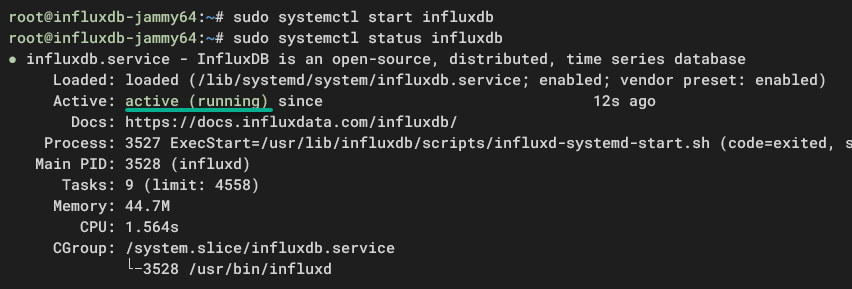
3. Now, run each systemctl command below to start and verify the influxdb service (status).
sudo systemctl start influxdb
sudo systemctl status influxdbAs you can see below, the influxdb service runs on the default TCP port 8086.
4. Lastly, run the below ss command to verify and ensure port 8086 is used by the influxd application.
ss -tulpn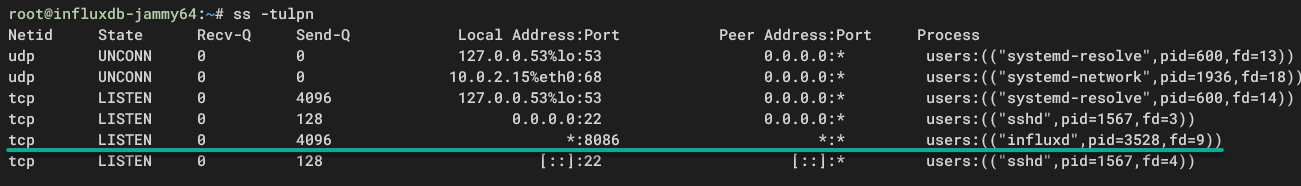
Initializing the InfluxDB Web Interface
With InfluxDB installed and running, you must ensure you have the administrative privileges to manage your InfluxDB instance effectively. You will initialize the InfluxDB admin user and create the first workspace and time series database on InfluxDB.
To initiate InfluxDB, perform the following:
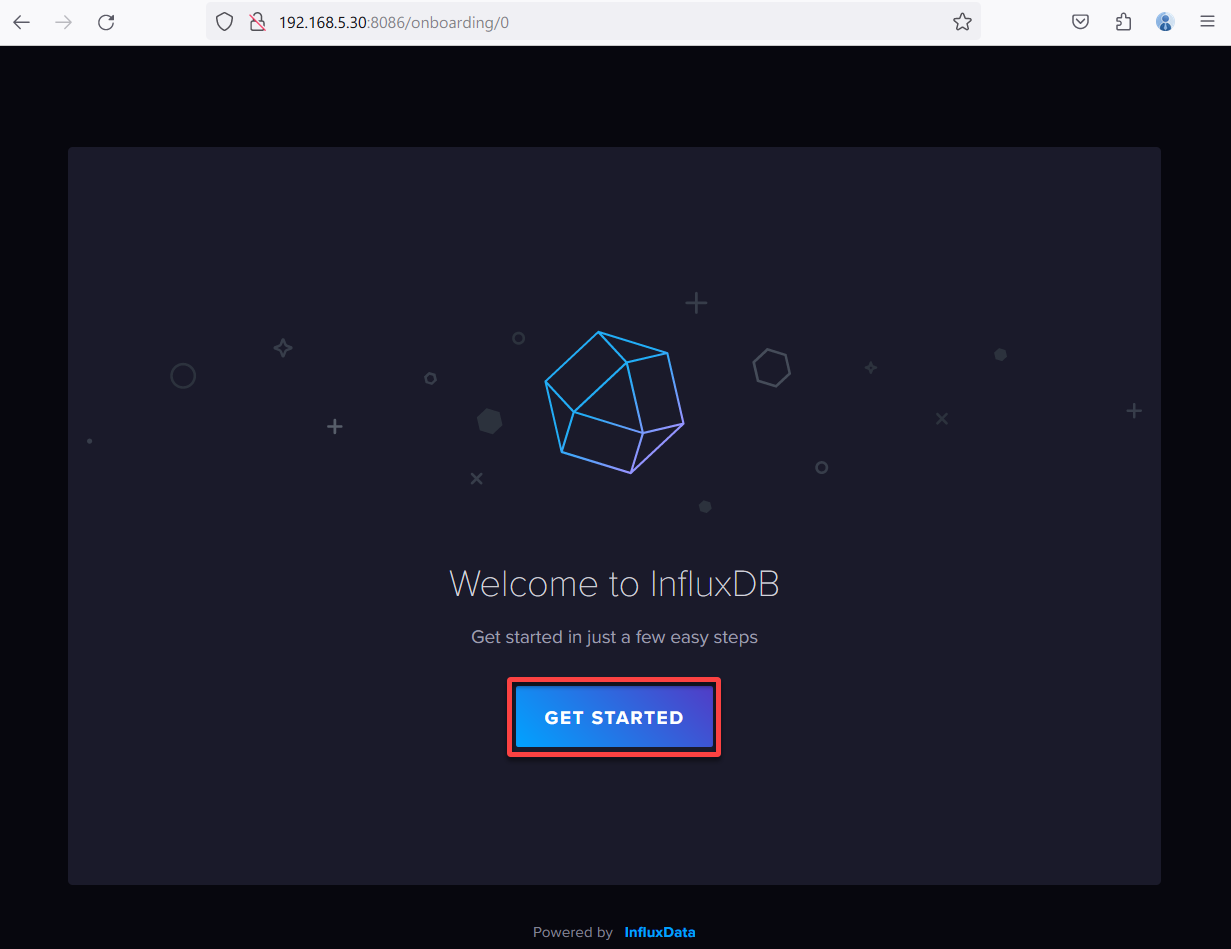
1. Open your preferred web browser on your local computer, visit http://SERVER-IP:8086/, and click GET STARTED, as shown below. Doing so initiates accessing the InfluxDB web interface locally, so ensure you replace SERVER-IP with your Ubuntu server IP address.
Note that this page only opens if you have successfully installed InfluxDB on your system.
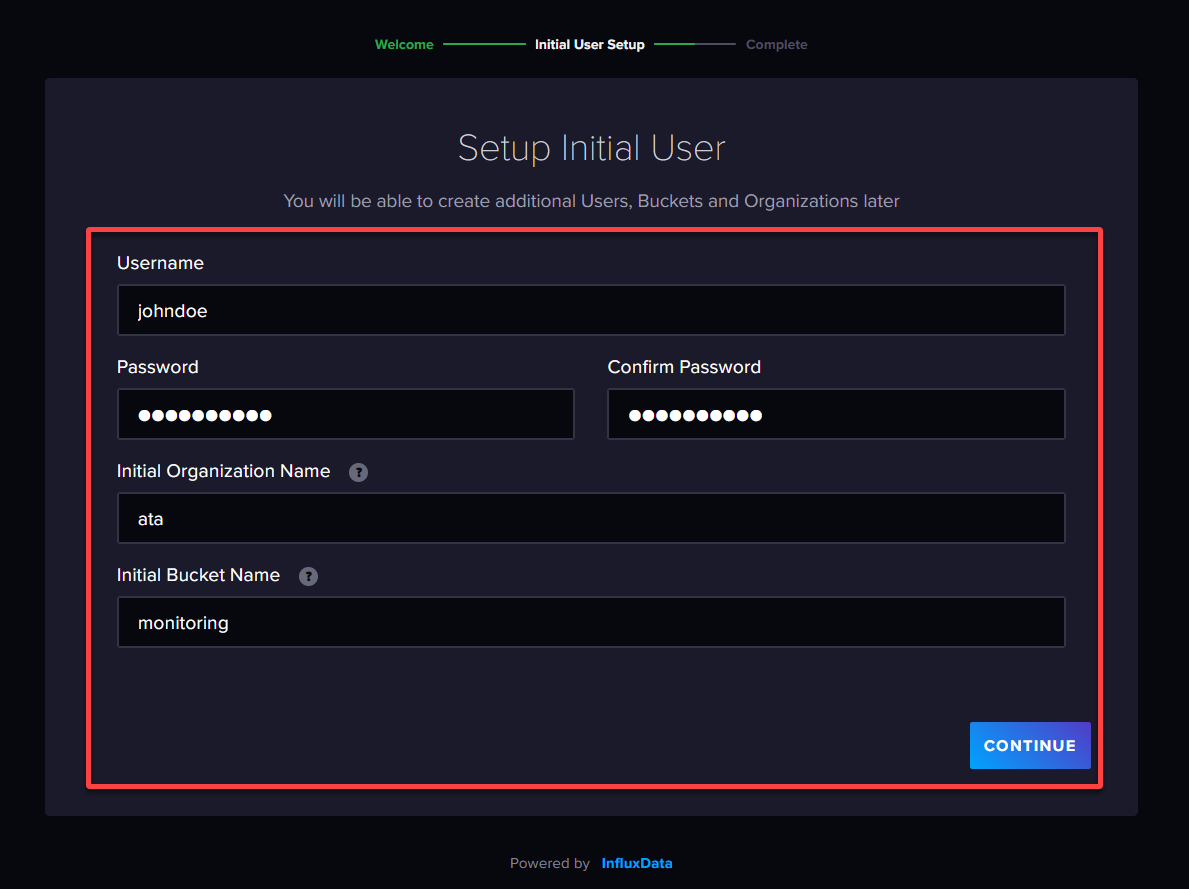
2. Next, configure the initial InfluxDB user with the following:
- Username and Password – Provide credentials for the new InfluxDB user.
- Initial Organization Name – Specify the workspace where multiple users can manage the same project.
- Initial Bucket Name – Define a storage name where time series data are stored, similar to a database in SQL.
Once configured, click CONTINUE to create the initial user.
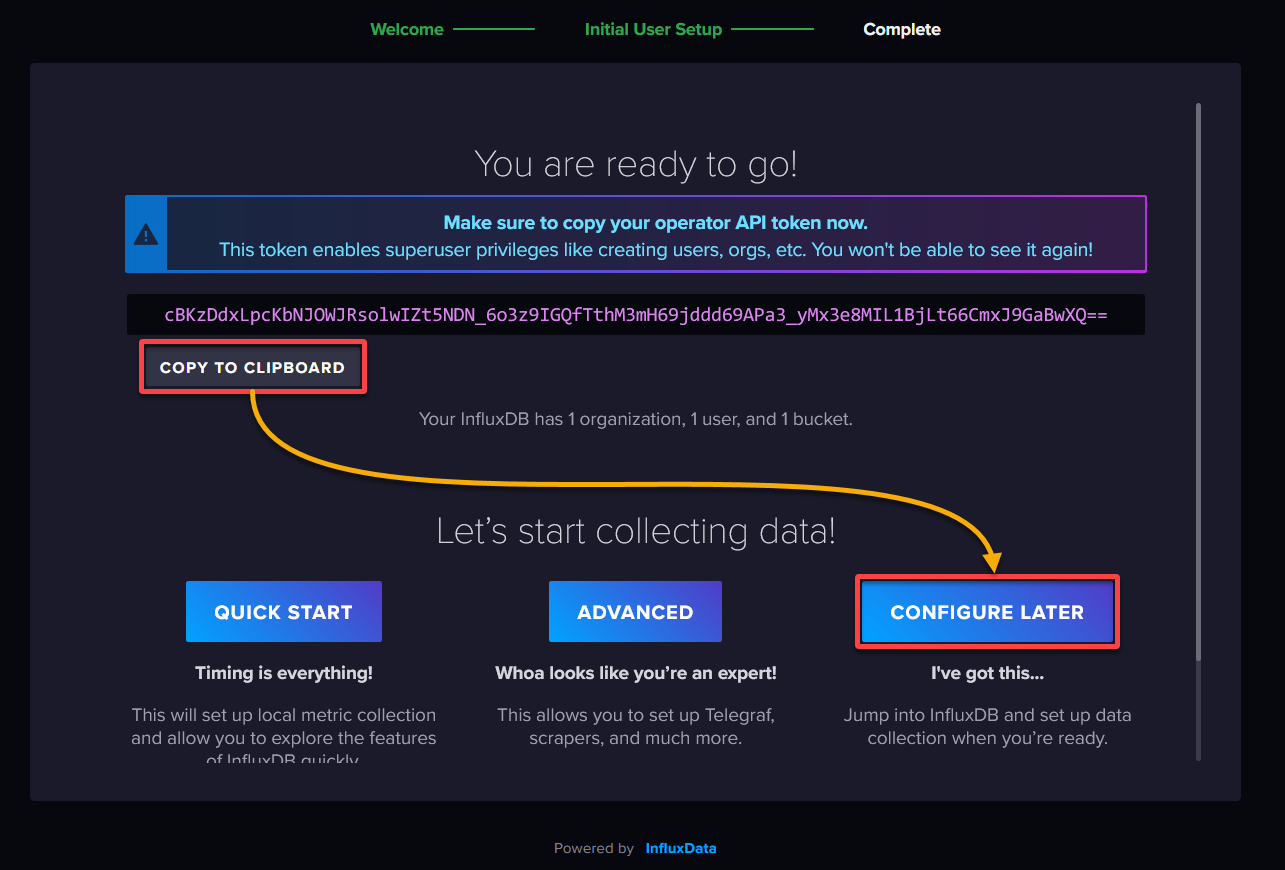
3. Once initialized, click COPY TO CLIPBOARD to copy the generated token (you will need this later), and click CONFIGURE LATER to continue to the InfluxDB dashboard.
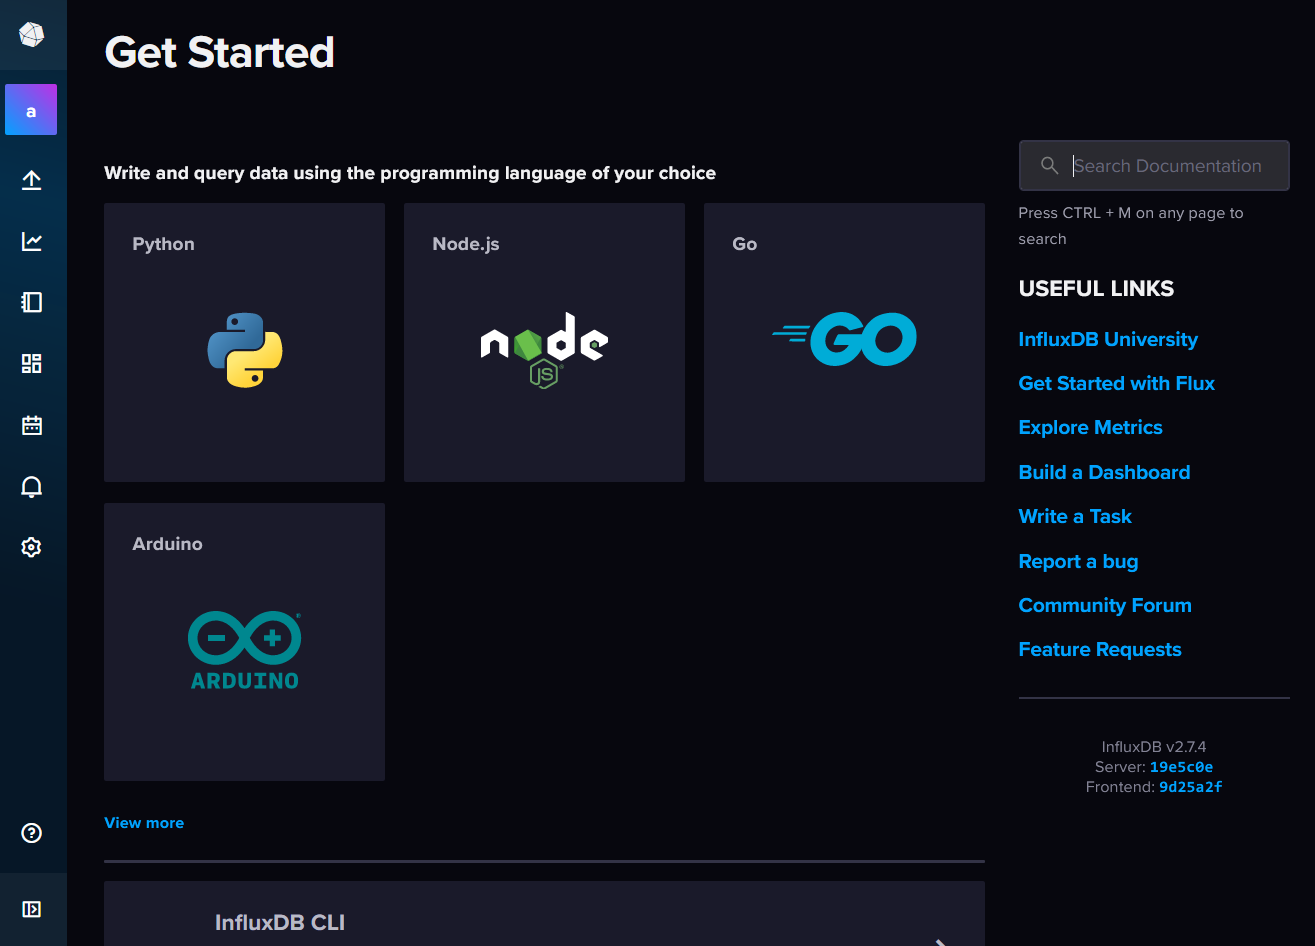
Assuming all goes well, you will see the InfluxDB dashboard below.
Installing the Influx CLI to Interact with the InfluxDB Server
After initializing the InfluxDB web interface, you will need a way to interact with your InfluxDB instance directly from the command line. Install the Influx CLI, which lets you manage your time series database, execute queries, and automate tasks.
To install and configure the Influx CLI, carry out the following:
1. Run the wget command below to download the Influx CLI package to your system.
wget https://dl.influxdata.com/influxdb/releases/influxdb2-client-2.7.3-linux-amd64.tar.gz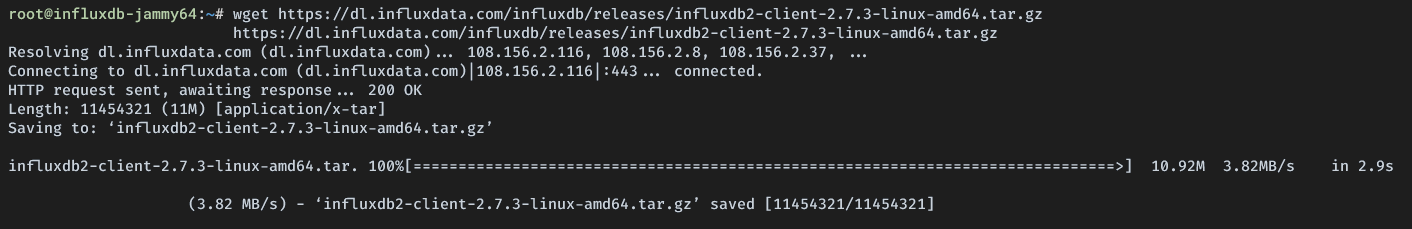
2. Once downloaded, execute the following command to extract the Influx CLI package and copy the influx binary file to the /usr/local/bin directory.
This process makes the influx command available from anywhere in your working directory.
tar xvzf ./influxdb2-client-2.7.3-linux-amd64.tar.gz
sudo cp ./influx /usr/local/bin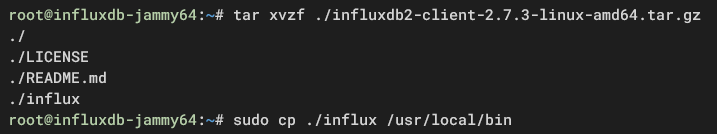
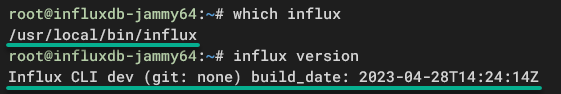
3. After extracting, run each command below to locate (which) the influx binary file and verify the Influx CLI --version.
which influx
influx --version
As you can see below, the Influx CLI dev is installed at /usr/local/bin/influx.
4. Now, run the influx command below to create a new InfluxDB connection configuration (default), which connects to InfluxDB (http://localhost:8086).
Make sure to replace the host, organization, and token with your information accordingly.
influx config create \
--config-name default \
--host-url http://localhost:8086 \
--org ata \
--token cBKzDdxLpcKbNJOWJRsolwIZt5NDN_6o3z9IGQfTthM3mH69jddd69APa3_yMx3e8MIL1BjLt66CmxJ9GaBwXQ== \
--active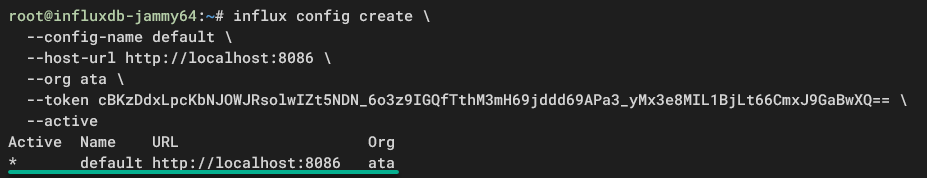
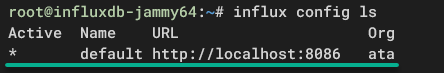
5. Subsequently, run the command below to list active configurations on Influx CLI.
influx config lsNotice the connection configuration (default) below is active and connected to the InfluxDB server (http://:localhost:8086) with organization ata.
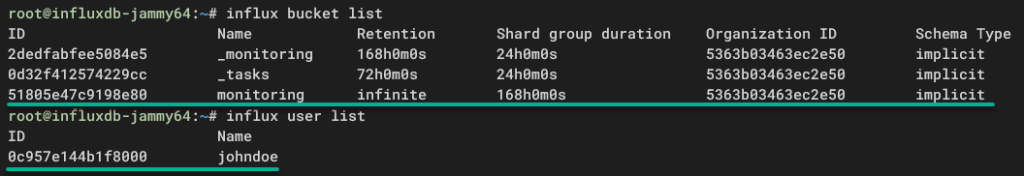
6. Next, execute each influx command below to list all available buckets and users in the InfluxDB.
influx bucket list
influx user list
You can see below the bucket monitoring and user johndoe exist.
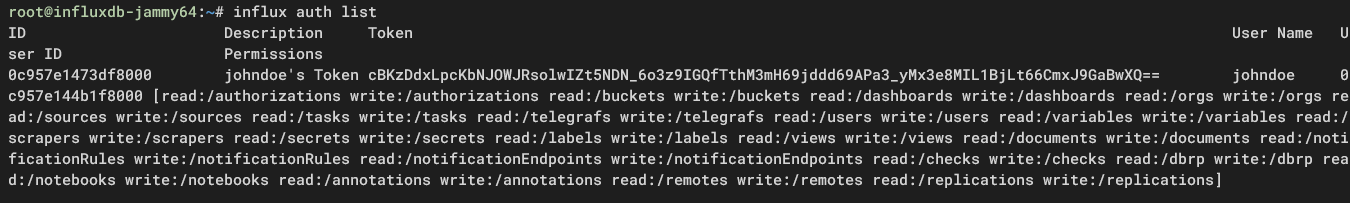
7. Lastly, run the command below to check active users, API key, and user permissions on InfluxDB.
influx auth listBelow, you can see user johndoe with a detailed API key and permissions.
Securing the InfluxDB via HTTPS and Certificates
At this point, your InfluxDB works well but runs on HTTP protocol by default, which is not secure. You must generate SSL/TLS certificates and enable HTTPS to secure your InfluxDB installation.
To secure your InfluxDB installation, complete the following:
1. Execute the following command, which has no output but creates a new directory (mkdir) called /etc/influxdb/ssl for storing SSL/TLS certificates.
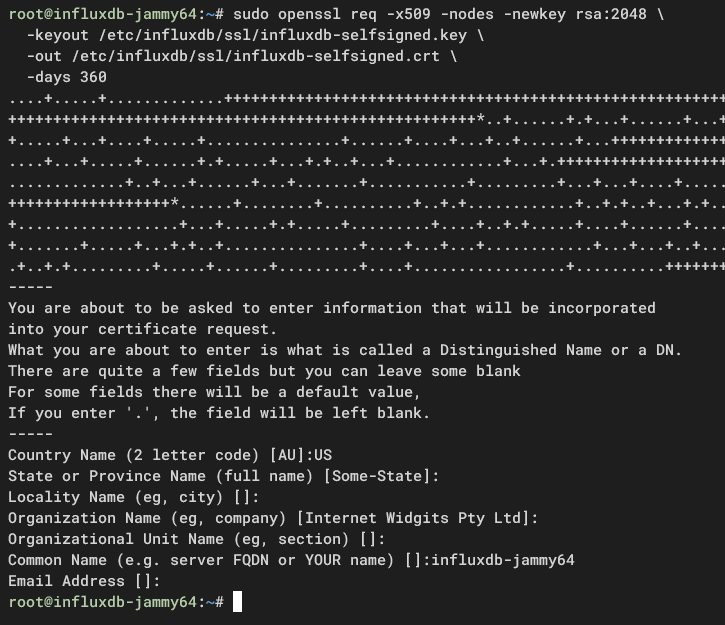
mkdir /etc/influxdb/ssl2. Next, run the openssl command below to generate SSL/TLS certificates for InfluxDB.
sudo openssl req -x509 -nodes -newkey rsa:2048 \
-keyout /etc/influxdb/ssl/influxdb-selfsigned.key \
-out /etc/influxdb/ssl/influxdb-selfsigned.crt \
-days 360Type the details of your SSL/TLS certificates when asked.
3. After generating certificates, run the commands below to change the ownership and permission of the SSL/TLS certificates. These commands have no output to the terminal, but you will later apply these changes.
# changing ownership of /etc/influxdb/ssl to user influxdb
sudo chown -R influxdb:influxdb /etc/influxdb/ssl

# changing permission of public key to 644 and private key to 600
sudo chmod 644 /etc/influxdb/ssl/influxdb-selfsigned.crt
sudo chmod 600 /etc/influxdb/ssl/influxdb-selfsigned.key
4. Now, open the default InfluxDB configuration (/etc/influxdb/config.toml) in your preferred editor, then add the following lines.
This configuration secures InfluxDB via HTTPS connections.
tls-cert = "/etc/influxdb/ssl/influxdb-selfsigned.crt"
tls-key = "/etc/influxdb/ssl/influxdb-selfsigned.key"
5. Save and close the /etc/influxdb/config.toml file, and run the command below to restart the influxdb service. This command produces no output but applies your changes.
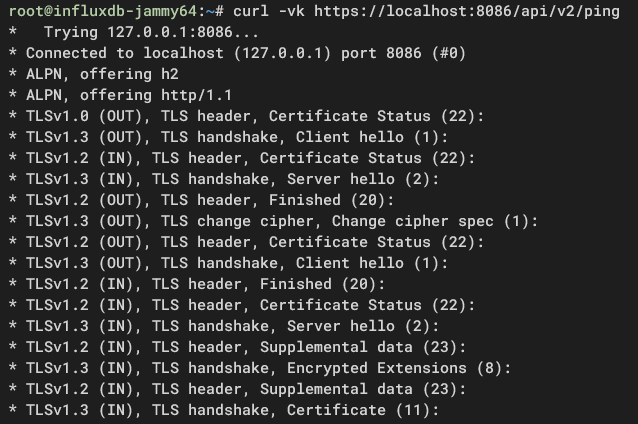
sudo systemctl restart influxdb6. Once influxdb reis started, run either of the curl commands below to verify the InfluxDB server via secure HTTPS connections.
# curl with verbose output
curl -v https://localhost:8086/api/v2/ping

# curl with verbose output and ignore SSL/TLS verification
curl -vk https://localhost:8086/api/v2/ping
If your HTTPS implementation is successful, you will see the TLS handshake similar to the following output.
curl7. Next, run both influx commands below to change the URL for the default profile from HTTP to HTTPS (https://localhost:8086/).
# updating URL to https:// for the profile default
influx config set -n default -u https://localhost:8086/

# checking list bucket and ignore SSL/TLS verification
influx bucket list --skip-verify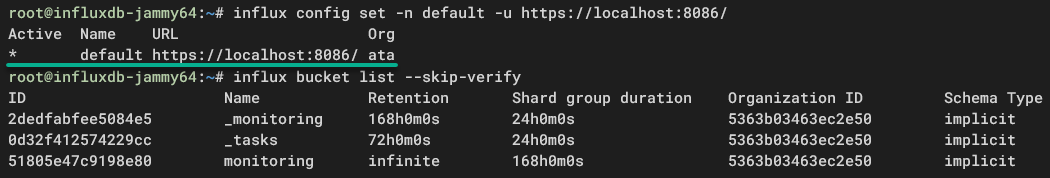
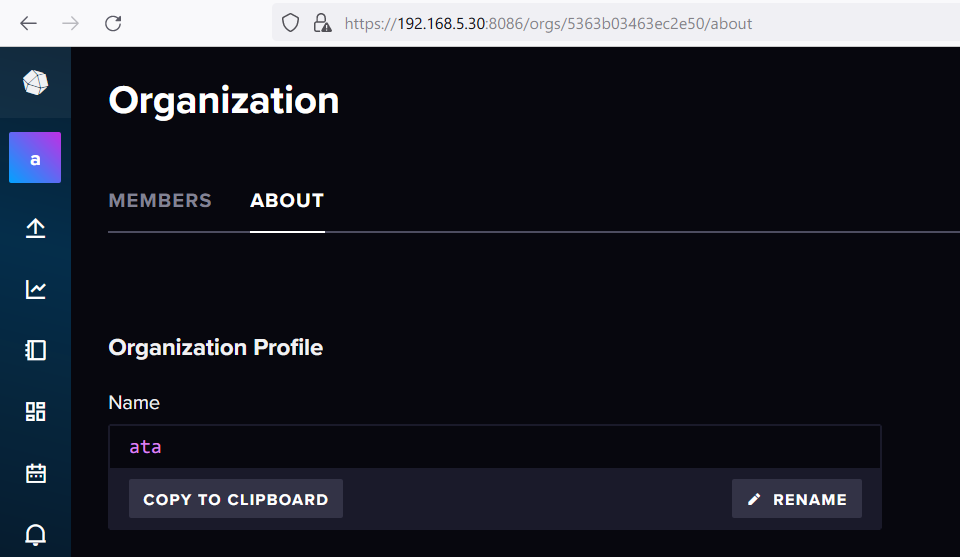
8. Lastly, open your web browser and reload the InfluxDB dashboard.
If the certificates work, your browser redirects to secure HTTPS connections like in the following.
Sending System Metrics via Telegraf
With installed and secured InfluxDB, you are now ready to collect data of valuable insights into the performance and health of your system, applications, and infrastructure. How? By leveraging Telegraf, an agent that collects and sends metrics of your applications to the InfluxDB server.
For this example, you will send basic system metrics, like CPU, disk, kernel, and processes, to the InfluxDB server.
To send system metrics via Telegraf, you first need to install Telegraf as follows:
1. Log in to your target Ubuntu server, and run the following commands to download (wget), verify (echo), and convert (sha256sum) the InfluxDB repository key to .gpg.
Converting the key to .gpg format lets the package manager use it to verify the authenticity and integrity of packages downloaded from the InfluxDB repository
# downloading key
wget -q https://repos.influxdata.com/influxdata-archive_compat.key

# verify and convert key to .gpg file
echo '393e8779c89ac8d958f81f942f9ad7fb82a25e133faddaf92e15b16e6ac9ce4c influxdata-archive_compat.key' | sha256sum -c && cat influxdata-archive_compat.key | gpg --dearmor | sudo tee /etc/apt/trusted.gpg.d/influxdata-archive_compat.gpg > /dev/null
.gpg2. Next, run the command below to add the InfluxDB repository to your system.
echo 'deb [signed-by=/etc/apt/trusted.gpg.d/influxdata-archive_compat.gpg] https://repos.influxdata.com/debian stable main' | sudo tee /etc/apt/sources.list.d/influxdata.list
3. Once added, execute the following command to update and refresh your package index.
sudo apt update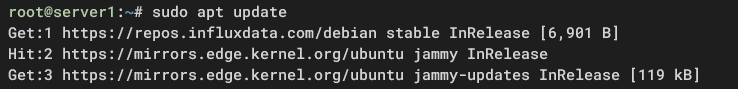
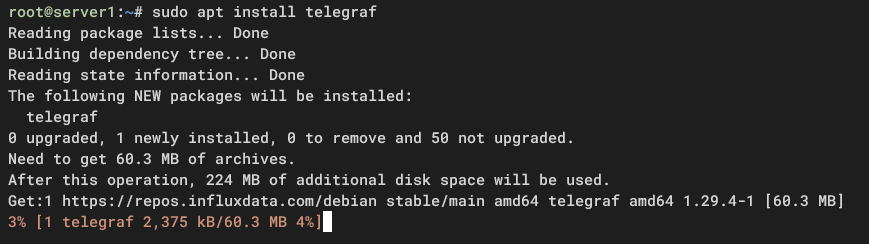
4. Now, run the below command to install Telegraf.
sudo apt install -y telegrafAs shown below, the installation automatically starts.
5. With Telegraf installed, open its default configuration (/etc/telegraf/telegraf.conf) in your preferred editor and modify the following:
- Uncomment the
[[outputs.influxdb_v2]]section to enable output to the InfluxDB server. - Input details of the InfluxDB server IP address, API token, organization/workspace, and the default bucket/database.
- Set the
insecure_skip_verifyvalue totrueif you are using a self-signed certificate.
# Configuration for sending metrics to InfluxDB
[[outputs.influxdb_v2]]
## Define the URL address of your InfluxDB server.
## Could be a domain name or IP address using HTTP or HTTPS protocols.
urls = ["<https://192.168.5.30:8086>"]
## Authentication token for secure communication.
token = "cBKzDdxLpcKbNJOWJRsolwIZt5NDN_6o3z9IGQfTthM3mH69jddd69APa3_yMx3e8MIL1BjLt66CmxJ9GaBwXQ=="
## Specify the organization where data will be written.
organization = "ata"
## Destination bucket to write the collected metrics into.
bucket = "monitoring"
## Use TLS for secure communication but skip chain & host verification
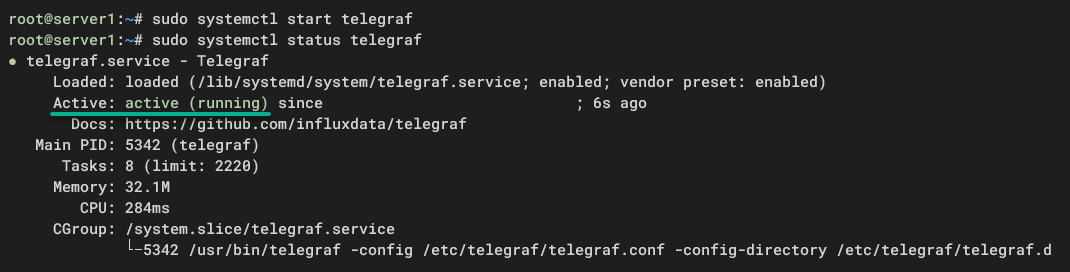
insecure_skip_verify = true6. Lastly, run the following systemctl commands to start and verify the telegraf service status.
sudo systemctl start telegraf
sudo systemctl status telegraf
You can see below the telegraf.service runs, which signifies that Telegraf sent metrics to the InfluxDB server.
Checking the Telegraf Metric from the InfluxDB server
Generated time series data are stored in your InfluxDB server after installing Telegraf, but how do you check them? You need access to your InfluxDB server to query and examine the stored metrics. Doing so lets you gain valuable insights into system performance, resource utilization, and more.
To check the Telegraf metric from your InfluxDB server, execute the following:
1. In your InfluxDB server, run the command below to access the Influx Query Language (InfluxQL) shell. This shell lets you interactively query and manipulate time series data stored in your InfluxDB database.
influx v1 shell --skip-verify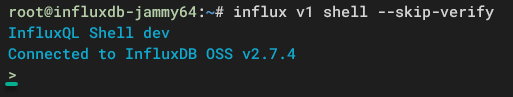
2. On the InfluxQL shell, run the following command, which does not produce output but switches to the bucket or database called monitoring.
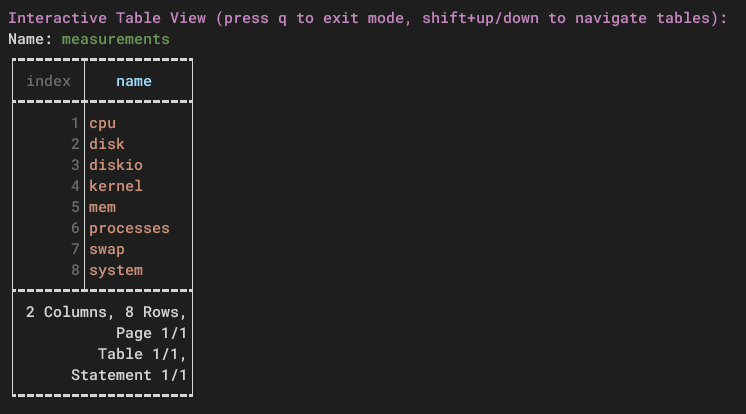
USE "monitoring"3. After switching, execute the query below to show measurements on the current monitoring bucket. This measurement is part of the InfluxDB data structure, like a table in the SQL world.
SHOW MEASUREMENTSBelow are the system metrics Telegraf generated, including cpu, disk, kernel, and processes.
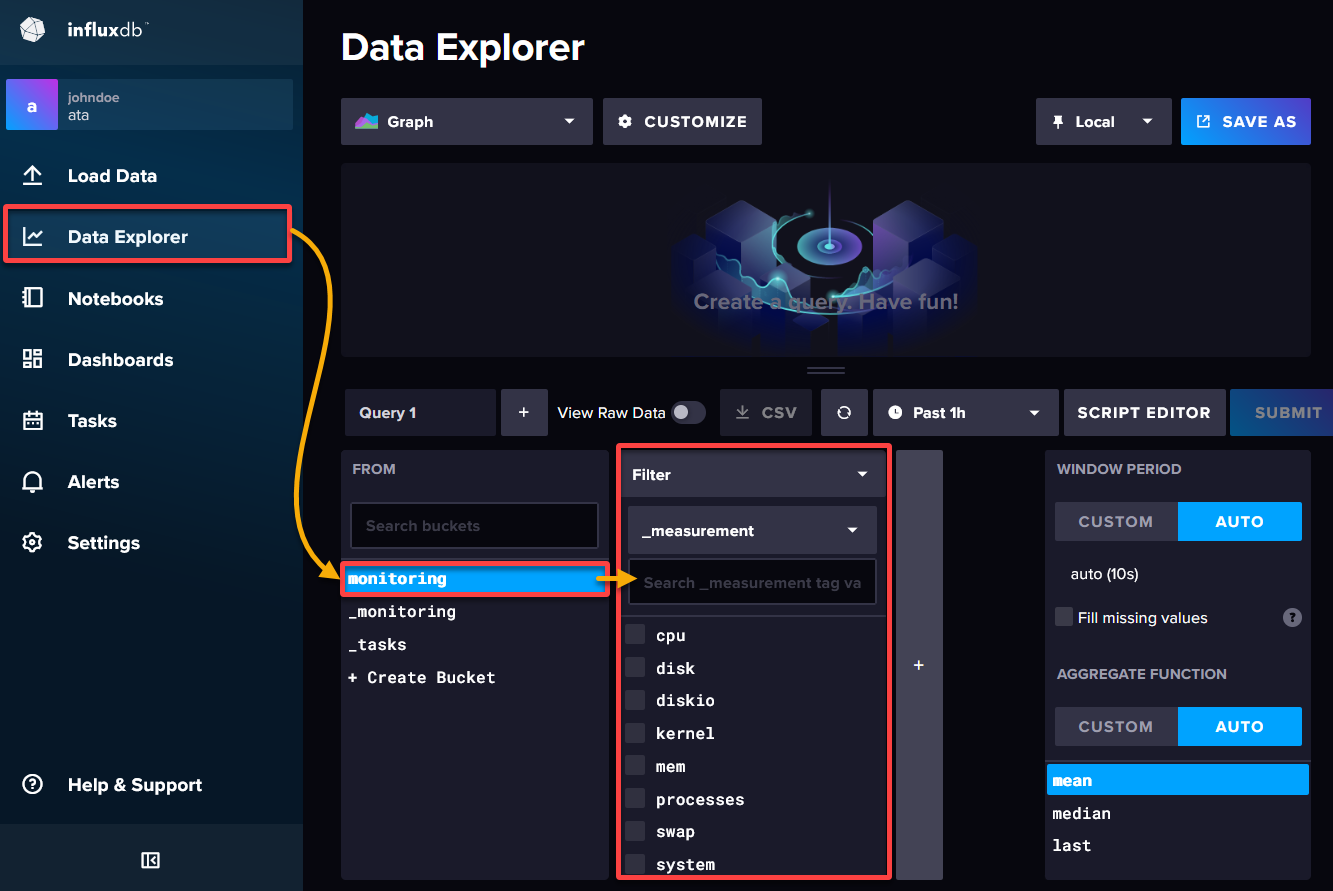
4. Now, access the InfluxDB dashboard, navigate to Data Explorer (left pane), and select the monitoring bucket.
If all goes well, you will see the exact measurements or tables as in the following.
Building Dashboards for Efficient Data Monitoring
Your time series data is now available on the InfluxDB server to regularly monitor on the Data Explorer page by clicking options. But despite sounding like a journey into real-time insights, would there be a smoother way to slice and dice your time series data?
InfluxDB lets you build dashboards to visualize and analyze your time series data quickly and clearly.
To build dashboards on InfluxDB, proceed with these steps:
1. Open your web browser and visit the community templates repository for InfluxDB.
2. Next, find a template for your application and copy the link to the YML template file.
For example, below is the link to the dashboard template for monitoring the Linux system.
https://raw.githubusercontent.com/influxdata/community-templates/master/linux_system/linux_system.yml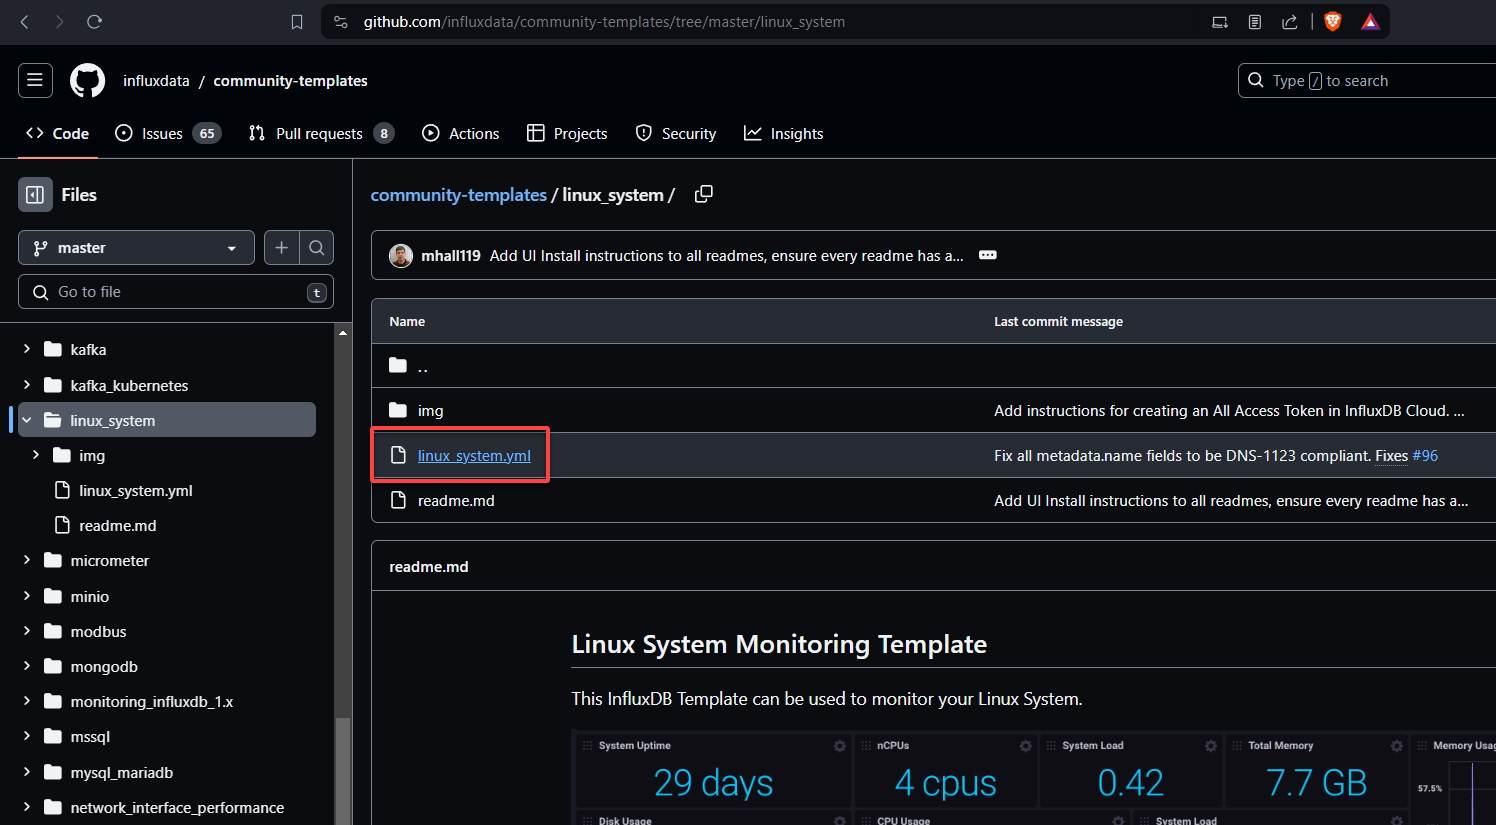
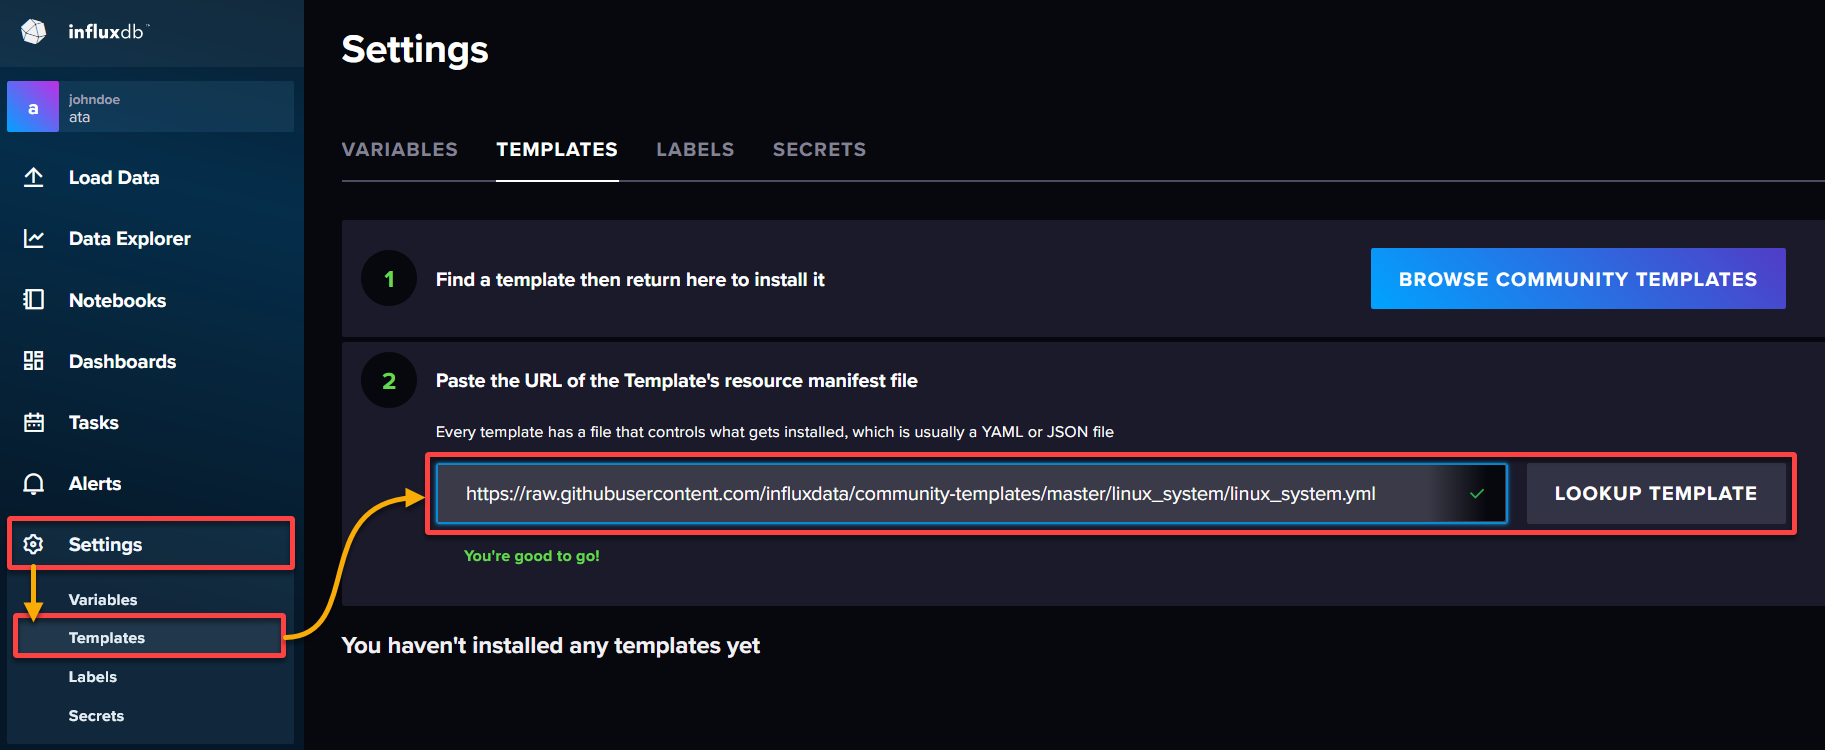
3. On your InfluxDB dashboard, navigate to Settings (left pane) → Templates, paste the link of your chosen template in the empty field, and click LOOKUP TEMPLATE to confirm.
This step tells InfluxDB to fetch the template’s configuration details, such as visualizations, queries, and settings, and make them available within your dashboard.
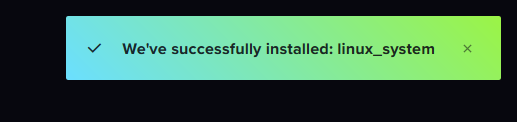
4. Now, click INSTALL TEMPLATE when prompted to confirm the installation of a new dashboard Linux System on your InfluxDB server.
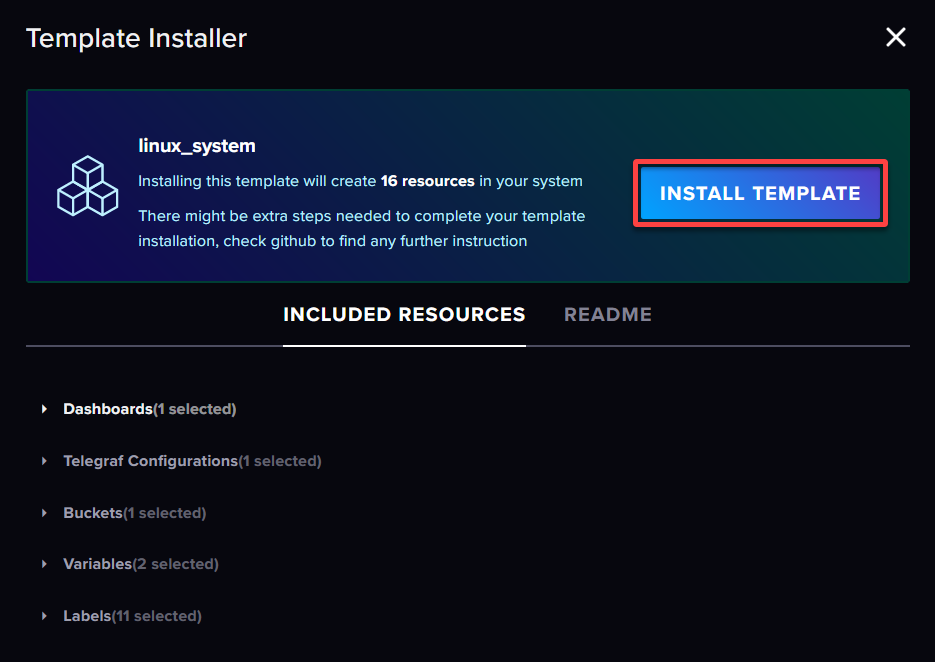
You will see the confirmation below once the dashboard template is created.
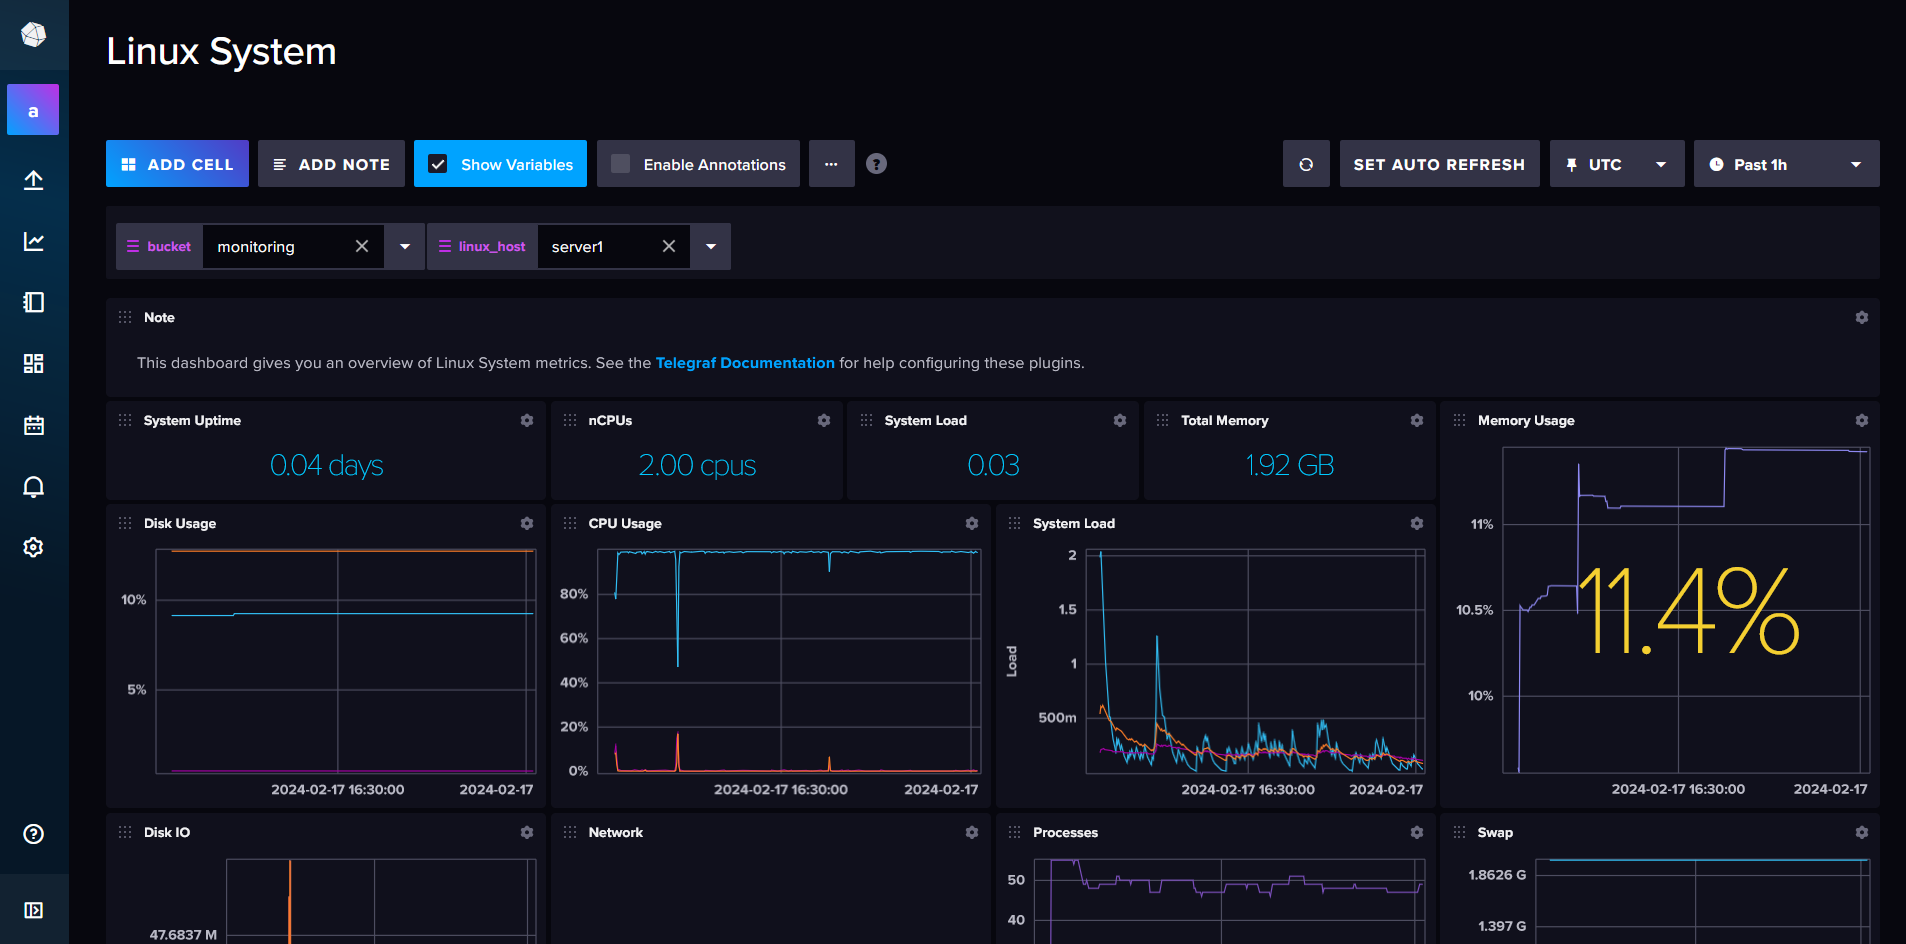
5. Finally, navigate to Dashboards (left pane) and select the Linux System dashboard.
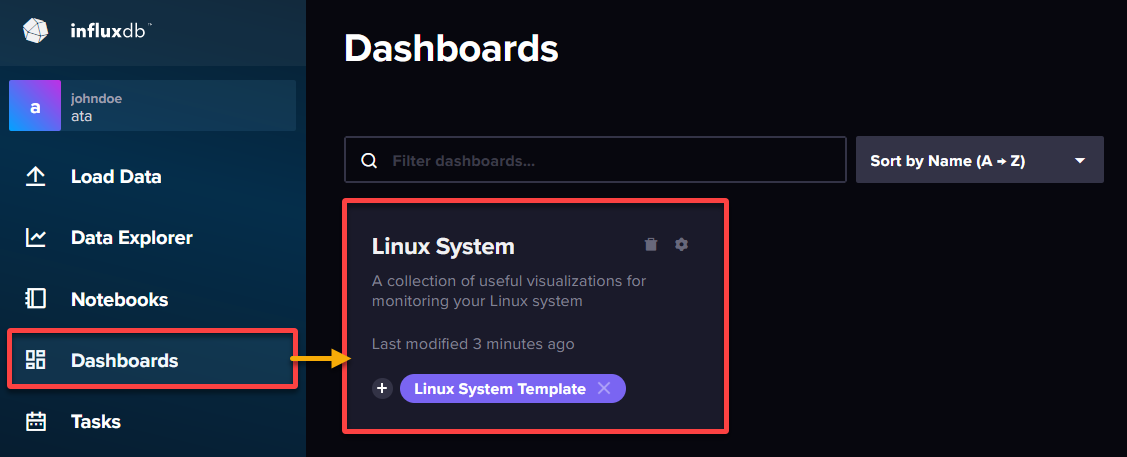
If your installation is successful, you will see the dashboard monitoring of server1, as shown below. This dashboard displays crucial information without digging manually.
Conclusion
Well done! You installed InfluxDB on Ubuntu, secured InfluxDB with SSL/TLS certificates, and configured the Influx CLI to manage the InfluxDB server. With Telegraf integrated into your dashboard, you can quickly gather and send metrics to the InfluxDB server for data monitoring.
With empowered real-time insights into your data, consider exploring advanced features and integrations. Why not install Telegraf plugins to leverage your data scraping and application monitoring?
Remember, the world of time series data is vast and ever-evolving. Keep exploring, experimenting, and discovering new ways to leverage the power of time series data. Drive insights and innovation in your projects with curiosity and determination!


