


Feeling overwhelmed by an ocean of data and wishing for a superhero to make sense of it all? Well, meet your data savior – the ELK Stack on Windows. Whether you’re a seasoned developer or just a curious explorer, you can transform raw data into insights at your fingertips.
Upon completing this tutorial, your machine will host a fully operational ELK stack, primed to manage and analyze data effectively.
Bid farewell to data chaos; it’s time to embrace the order that ELK stack has to offer!
Prerequisites
This tutorial will be a hands-on demonstration. If you’d like to follow along, be sure you have the following:
- A Windows machine – This tutorial uses Windows 10 for demonstrations.
- Java JDK (Optional, as the ELK stack on Windows comes with a bundled JDK).
Downloading and Installing Elasticsearch for Your ELK Stack on Windows
Coming off the prerequisites, delve into the crucial phase of laying the foundation for seamless log management — installing Elasticsearch. Imagine Elasticsearch as the architect’s blueprint for your ELK Stack on Windows.
The Elasticsearch engine empowers your ELK Stack to effortlessly crunch and visualize data like a pro.
To download and install Elasticsearch, follow these steps:
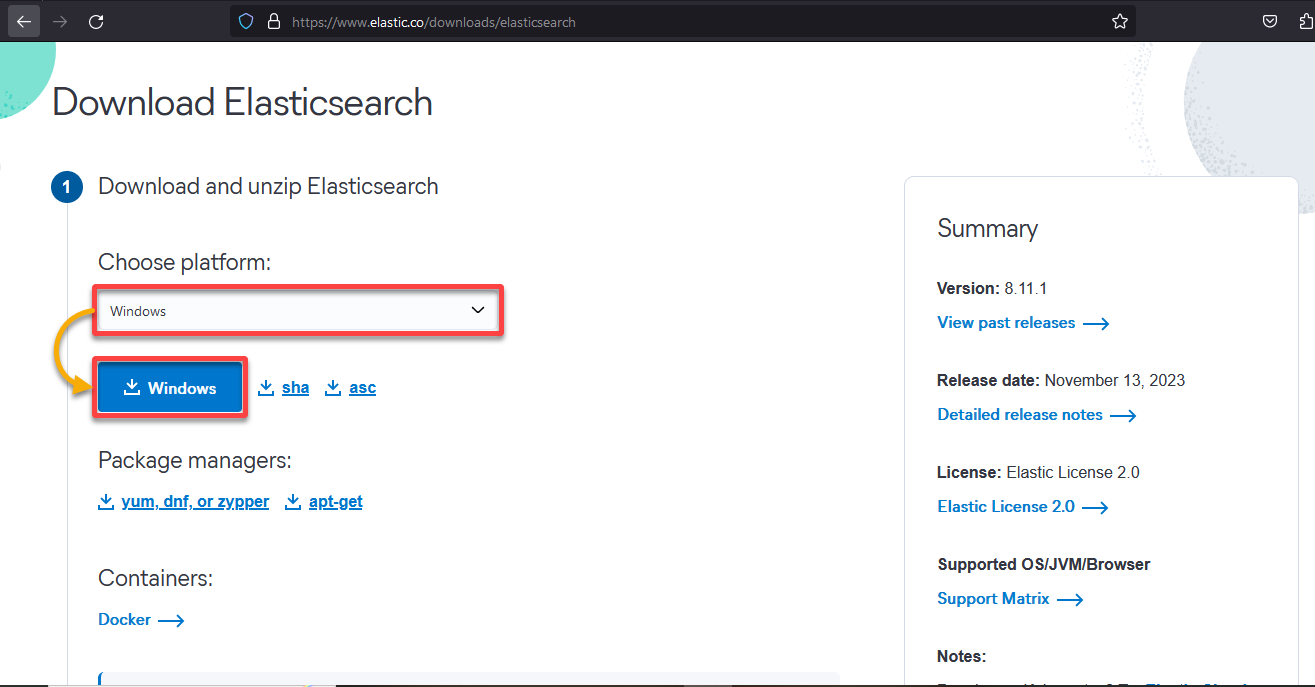
1. Open your preferred web browser and visit the official Elasticsearch download page.
2. Next, select Windows from the dropdown list as your platform and click the Windows button to download the Elasticsearch ZIP package.
3. Once downloaded, extract the Elasticsearch ZIP file to your preferred location.
4. Next, open the command prompt as administrator, navigate to the Elasticsearch bin directory, and run the elasticsearch.bat file to start Elasticsearch.
elasticsearch.bat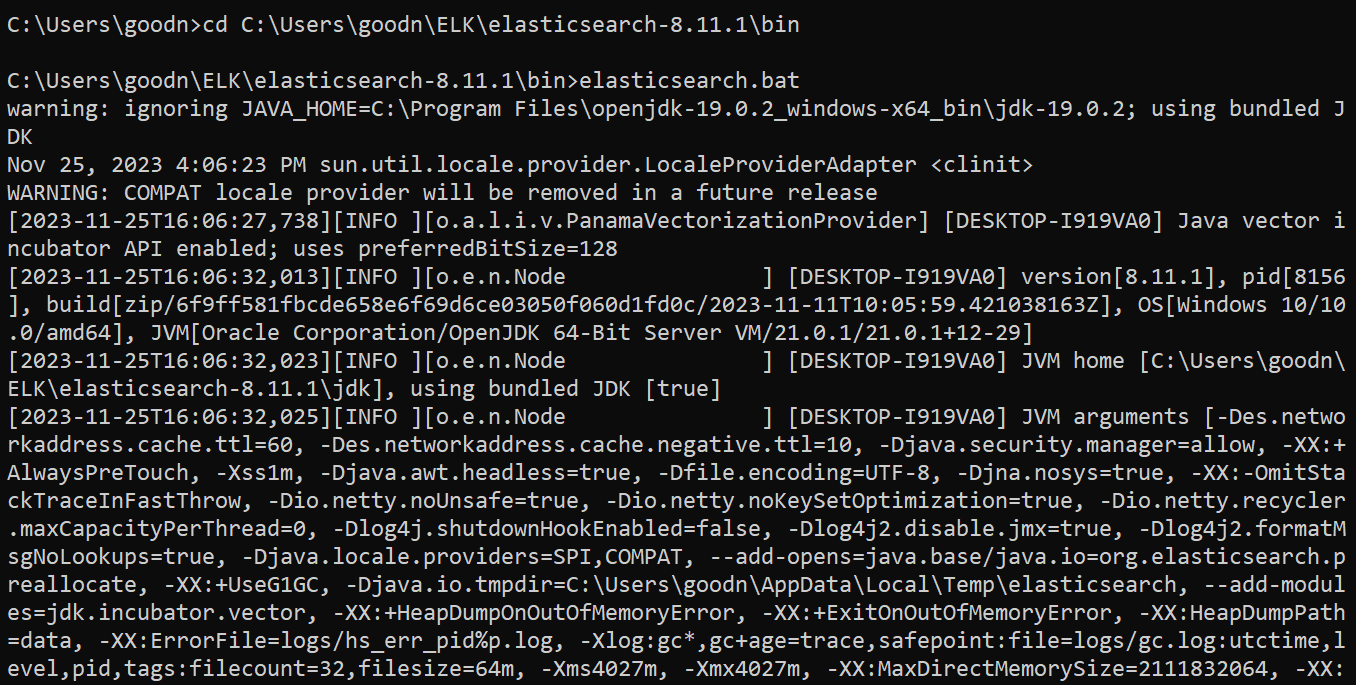
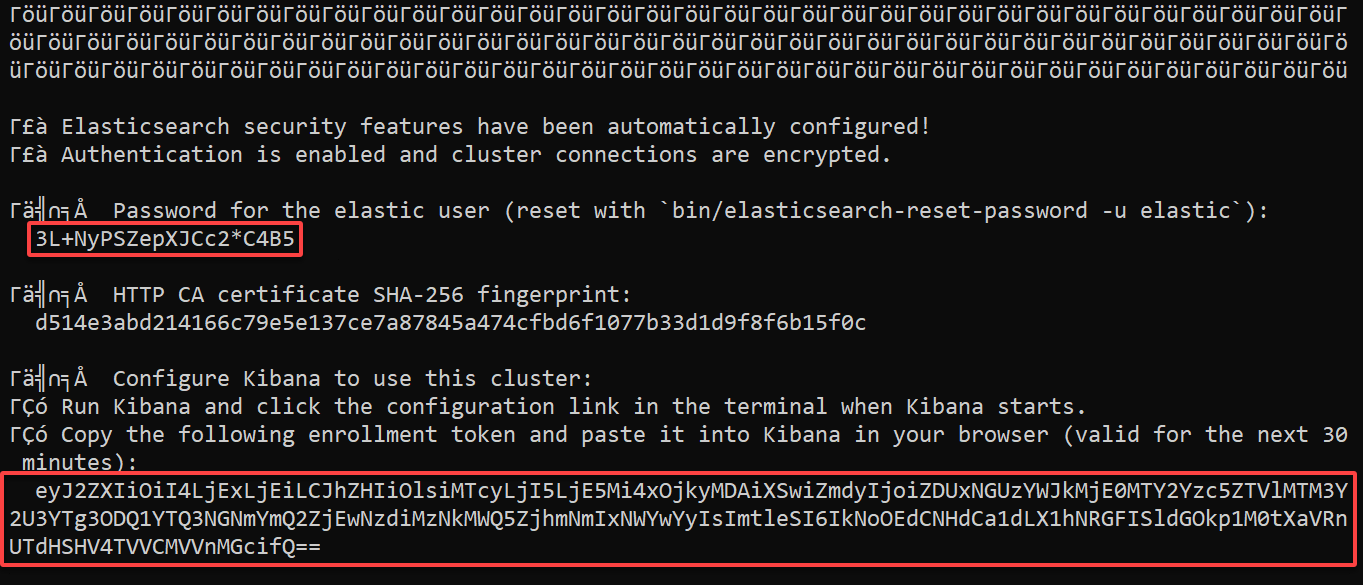
5. Look for the following, as shown below, somewhere in the middle of the output, and save them for later use.
Below, one is a generated password and another is an enrollment token (valid for 30 minutes) for the Elastic user for Kibana.
💡 Note that the password and token are generated only on the initial run of Elasticsearch and will not be displayed for subsequent runs. If you lose either before you have a chance to use it, follow the Elasticsearch documentation for password reset or creating enrollment tokens.
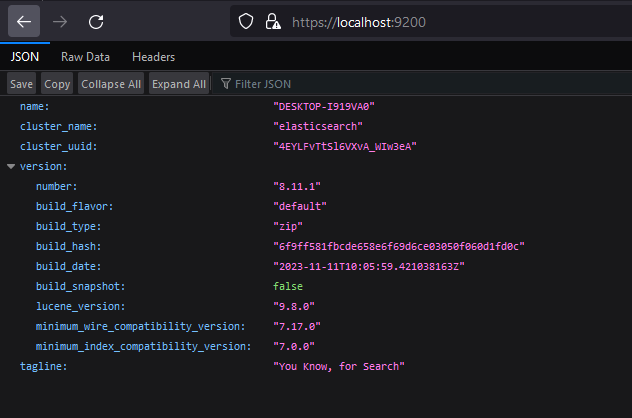
6. Now, open a new browser tab and navigate to https://localhost:9200 to confirm your Elasticsearch is running, where you’ll be prompted to sign in (step seven).
7. Input elastic as the username, the unique password you noted in step five, and click Sign in.
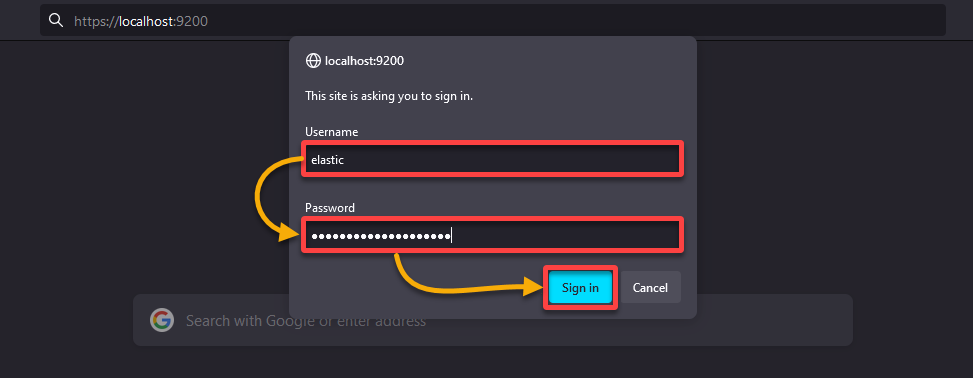
If successful, you’ll see the Elasticsearch cluster information in a JSON response, as shown below.
Setting up Logstash: A Powerhouse for Data Orchestration
As you ride the ELK Stack wave, having Elasticsearch in play, the spotlight now turns to orchestrating the smooth flow of information in your ELK Stack — Logstash. Logstash transforms your system into a data-processing powerhouse.
To download and install Logstash, carry out the following:
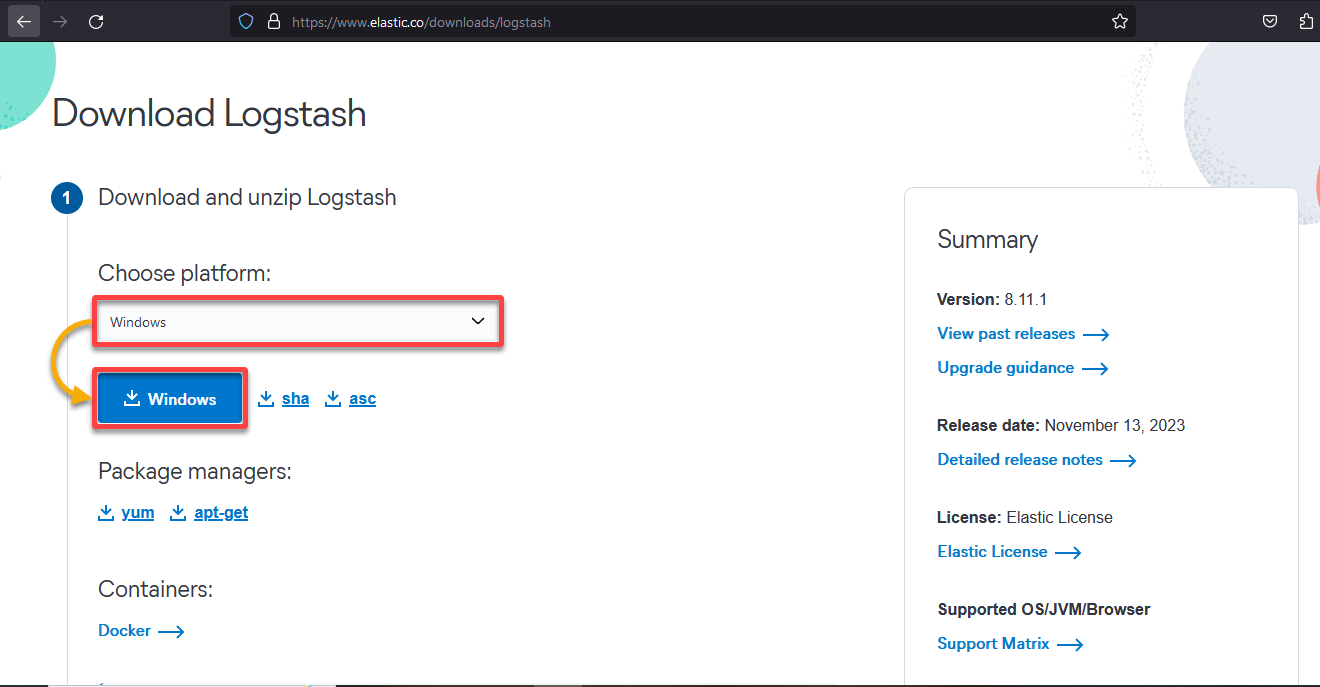
1. Visit the official Logstash download page, select Windows as your platform in the dropdown field, and click Windows to download the Logstash ZIP package.
2. Next, extract the downloaded ZIP file to your preferred location.
3. Once extracted, create a configuration file for Logstash called logstash.conf in your Logstash config directory or any preferred location.
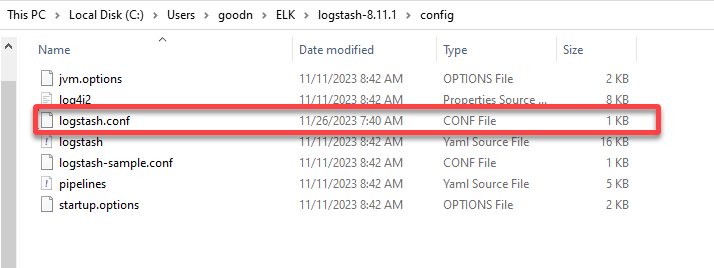
4. Now, add the following configuration to your logstash.conf file, save the changes, and close the file.
This configuration defines the input and output settings (you can also define filter settings) based on your data processing needs — ingesting sample data.
# Input configuration: Reads input from the standard input (stdin)
input {
  stdin {}
}

# Output configuration: Sends data to Elasticsearch
output {
  elasticsearch {
    # Elasticsearch server address
    hosts => ["<https://localhost:9200>"]

    # Index name with dynamic date format
    index => "demo-log-%{+YYYY.MM.dd}"

    # Elasticsearch user credentials
    user => "elastic"
    password => "your_elastic_password"

    # Disabling SSL certificate verification (for demo purposes)
    ssl_certificate_verification => false
  }

  # Output to stdout for debugging (Ruby debug format)
  stdout {
    codec => rubydebug
  }
}
5. Next, execute the following commands to navigate to the Logstash bin directory and start Logstash. Ensure you replace the following:
logstash-bin– The path to the Logstashbindirectory (i.e., \logstash-8.11.1\bin).config-file– The path of your Logstash configuration file.
cd logstash-bin
logstash.bat -f config-file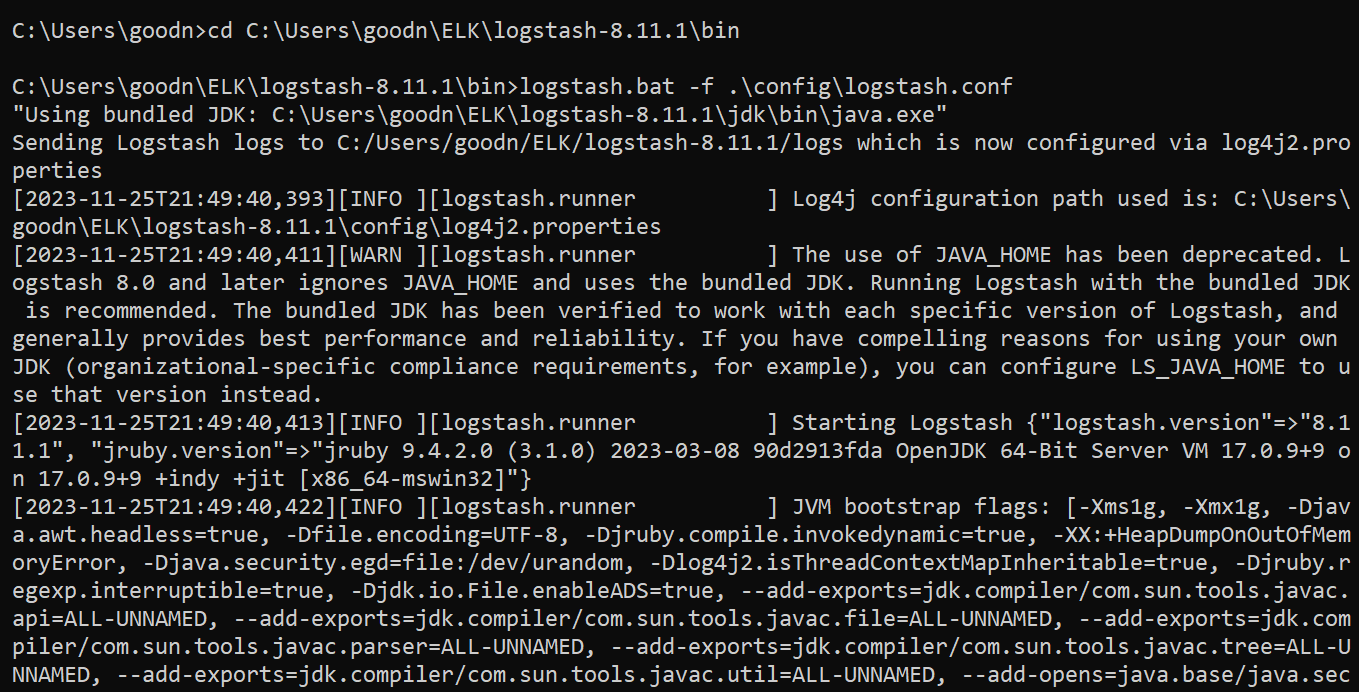
6. When prompted, copy and paste the entire sample data below (or any other you’d like to use) to the command prompt.
2023-11-21 10:00:00 INFO - User 'john.doe' logged out
2023-11-21 10:15:00 ERROR - Connection failed: Server not responding
2023-11-21 10:30:00 INFO - Request received from IP: 192.168.1.1
2023-11-21 10:45:00 WARNING - Disk space low on /dev/sda
2023-11-21 11:00:00 ERROR - Database connection timeout
2023-11-21 11:15:00 INFO - File uploaded successfully: file.pdf
2023-11-20 11:30:00 DEBUG - Processing background task
2023-11-20 12:45:00 WARNING - High CPU usage detected
2023-11-20 13:00:00 ERROR - Application crash detected
2023-11-20 15:15:00 INFO - User 'jane.doe' accessed dashboard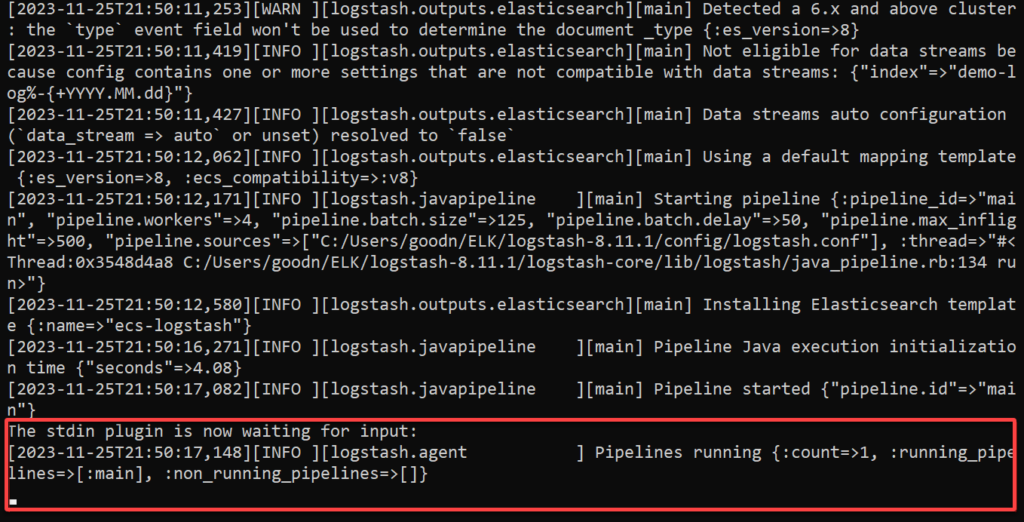
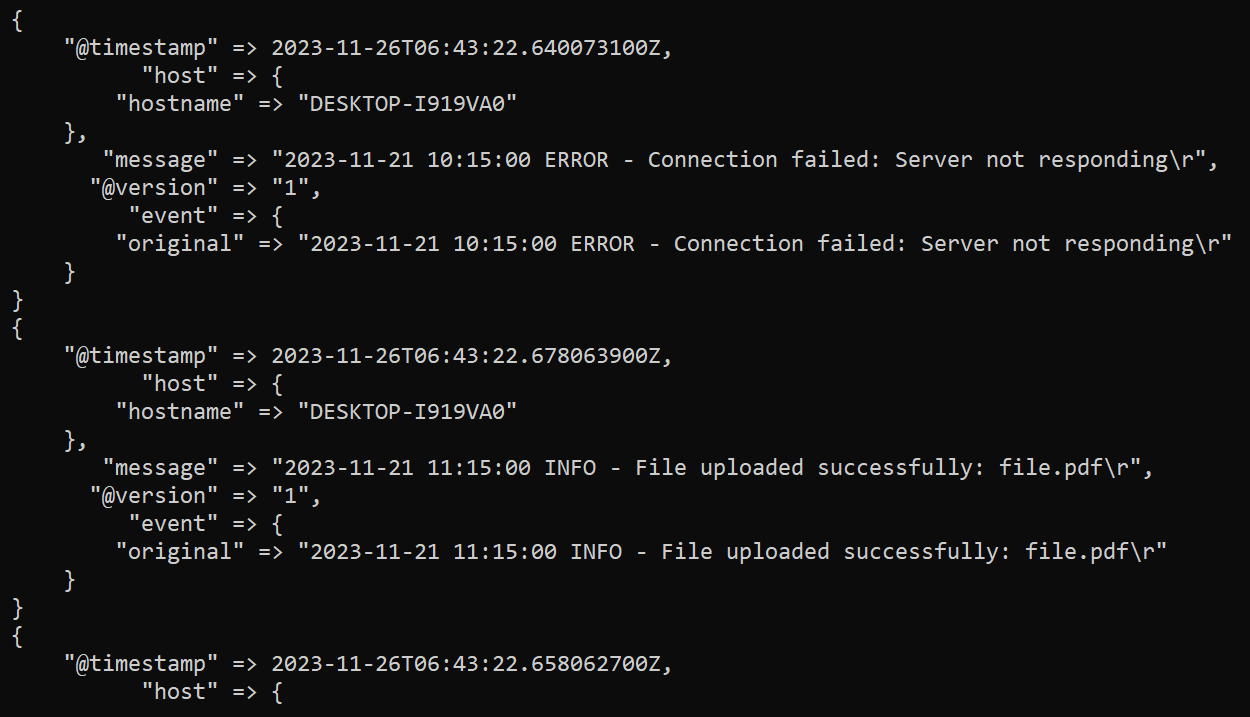
Once the data has been processed by Logstash, you’ll see output in JSON Lines (JSONL) format, like in the image below.
JSONL is a format where each line of the file is a JSON object, allowing for quick parsing and readability. Logstash commonly uses JSONL as an intermediate format for transporting and storing log events.
Installing Kibana for Dynamic Dashboards
With Elasticsearch running, you’ll need a dynamic dashboard powerhouse — Kibana. Picture Kibana as the storyteller, turning raw data into compelling narratives. Kibana lets you uncover insights and patterns in your data effortlessly.
To install Kibana on Windows, complete the steps below:
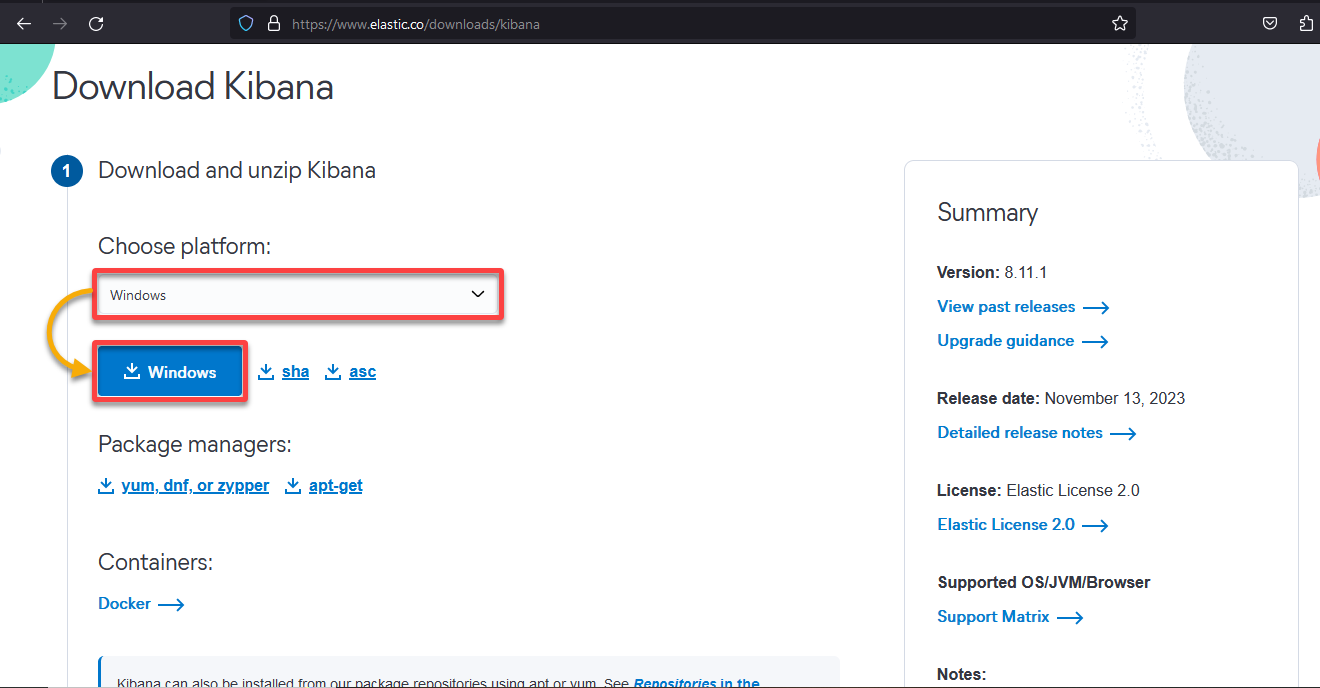
1. Navigate to the official Kibana download page in your web browser.
2. Next, choose the Windows version and click the Windows button to download the Kibana ZIP package.
3. After downloading, extract the ZIP file to your preferred location.
4. Now, open a new command prompt, and execute these commands to change the directory to the Kibana bin folder, and start the Kibana service (kibana.bat).
Ensure you replace kibana-bin with the exact path to the bin folder within the Kibana ZIP package you extracted (i.e., \kibana-8.11.1\bin).
cd kibana-bin
kibana.bat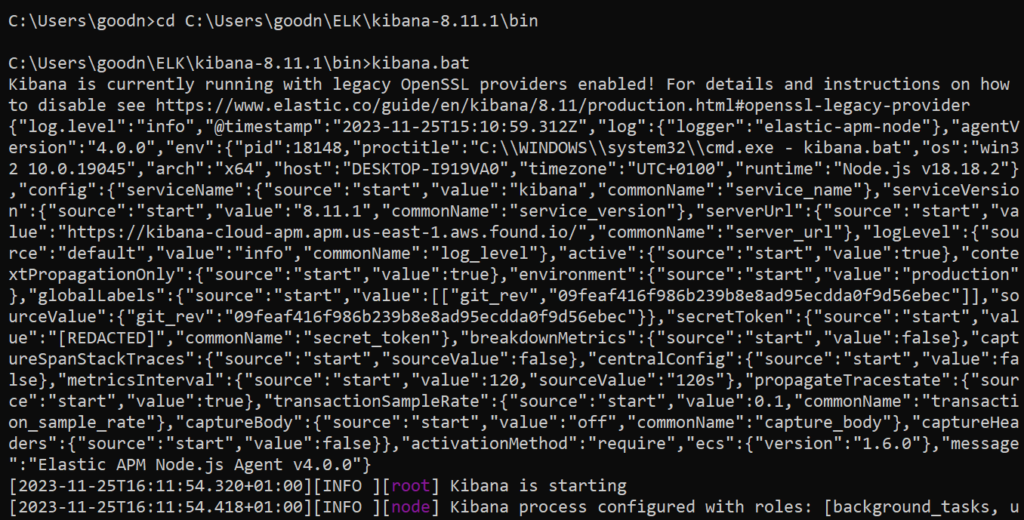
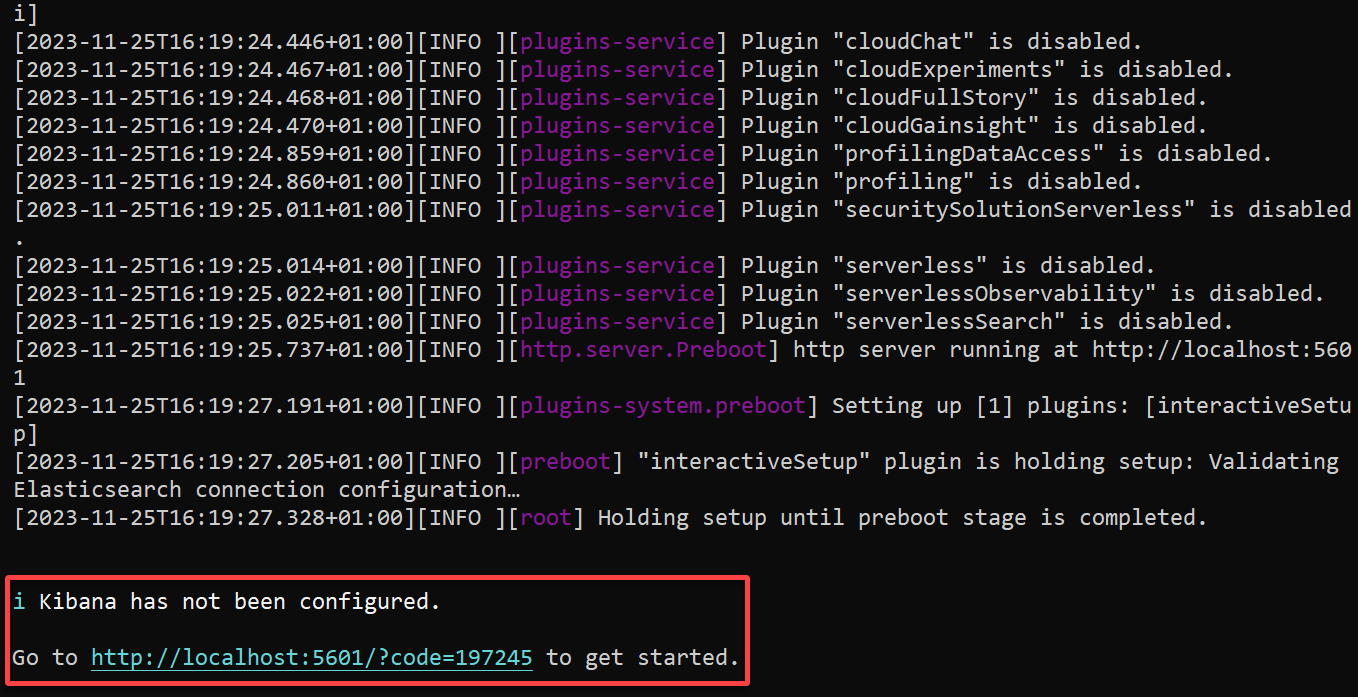
5. Once Kibana has started, copy the link below the message saying Kibana has not been configured.
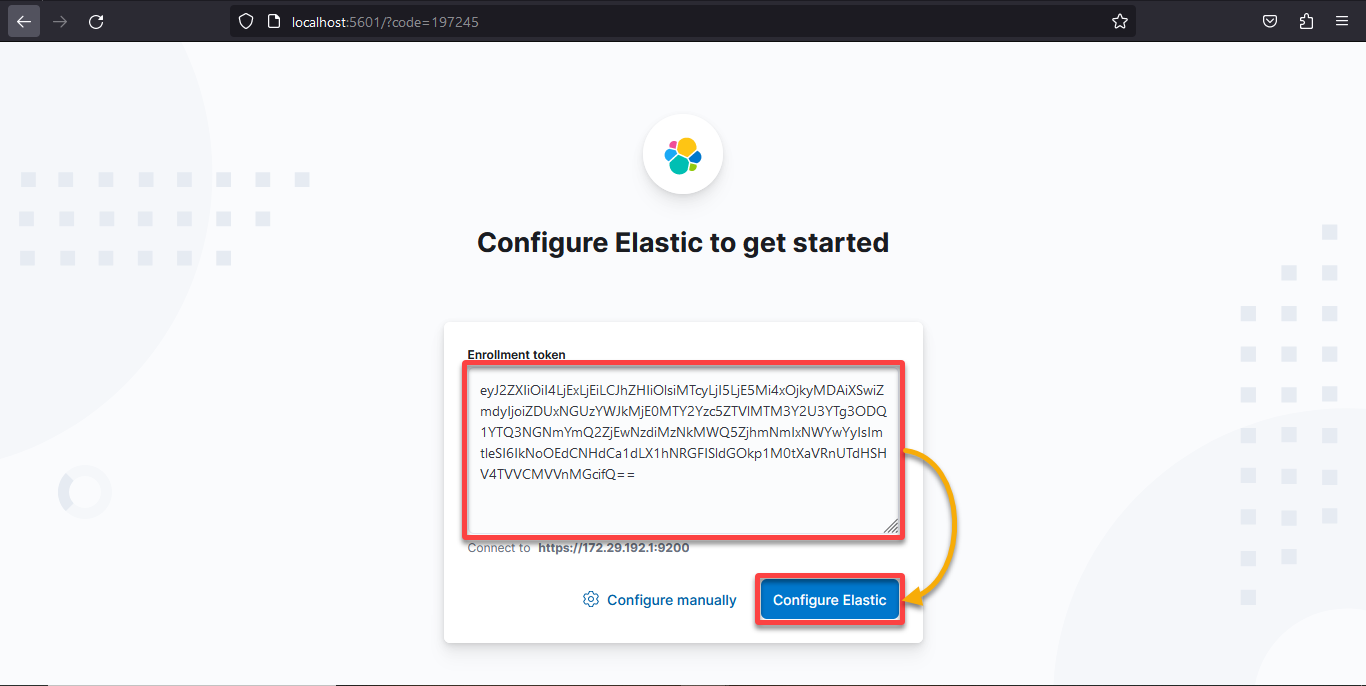
6. Visit the link you noted in step five, then enter the enrollment token you noted in step five of the “Downloading and Installing Elasticsearch” section, and click Configure Elastic. Doing so establishes a connection between Kibana and Elasticsearch, enabling seamless communication.
This step is pivotal for integrating these components, allowing Kibana to leverage the power of Elasticsearch for dynamic dashboard creation and insightful data visualization.
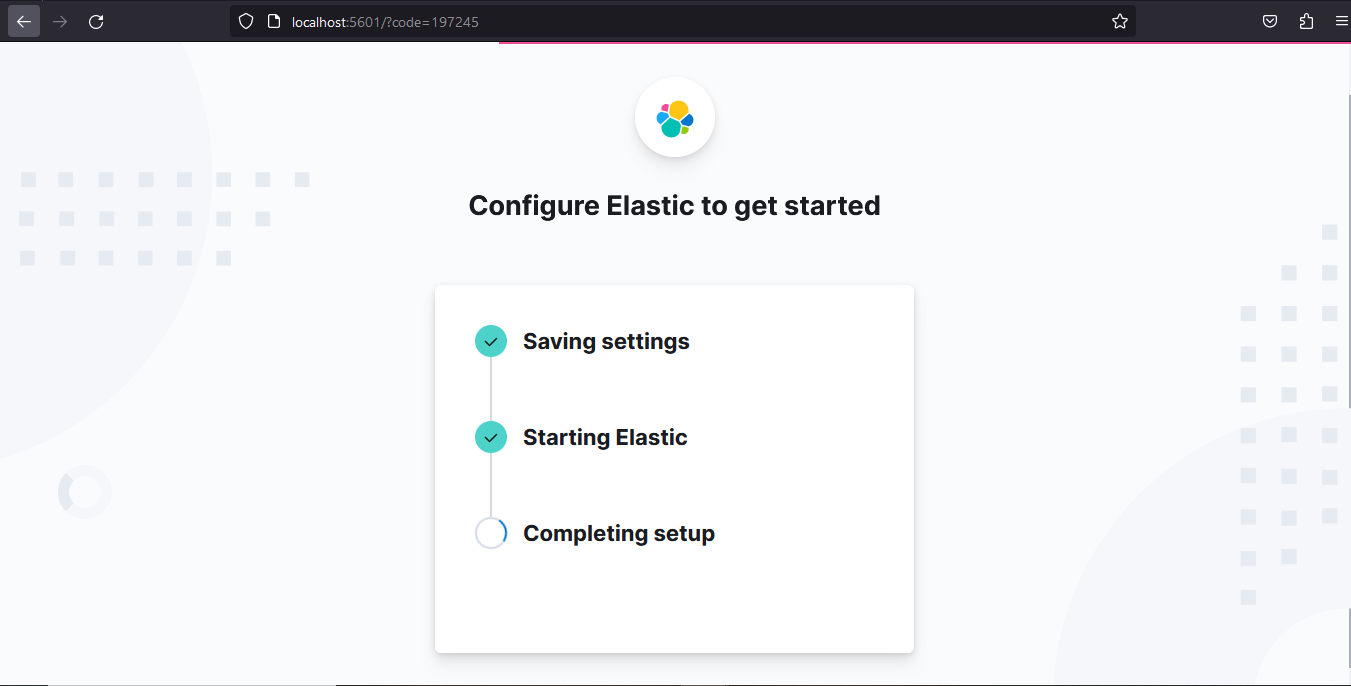
If the token is correct and still valid, you’ll see an indication that Kibana is being set up, like in the screenshot below. Once the setup completes, your browser redirects to the Elastic login page (step seven)
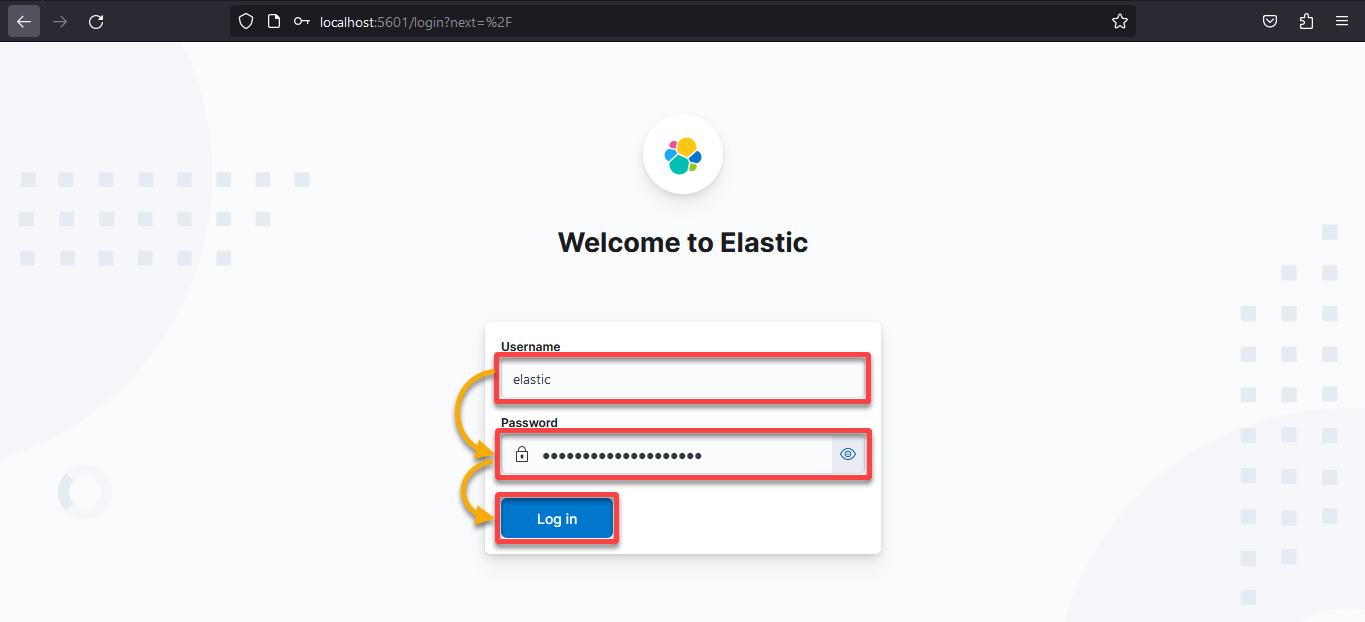
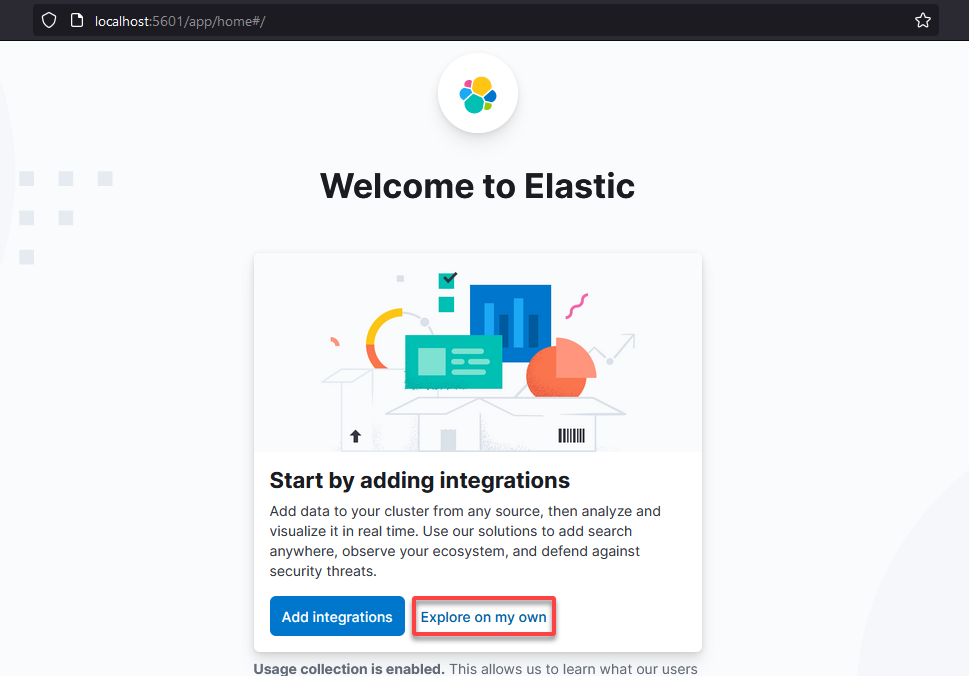
7. Input elastic as the username, then your unique Elastic password, and click Log in.
8. Once logged in, click Explore on my own to access the Kibana web interface.
Visualizing Data in Kibana
Now that you’ve successfully brought the ELK Stack on Windows playground to life, it’s time to harness Kibana’s visual prowess. You’ll create a dynamic dashboard that unveils insights and patterns within your data.
To visualize data in Kibana, proceed with the following:
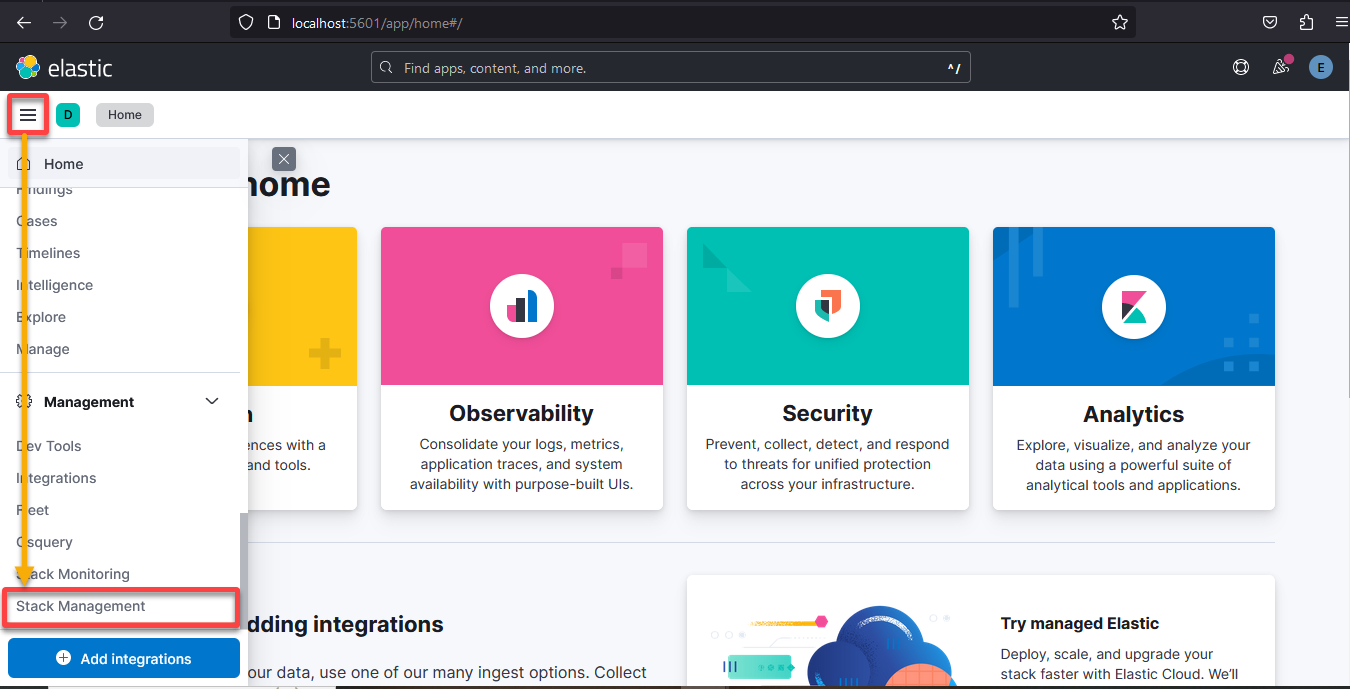
1. On the Kibana home page, click the menu icon (top-left), and choose Stack Management under the Management section (side menu).
Your browser redirects to the Stack Management page, where you gain centralized control over various aspects of your Elastic stack deployment (step two).
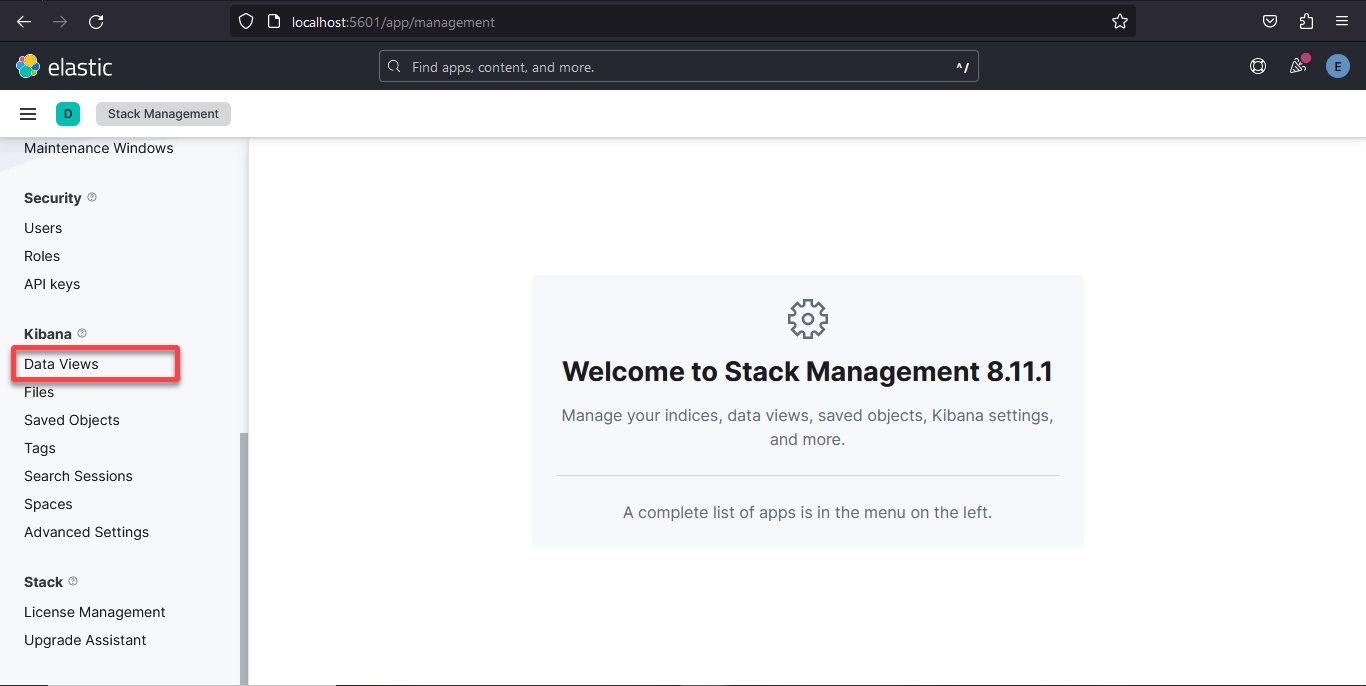
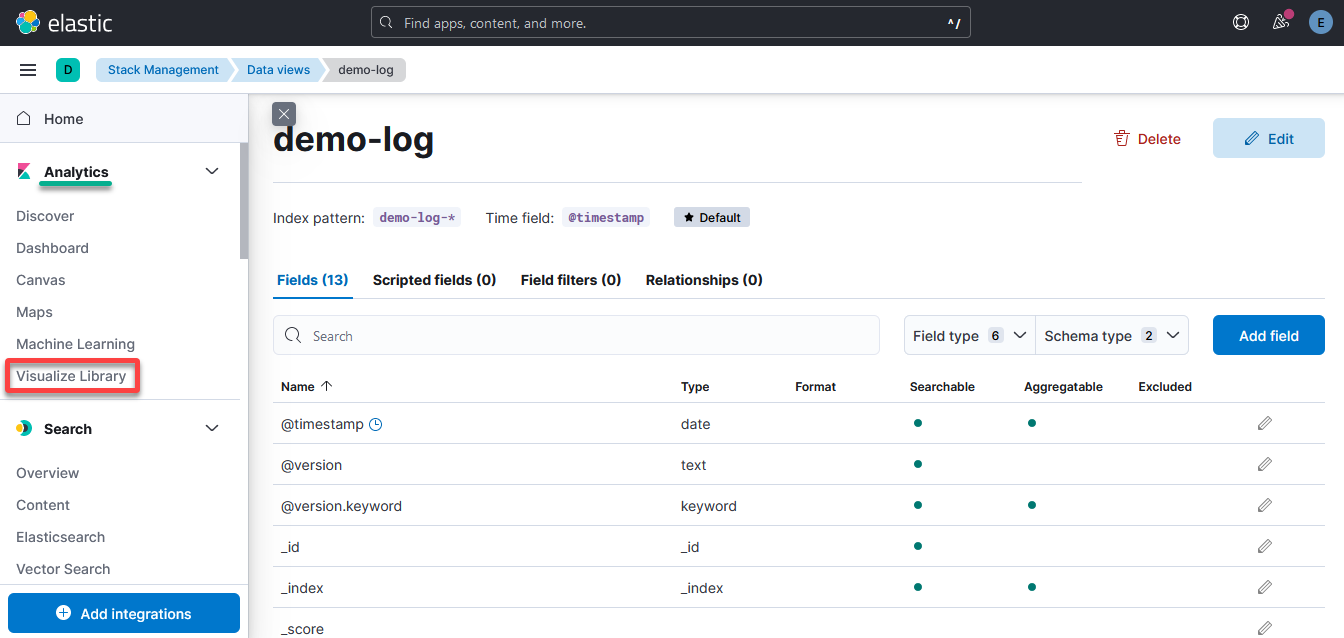
2. Next, click Data Views under the Kibana section to access the Data Views page (step three).
The Data Views page allows you to define how your data is structured, set up custom configurations, and optimize the way Kibana visualizes and analyzes your data.
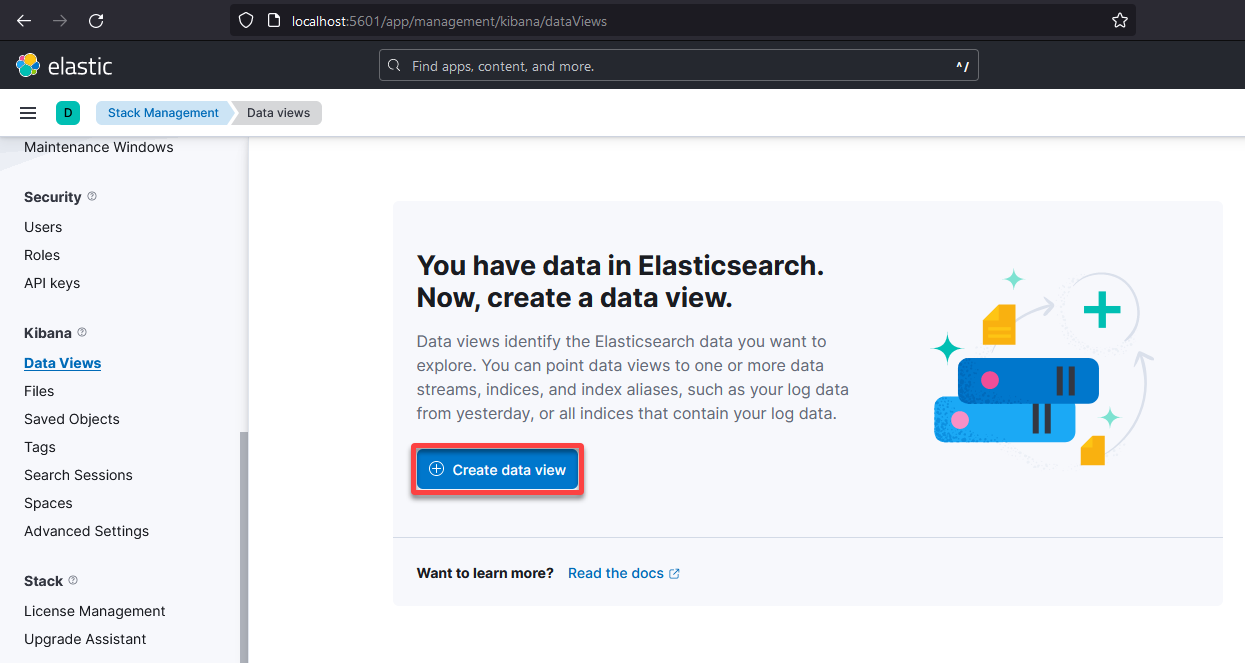
3. On the Data Views page, click Create data view to initiate the process of creating a new data view or index pattern. An index pattern is a way to tell Kibana which Elasticsearch indices you want to explore and analyze.
Note that the Create data view button only appears when Kibana knows you have data in Elasticsearch. In this case, the data is what you provided when you started Logstash.
4. Now, input a Name and an Index pattern (which should match the index pattern defined in the configuration file) for the data view, and click Save data view to Kibana to save the data view.
All sources matching the index pattern you inputted will be displayed in the right-hand corner of the form. In this case, the index pattern matches just one source, so that is selected. Once created, your browser redirects to the page of your newly-created data view (step five).

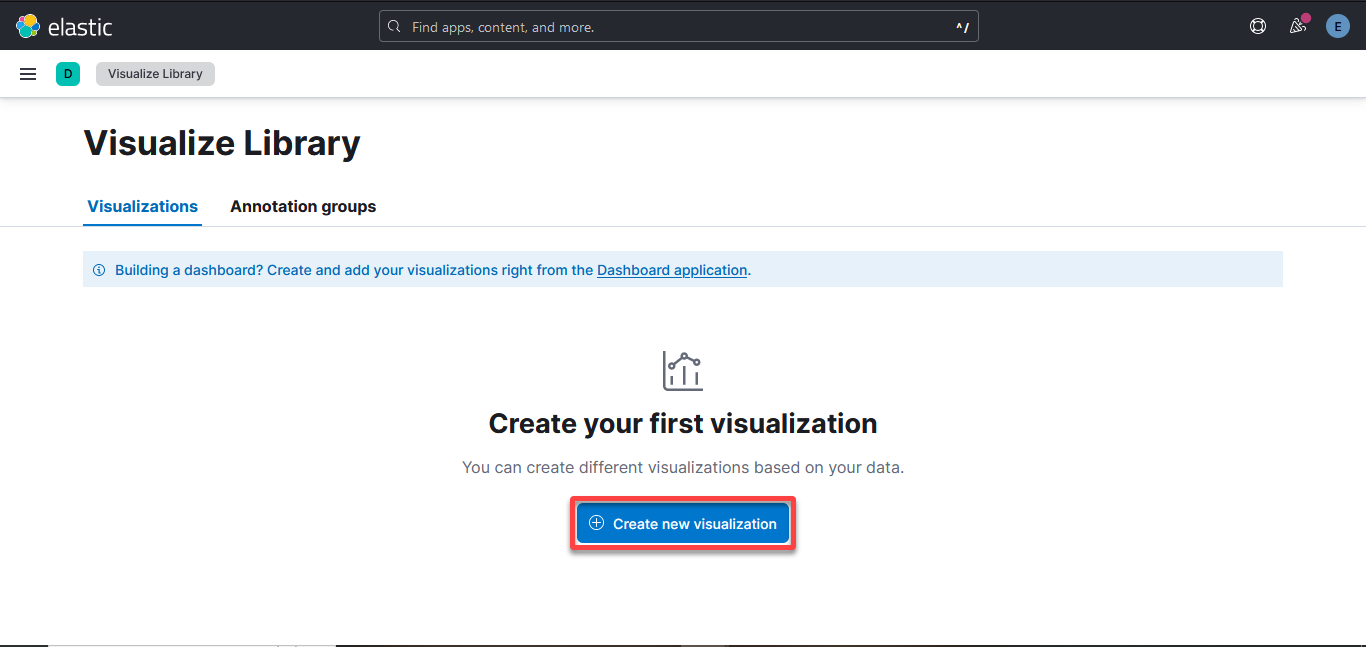
5. On your data view, expand the side menu and navigate to Visualize Library under the Analytics section.
Your browser redirects to the Visualize Library page, where you can create, explore, and manage visualizations based on your data (step six).
6. Next, click Create new visualization to initiate creating a new visualization of your data.
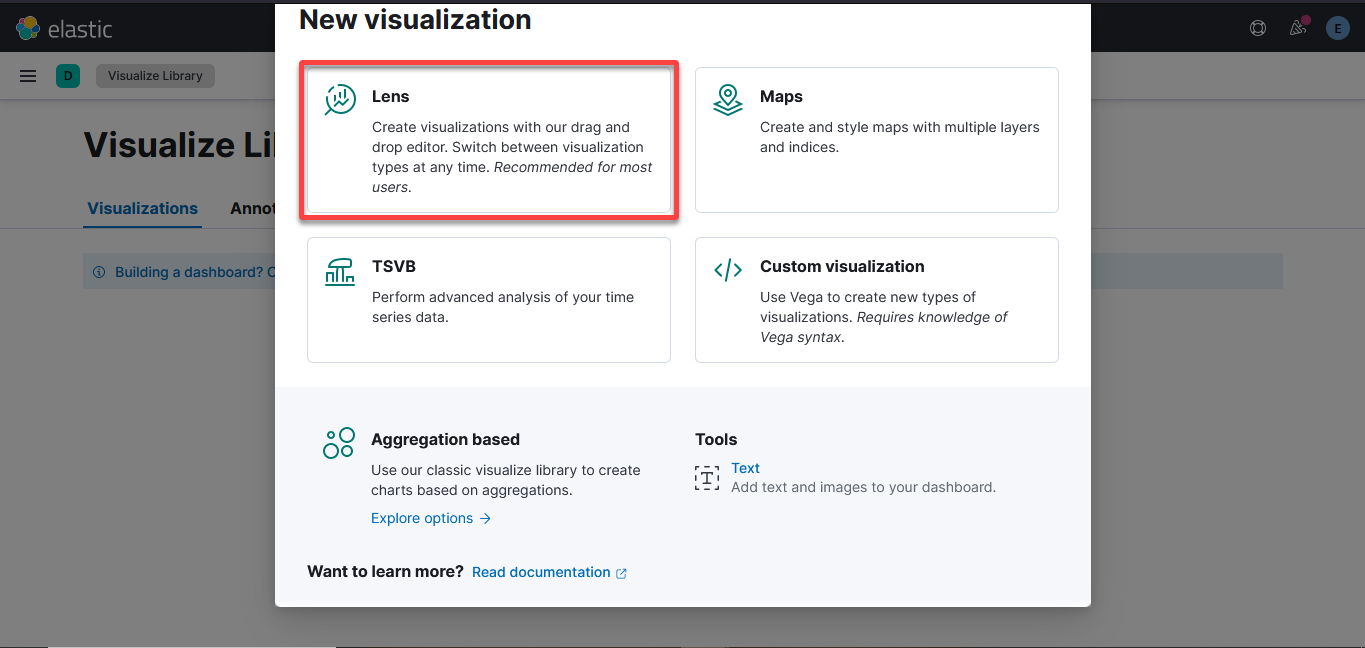
7. On the pop-up window, select any of the following for how you want to create the visualization:
- Lens – Choose this visual editor in Kibana if you want a super-friendly and quick way to whip up charts and visuals.
- Maps – If your data has a geographic side, Maps is your map-loving buddy. Think of it as a virtual globe-trotter helping you plot points or create cool maps that reveal the story behind your locations.
- Time Series Visual Builder (TSVB) – TSVB is like having a time-traveling companion for your data. Perfect for diving into time-based trends with style and control.
- Custom visualization – Choose this option to unleash your creativity. Custom visualization is a DIY approach, giving you the artistic freedom to mold your visuals exactly the way you want.
But for simplicity’s sake, in this tutorial, choose the Lens visual editor.
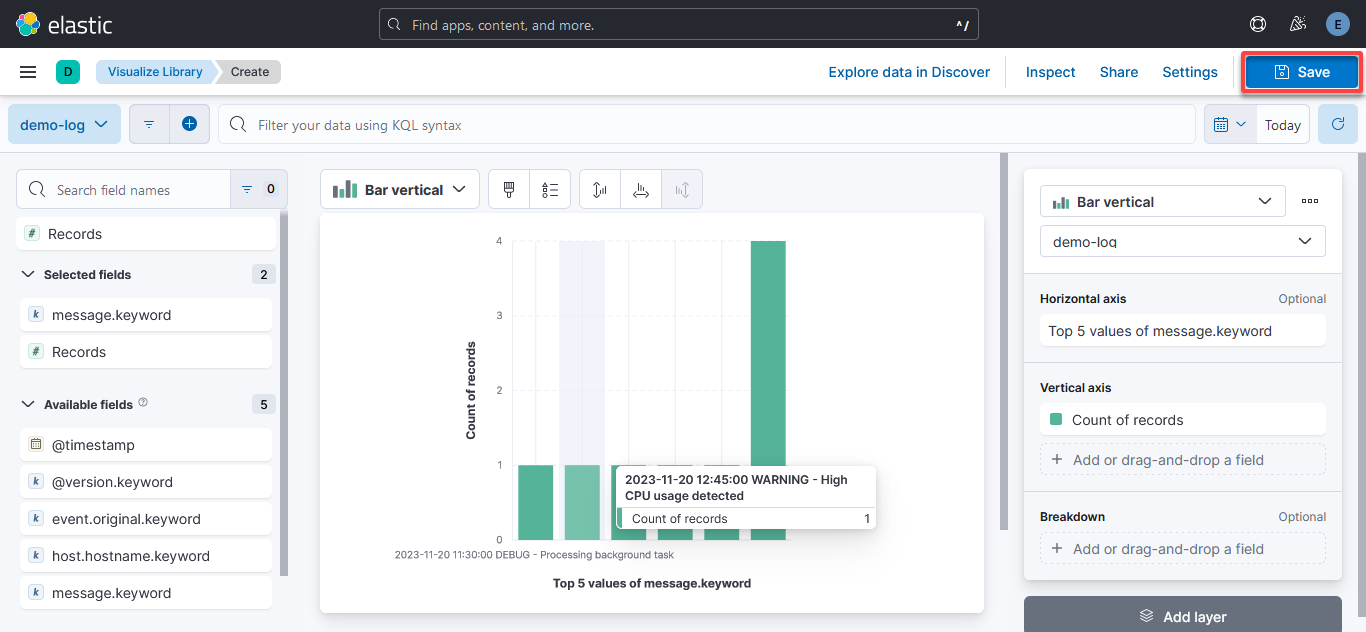
9. On the Lens visual editor, hover over any of the available fields to display, and click the plus sign (+) to add that field to your workspace.
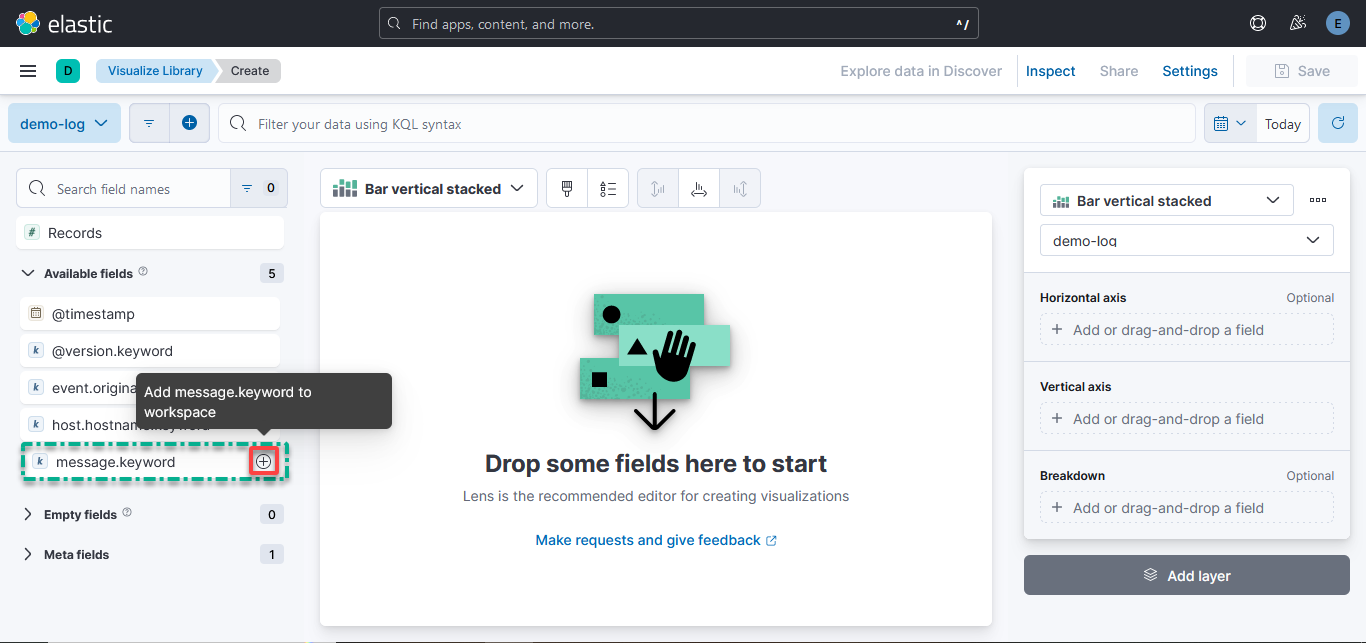
Once added, click Save (top-right) to save the visualization where you see the field(s) added are shown based on your selected chart type.
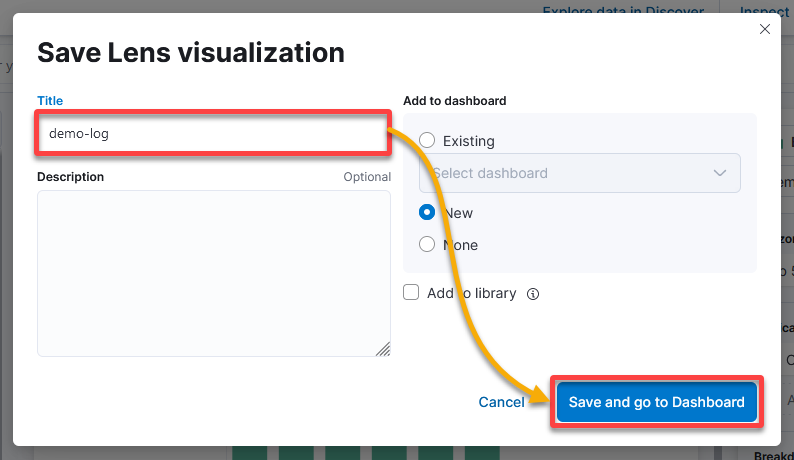
10. Finally, add a Title for the visualization, indicate if you’d like to add it to a dashboard, and click Save and go to Dashboard to finalize creating your visualization dashboard.
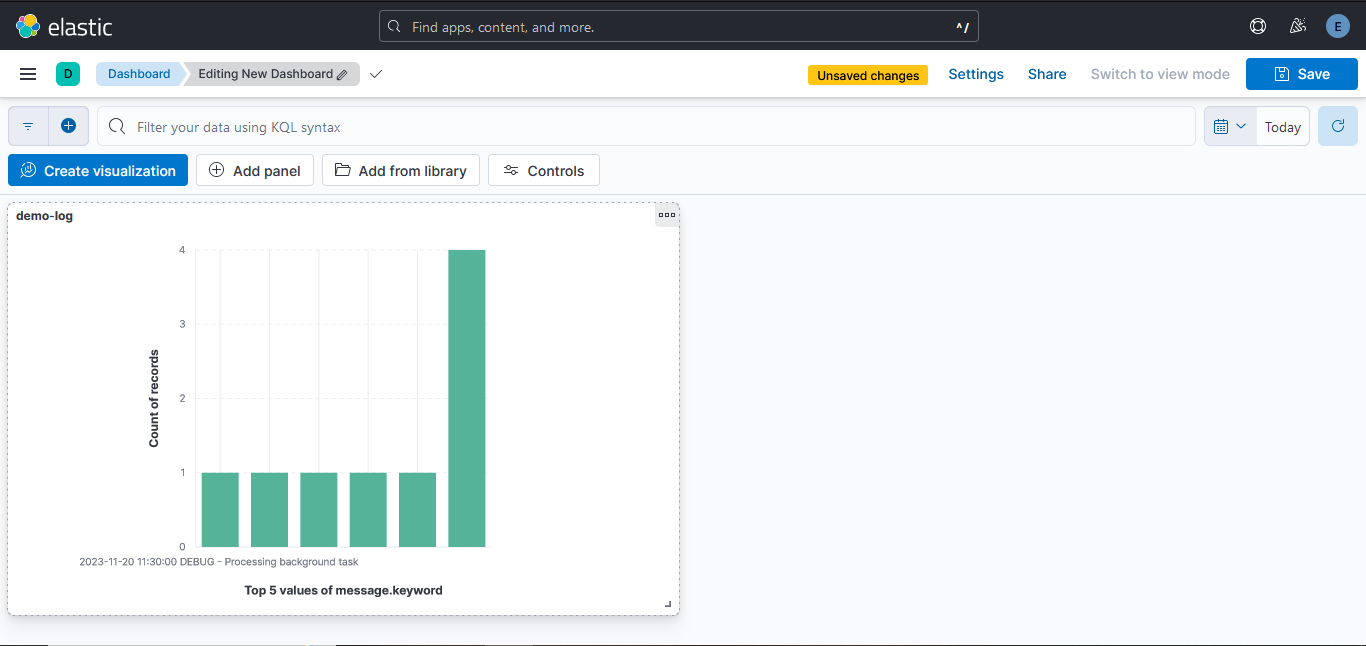
Once saved, a dashboard with your visualization appears, as shown below, which confirms your data visualization undoubtedly works.
Conclusion
Throughout this tutorial, you’ve successfully set up the powerhouse trio: Elasticsearch, Logstash, and Kibana, known as ELK stack on Windows. You started from laying the foundation to orchestrating data flow to visualizing insights.
The foundation is set at this point, and your Windows environment is now an analytics powerhouse, ready to munch on data.
Now, as you bask in the glow of your newly set up ELK Stack on Windows, the adventure doesn’t end here. Why not try integrating Beats for seamless data shipping? Or see other ways to add data to your ELK stack?
The ELK Stack is a versatile toolkit, and you’re just scratching the surface. Keep tinkering, keep exploring—your data journey has only just begun!


