


K9s is a terminal-based UI that aims to simplify Kubernetes management. With the ability to edit and apply manifests coupled with a handy context menu, you hardly need to remember any explicit kubectl commands.
Want to know how K9S works? Read on as you interact with a Kubernetes cluster in style in this K9s Kubernetes CLI tutorial.
Prerequisites
This tutorial will be a hands-on demonstration. If you’d like to follow along, you’ll need the following requirements.
- You’ll need a Linux machine to host the Kubernetes cluster. This tutorial uses Fedora 35.
- Your Linux computer must have Minikube already installed for your local Kubernetes. This tutorial uses the latest version of this writing, v1.25.2.
- You must also install the kubectl tool on your Linux computer.
Installing the K9s Kubernetes CLI
You’ll now install the K9s Kubernetes CLI with all the prerequisites in place. There are several ways to install K9s, including from source, downloading the binary, through some Linux distro’s package manager.
The most convenient and universal way is via webi, which you’ll be doing in this example. To do so, follow these steps.
1. Log in to your Linux server using your preferred SSH client.
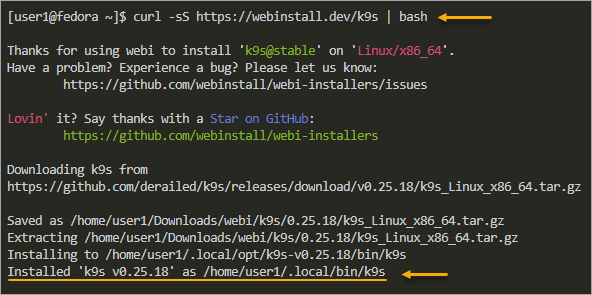
2. Next, run the below command to install K9s by downloading the webi script and piping it to Bash.
curl -sS https://webinstall.dev/k9s | bashAs you can see below, the script installed k9s to the /home/<user>/.local/bin folder.
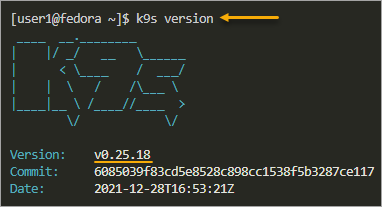
3. Run the below command to check your version of K9s and if the command works.
k9s versionThe latest version as of this writing is v0.25.18.
4. After confirming that K9s is working, set the default text editor on your Linux computer by running the below command. Replace vi if you prefer to set a different default editor, such as nano or emacs.
This step is crucial for K9s to know which text editor to use when editing configuration files within the K9s terminal UI.
export EDITOR=viStarting a Cluster and Creating a Deployment
The K9s Kubernetes tool is ready for use, but it will not be useful if you do not have a cluster to manage. In this section, you will start a Kubernetes cluster and deploy a web service.
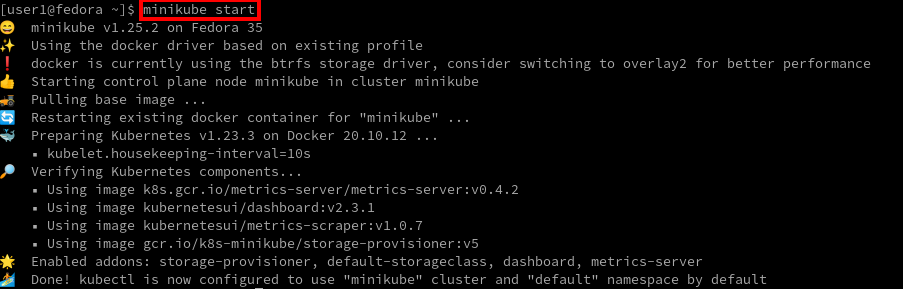
1. Execute the following minikube command to start a Minikube cluster as follows.
minikube startThe response in your terminal window should resemble the screenshot below
2. Next, run the following command to deploy an Apache web server to your Kubernetes cluster.
# (deployment) Deployment name    = httpd
# (--image) Base image            = httpd:latest
# (--replicas) Number of replicas = 2
kubectl create deployment httpd --image=httpd:latest --replicas=2
You will see an output similar to the screenshot below, confirming the command was successful.

3. Lastly, run the below command to enable the metrics-server addon. This step ensures metrics collection for your cluster and deployments.
minikube addons enable metrics-server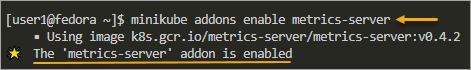
Monitoring Your Cluster via Pulses
Now that you’ve created the test deployment and enabled metrics collection, you’ll learn how to monitor them in K9s.
K9S has a handy cluster-wide dashboard feature called Pulses, which shows you charts and statistics for deployments, events, pods, etc. Follow the steps in the following paragraphs to know how to monitor your cluster with Pulses.
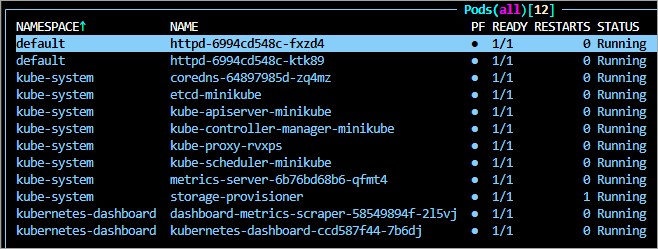
1. Connect to the Kubernetes cluster in default mode by running the below command.
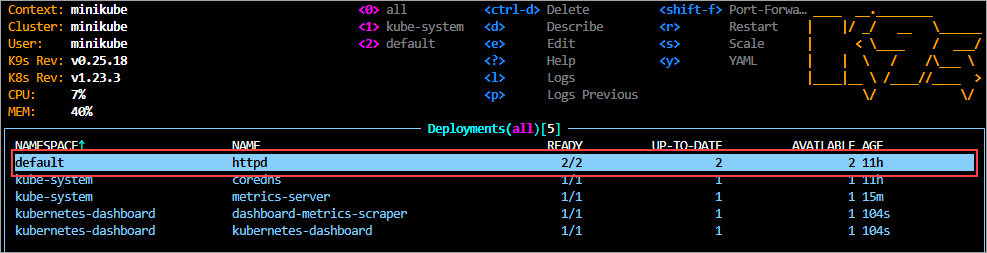
k9sYou should see a list of deployments in all namespaces. Your deployments list would be different than the ones you see below. Focus on the httpd deployment, which is the one you created earlier.
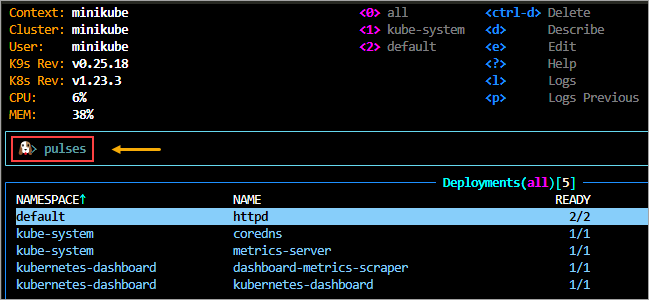
2. Type the:pulses command and press Enter to activate the Pulses view.
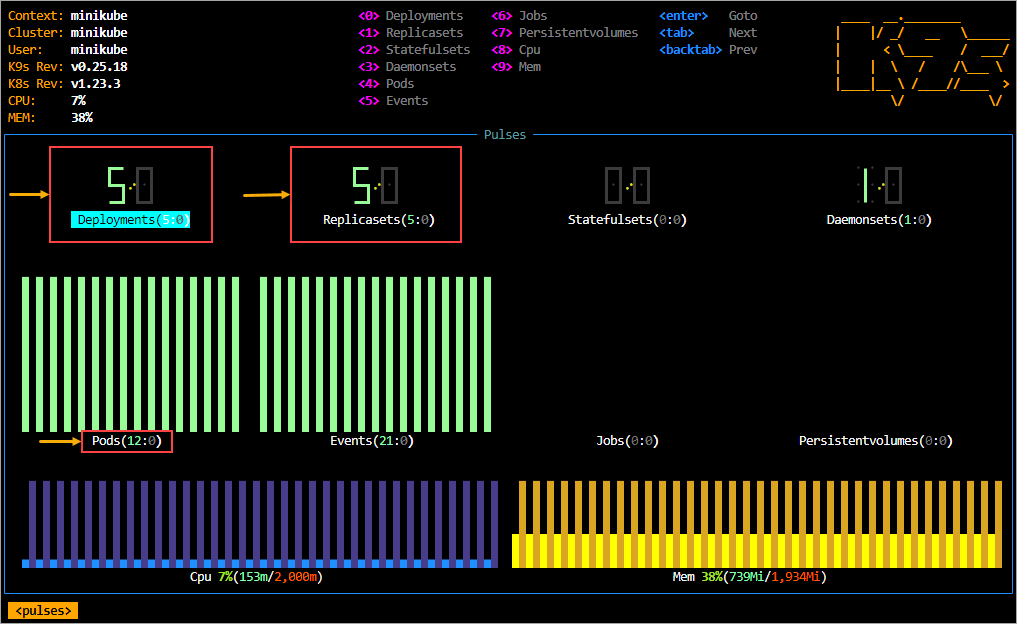
The Pulses view displays the pertinent statistics about your cluster and the resources running within it. For example, the screenshot below shows that the cluster has 5 Deployments, 5 Replicasets, and 12 Pods.
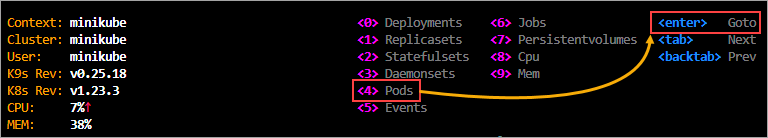
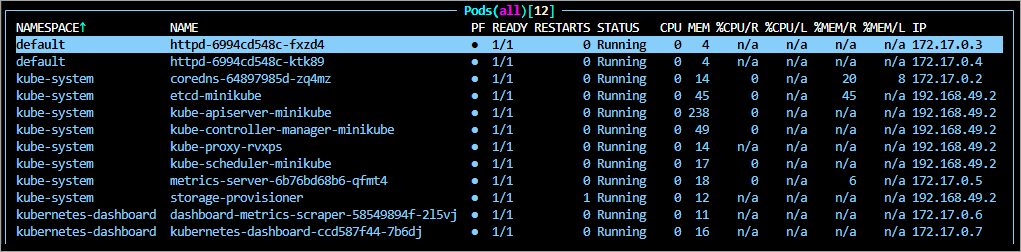
3. To select a metric, press the corresponding number for that object. For example, press 4 to select Pods and press Enter to switch to the Pods view, as shown below.
You should see the list of running pods in all namespaces. The list includes the pods’ status and resource statistics, such as CPU and Memory usage.
4. Press Escape to go back to the Pulses view.
Discovering and Managing Your Pods
Well done! You now have a list of all pods running in your cluster. In this section, you will isolate and perform management tasks on the pods in your httpd deployment.
1. Switch to the Pods view by entering the :pod command.
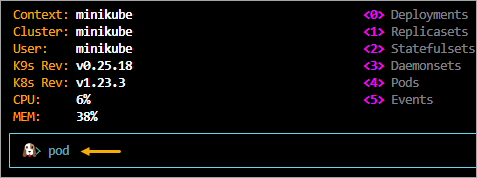
You should see the list of all the pods in all namespaces on your screen.
2. Press the corresponding number for the default menu to filter the list and show only the pods under the default namespace. After pressing the namespace number, you’ve effectively filtered the pods’ list, as shown below.
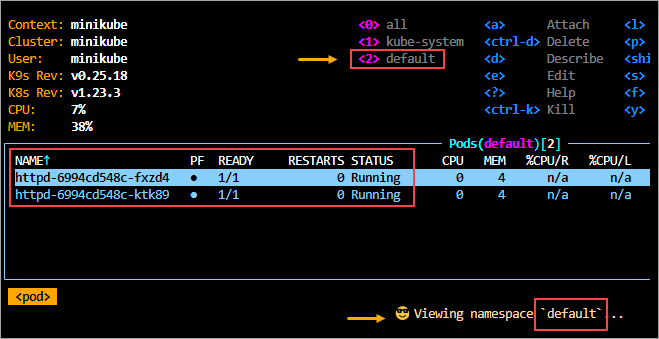
3. Now that you’ve filtered the pods by their namespace, you can manage each pod, knowing in which namespace they belong and eliminating any possible confusion.
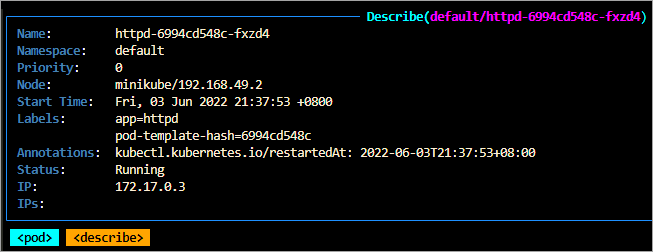
For example, highlight the first pod in your list and press d to show the pod’s details on the screen. This action is equivalent to running the kubectl describe command.
4. To go back to the Pods list, press Esc.
Scaling a Deployment
When you need to increase or decrease the number of replicas in your deployment, you’d typically run the kubectl scale command or manually edit the configuration. The K9s CLI makes scaling your deployment more convenient with a menu-driven interface.
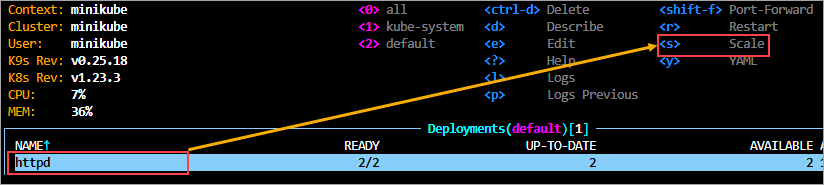
1. Type the below command in K9s and press Enter to switch to the Deployments view.
:dp2. Highlight your httpd deployment and press s to bring up the Scale configuration box.
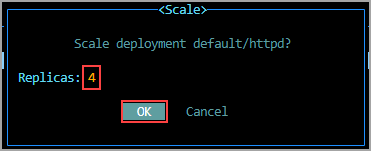
3. Change the number of Replicas in the deployment from 2 to 4. Next, move the cursor to OK using the arrow keys and press Enter to apply the change.
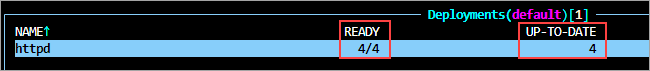
Your httpd deployment should now have 4 pods after applying the scaling change.
Exposing a Deployment for External Access
One of the most consistent ways to expose a Kubernetes deployment is to apply a service manifest file. The following steps will show you how to apply a manifest file inside the K9s Kubernetes CLI.
1. Open another terminal window and create a YAML file named /tmp/httpd-np.yml using your preferred editor. This example uses vi as the editor. Once the vi editor is open, press i to enter the INSERT mode.
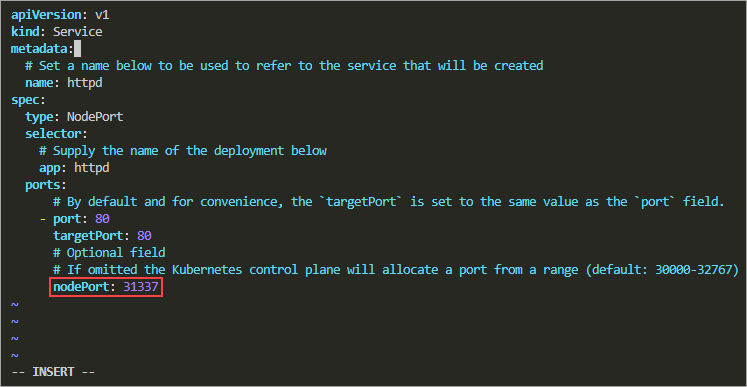
vi /tmp/httpd-np.yml2. Copy and paste the following YAML directives into the file. This directive exposes the service to the 31337 external port.
apiVersion: v1
kind: Service
metadata:
  # Set a name below to be used to refer to the service that will be created
  name: httpd
spec:
  type: NodePort
  selector:
    # Supply the name of the deployment below
    app: httpd
  ports:
      # By default and for convenience, the `targetPort` is set to the same value as the `port` field.
    - port: 80
      targetPort: 80
      # Optional field
      # If omitted the Kubernetes control plane will allocate a port from a range (default: 30000-32767)
      nodePort: 31337
Your file should resemble the screenshot below at this point—press Escape exiting the INSERT mode before you do the next step.
3. Type the :wq command and press Enter to save and exit the editor.
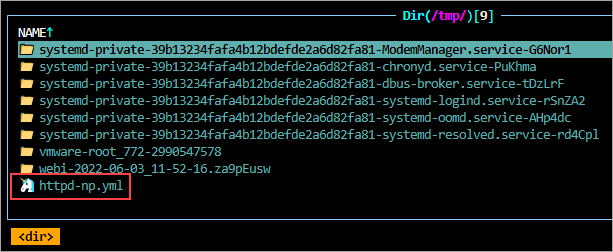
4. Switch back to your K9S terminal and type :dir /tmp/. Doing so switches K9s to the directory view. As you can see, the file httpd-np.yml you created is on the list.
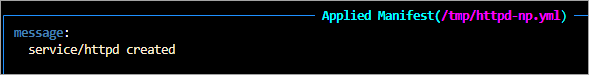
5. Move the cursor to the httpd-np.yml file, and press a to apply the manifest.
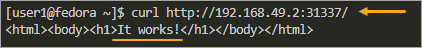
6. Finally, test the service by opening the web address http://<node_ip>:external_port in your browser. In this example, the web address is http://192.168.49.2:31337.
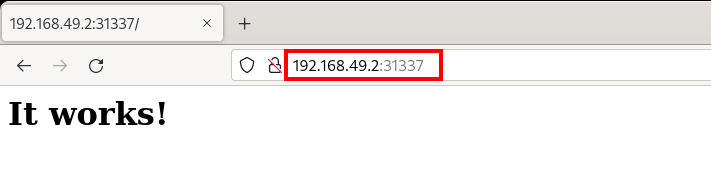
As an alternative, run the below command in another terminal window.
curl http://192.168.49.2:31337You should get a similar result to the image below.
Digging Deeper with XRay
Exploring your cluster one resource class at a time is good. But, K9S’ Xray feature allows you to explore all the resources that constitute another resource in a single tree view.
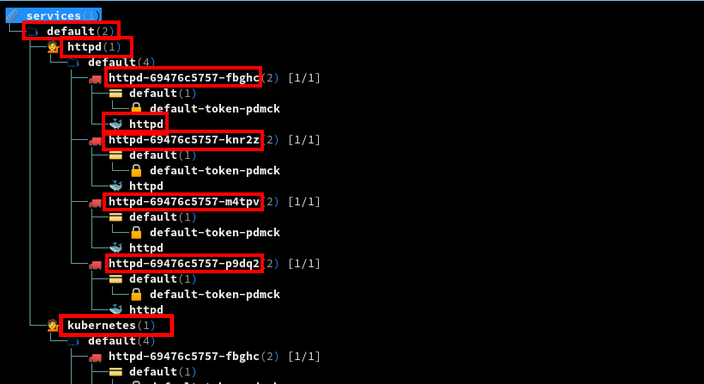
Enter the :xray command to view all services (svc) and their constituent resources.
:xray svc
At a glance, you will notice two services in the default namespace; httpd and kubernetes. You also see that four httpd-based containers are connected to the httpd service.
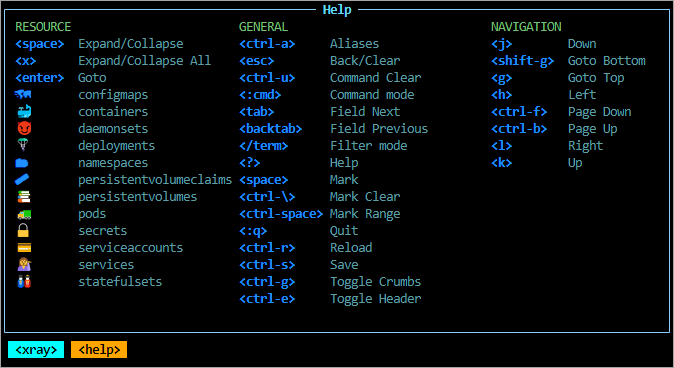
Type a ? to get help on Xray. You at least get to understand what all the icons mean for the uninitiated. You’ll also see the GENERAL and NAVIGATION key bindings.
Viewing Cluster Resources Logs and Events
Logs and events are a potent way of understanding the state of a running cluster either for capacity planning or troubleshooting. Beginning at the Xray view, you will, in this section, explore K9S’ ability to view logs, events, and cluster metrics.
1. Move the cursor to the first pod under the httpd tree node.
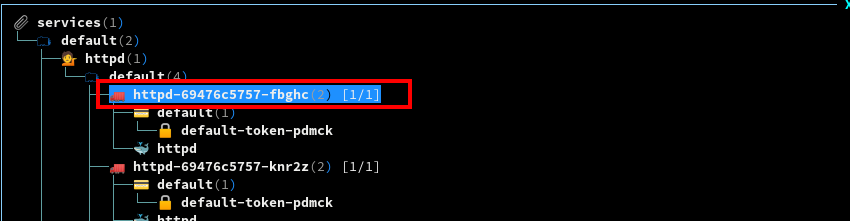
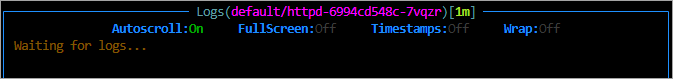
2. Hit l to view the container’s logs, as shown below. You will see log entries that arrived within the last minute [1m].
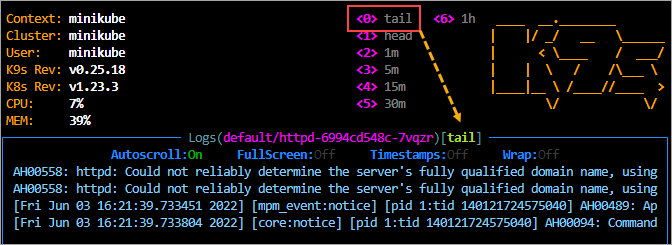
3. Press 0 to switch to tail mode to show all the recent log entries.
Describing the Cluster’s Current State
You can also find further information on the condition of your cluster by describing it in the following steps.
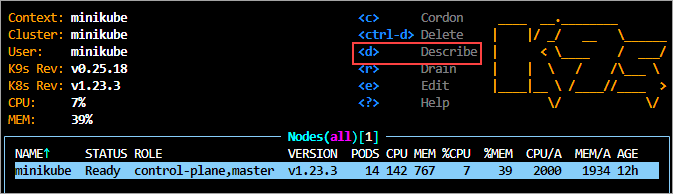
1. Type :node and press Enter to switch to the Nodes view.
2. Press d to describe the currently highlighted cluster on the list.
You should see a list of cluster-specific parameters and their states.
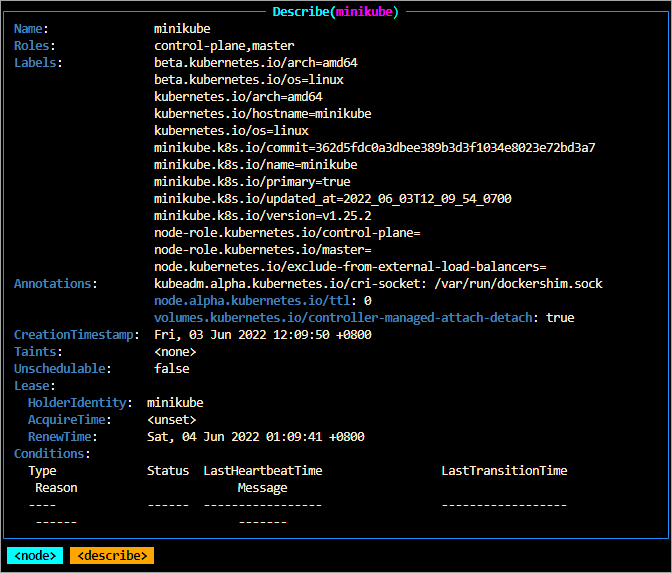
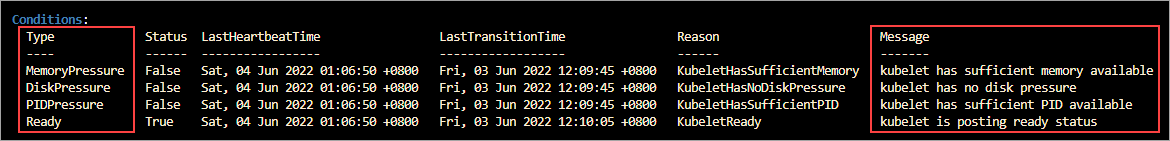
3. Scroll down to the Conditions section to view the state of critical metrics such as Disk and Memory Pressure. In the below screenshot, you will notice the cluster has no alarming conditions.
4. Scroll to Events to have a summary log of events on your cluster. This example shows that there’s one Warning about the port binding. You can see how this feature can be an excellent entry point when troubleshooting cluster resource issues.

Conclusion
By making it to the end of this tutorial, you have learned to install, configure, and operate the K9S Kubernetes CLI to manage your Kubernetes clusters with as few keystrokes as possible. Like any new tool, there’s always a learning curve, which is true with K9s.
But in the long run, K9s’ menu-driven graphical interface surely beats running commands manually in the terminal. Now, perhaps you can deploy Postgres to a Kubernetes cluster and flex your K9S muscles to manage that deployment.


