


In today’s DevOps era, monitoring multi-tier microservices and applications in a data center or cloud infrastructure is important. One of the most widely used monitoring tools is Grafana, and you’ll get started with monitoring in this Grafana tutorial.
Grafana is an open-source tool that performs analysis of logs errors from various sources and centrally manages monitoring. And in this Grafana tutorial, you’ll learn how to install Grafana on your machine, add data in Grafana, and monitor that data.
Ready? Read on and never miss crucial data again!
Prerequisites
This post will be a step-by-step Grafana tutorial. If you’d like to follow along, you only need an Ubuntu 14.04.4 LTS or greater – This Grafana tutorial uses Ubuntu 20.04.3 LTS machine.
Installing Grafana on Ubuntu (Command Line)
Grafana is an open-source tool that supports cloud monitoring vendors, such as Amazon CloudWatch, Microsoft Azure, SQL Db’s and Postgres, and MySQL. But before you query or analyze the data, you’ll first need to install Grafana on your machine.
1. Connect to your Ubuntu machine using your favorite SSH client.
2. Next, run the apt update command below to update package repositories in your machine.
sudo apt update 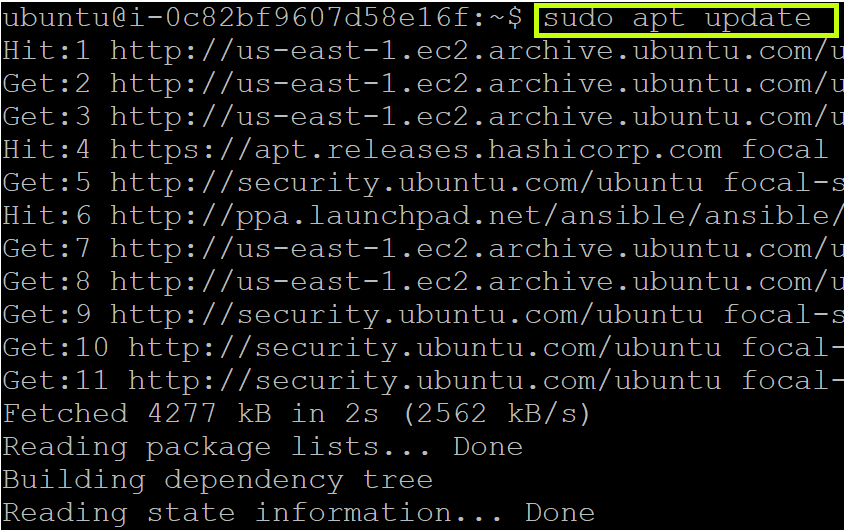
3. Run the following apt-get install command to install the Grafana dependency packages ( software-properties-common, wget, transport-https, and curl). You’ll need these packages to download the required Grafana packages later.
sudo apt-get install -y apt-transport-https curl software-properties-common wget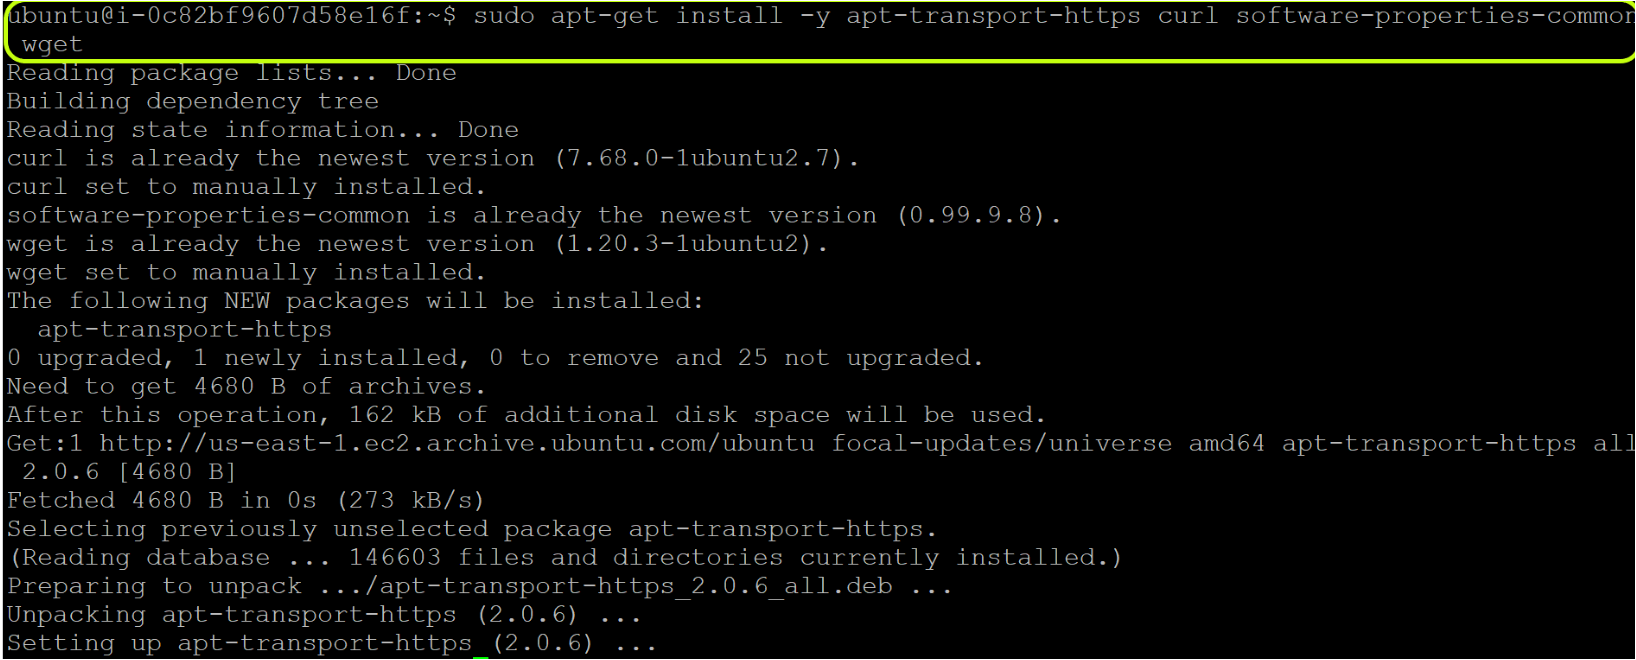
4. Now, run the wget command below to add the Grafana GPG Key. Adding the GPG key to your apt installation’s trusted key list lets you download and verify GPG signed packages.
wget -q -O - https://packages.grafana.com/gpg.key | sudo apt-key add -Below, you can see an output with an OK message, which confirms the successful addition of the GPG Key.

4. Execute the add-apt-repository command below to add the Grafana repository (https://packages.grafana.com/oss/deb) to your APT sources. Adding the Grafana repository allows you to install the Grafana software on an ubuntu machine.
If you install from the APT repository, then Grafana is automatically updated every time you run apt-get update
sudo add-apt-repository "deb https://packages.grafana.com/oss/deb stable main"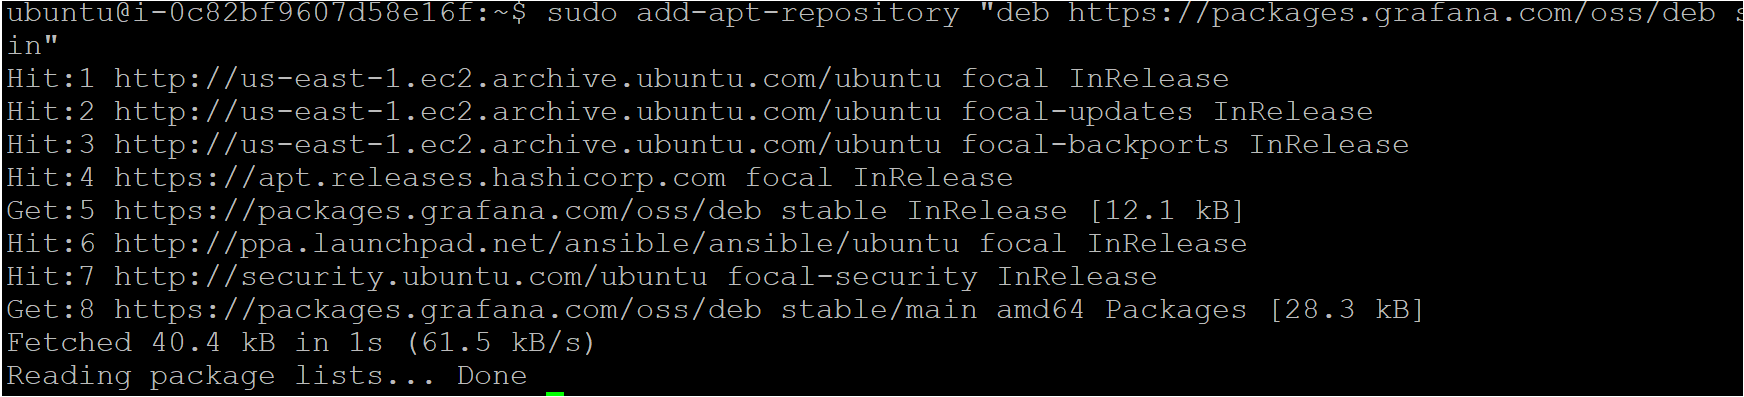
5. Rerun the apt update command below to refresh your APT Cache to update the package list.
sudo apt update6. Next, run the apt install command below install the Grafana package.
sudo apt install grafana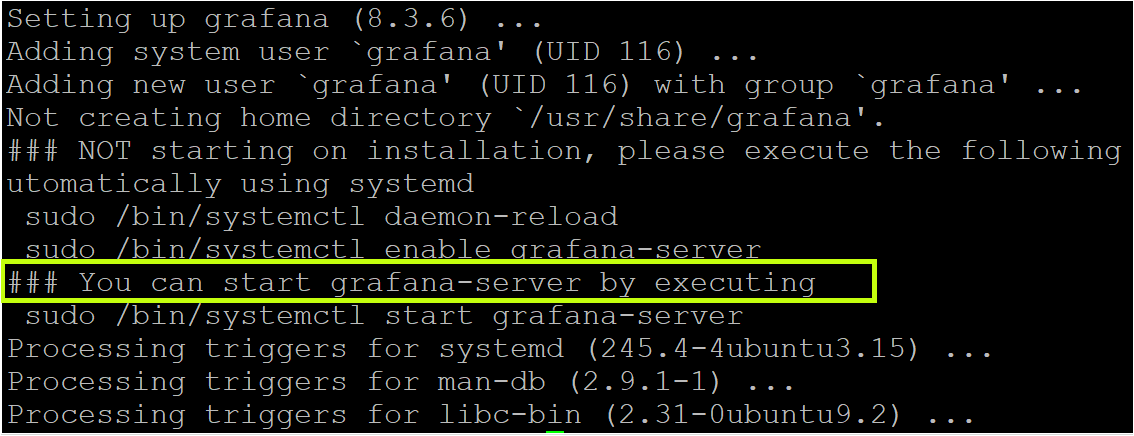
7. Run the following systemctl command to start the Grafana service (grafana-server)
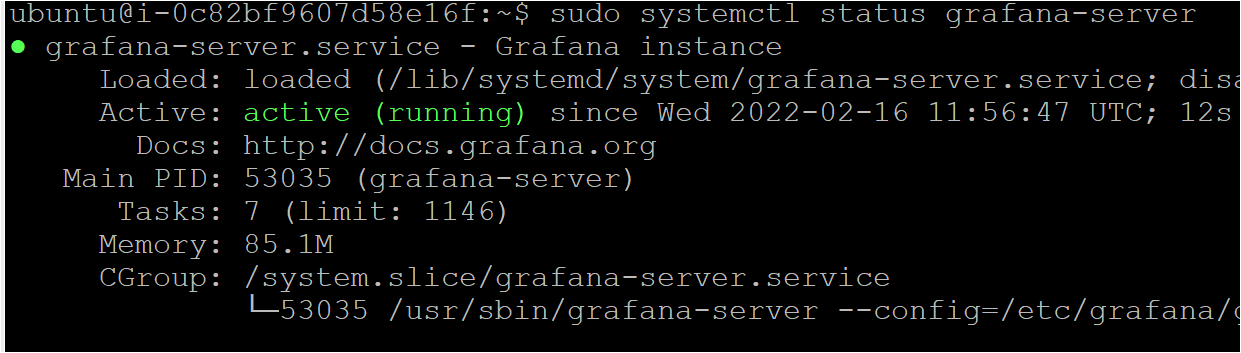
sudo systemctl start grafana-server8. Finally, run the below command to verify the status of the Grafana service (grafana-server).
sudo systemctl status grafana-serverAs you see below, the Grana service is on active (running) status, which indicates Grafana is running correctly.
Adding Data in MySQL Database
You’ve just successfully installed Grafana on an Ubuntu machine. So now what? Unless you add data into the data source and configure it in Grafana, you can’t do much with Grafana.
This Grafana tutorial uses MySQL database to store data. But before storing data, you’ll need to install MySQL on your machine.
1. Run the apt install command below to install the MySQL package (mysql-server).
sudo apt install mysql-server2. Next, execute the below command to check the status of mysql.service and verify if you’ve successfully installed MySQL on your machine.
systemctl status mysql.service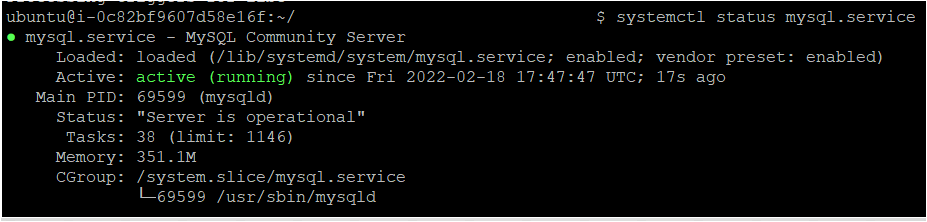
3. Now, execute the below command to run MySQL software on your machine.
sudo mysql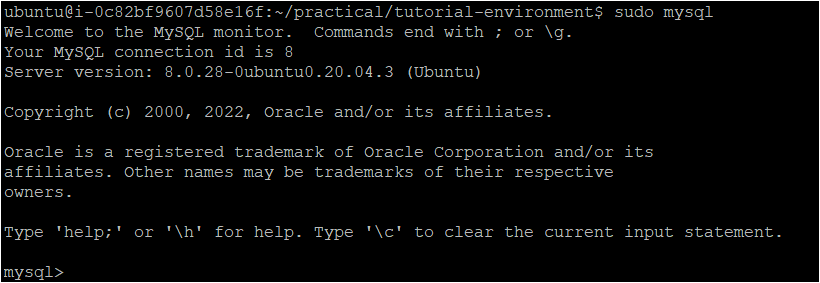
4. Run the following command to create a user on MySQL. You can change the username and password as you prefer. But the below command creates the peterw user with a password (jyp12345), which is granted with all required permissions.
These permissions enable the user to create, insert, or read MySQL data.
Creating a new user in the MySQL database assigned with appropriate permissions is always recommended, rather than an admin user.
create user peterw@localhost identified by 'jtp12345'
GRANT ALL PRIVILEGES ON *.* TO peterw@localhost;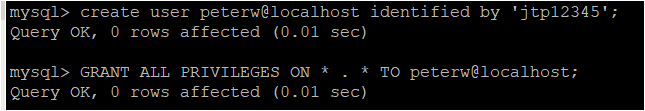
5. Now, run the FLUSH command below for user creation and permissions to take effect.
FLUSH PRIVILEGES;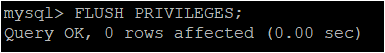
6. Run the mysql command below to log in to MySQL with user peterw.
sudo mysql -u peterw -p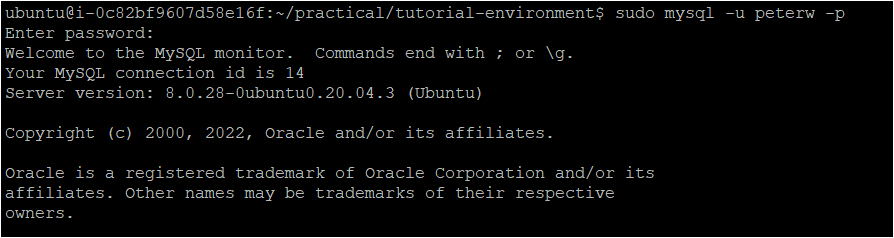
7. Next, run the query below to create a table (employee_ATA) with three columns (name, designation, and age) in a database.
CREATE TABLE employee_ATA(name varchar(45) NOT NULL,designation varchar(35) NOT NULL,age int NOT NULL);
8. Lastly, run each INSERT query below to add data in the employee_ATA table. The below commands add three entries to the database within the name column (AdamBertram, AdamListek, and ShankyMendiratta).
INSERT INTO employee_ATA (name,designation,age) VALUES ( 'AdamBertram', 'Founder_of_ATA', 40);
INSERT INTO employee_ATA (name,designation,age) VALUES ( 'AdamListek', 'Director_of_ATA', 38);
INSERT INTO employee_ATA (name,designation,age) VALUES ( 'ShankyMendiratta', 'Tech_Writer_of_ATA', 32);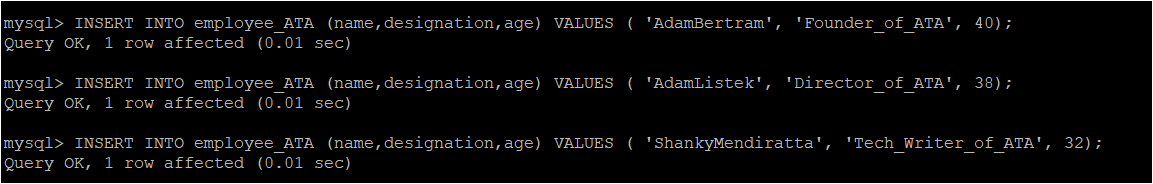
Configuring Data Source into Grafana Dashboard
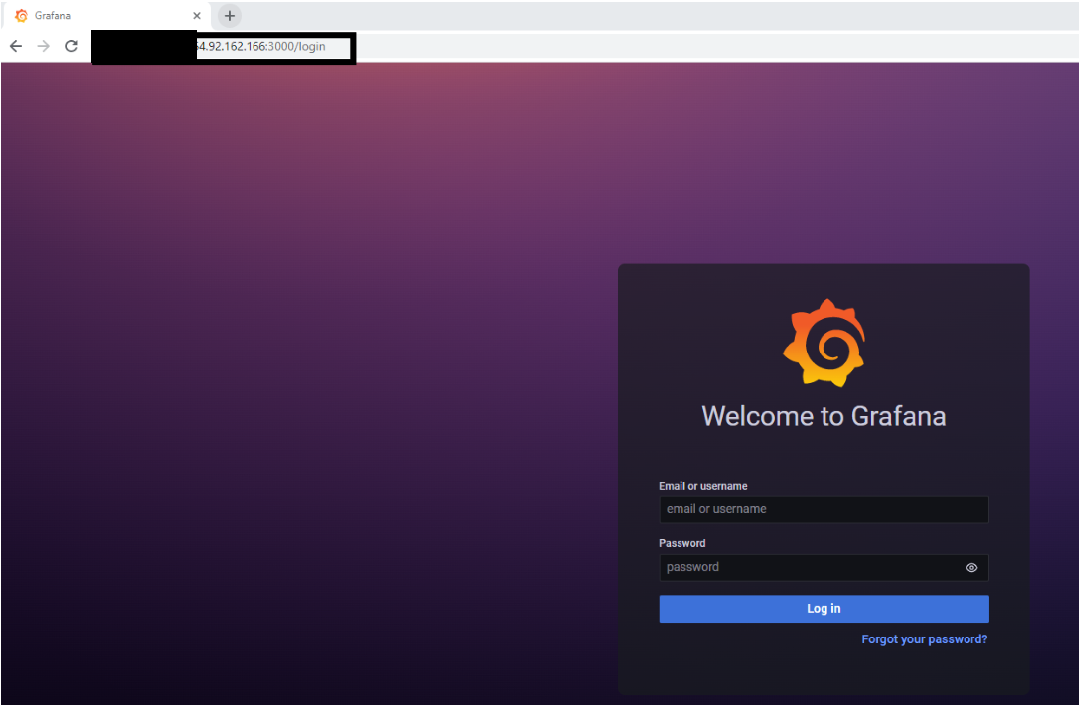
You previously installed Grafana, but how do you know Grafana is running? A default login web page is available to verify that the server is correctly running with the service started.
1. Open a web browser, and navigate the URL below to access the Grafana default web interface. Replace MachineIP with your machine’s IP address.
<MachineIP>:30002. Next, provide the email or username as admin and password as admin, then click on the login button to log in to the Grafana dashboard.
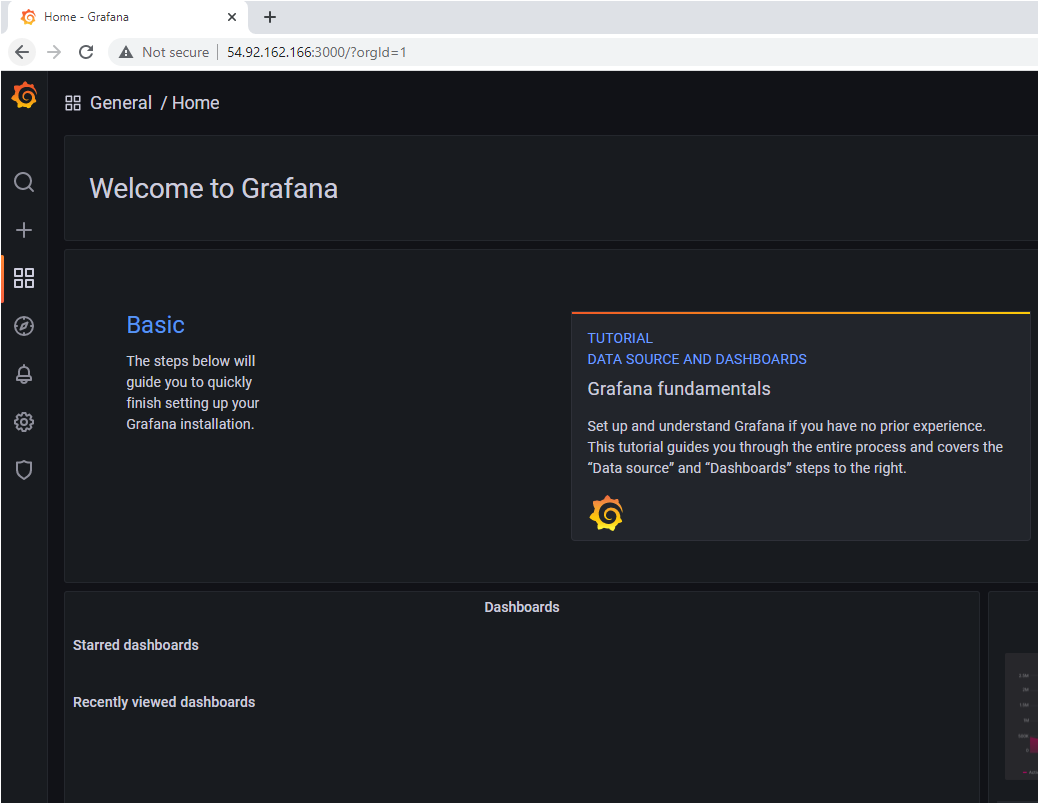
Once you’re in, you’ll get to the Grafana dashboard, as shown below.
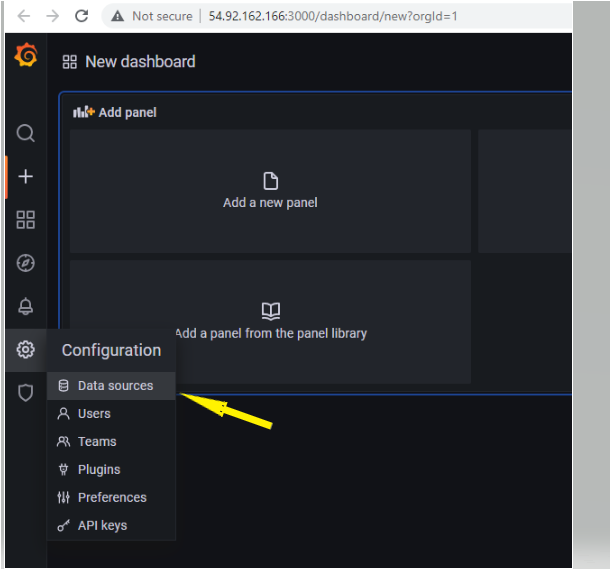
3. Click on the Settings icon (gear icon), and choose Data sources. Doing so redirects your browser to a page where you can configure the data sources (step four).
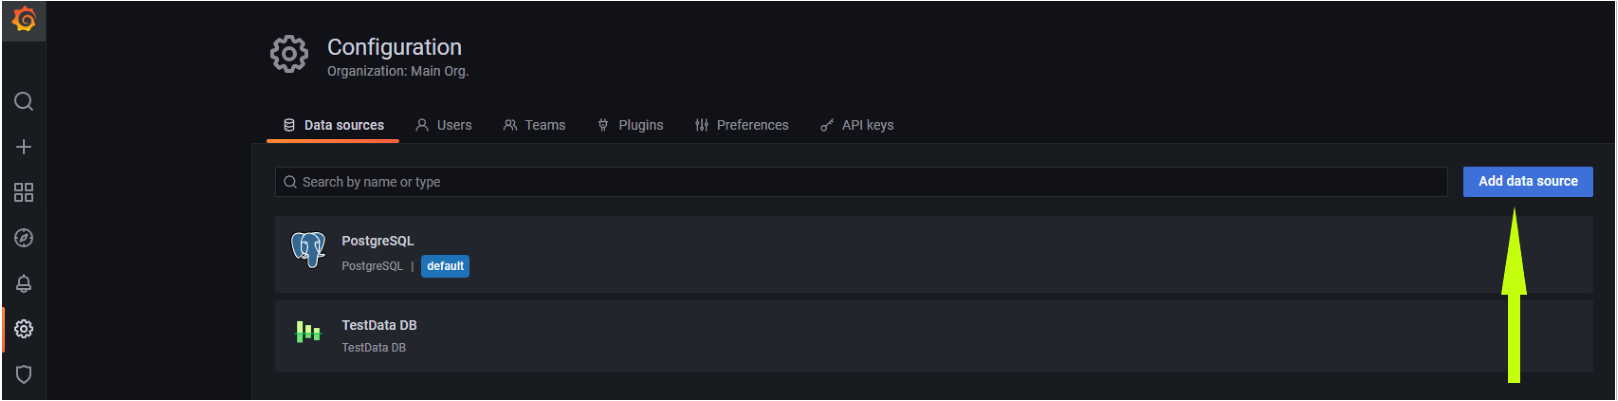
4. Now, click on Add data source, and choose MySQL from the list of data sources you’ll see, as shown below.
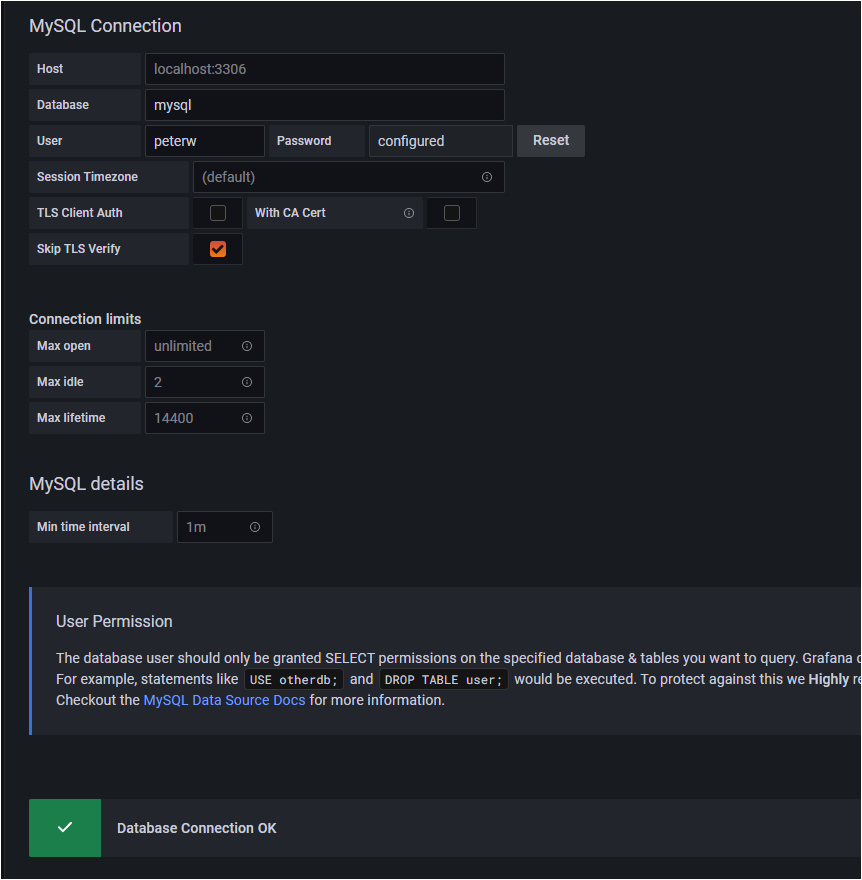
5. Provide the details for the data source:
- The name of the database (
mysql).
- The User (peterw) and password you configured in the “Adding Data in MySQL Database” section (step four).
- Click on Save and Test to save the details and test if the database connection works.
As shown below, you can confirm the successful addition of the MySQL data source.
Monitoring Data in Grafana Dashboard
Up to now, you’ve configured Grafana with MySQL as the data source. So it’s time to test if everything is integrated correctly and monitor the Grafana Dashboard.
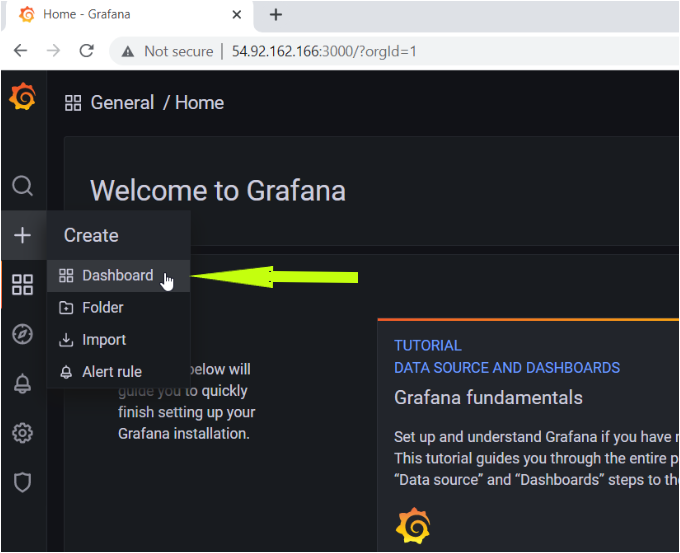
1. Click on the + icon at the left panel, and create a new Grafana Dashboard, as shown below.
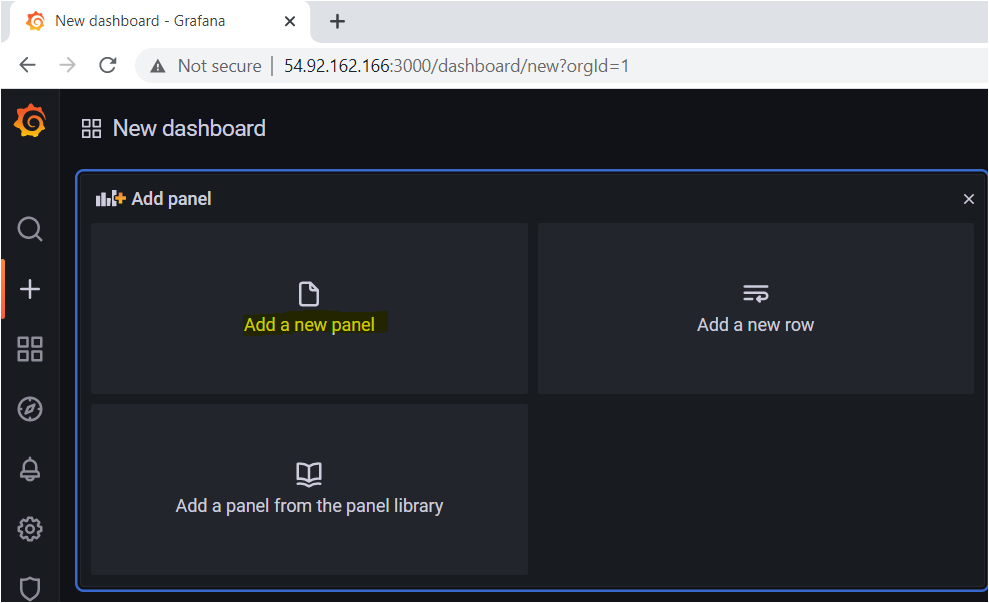
2. Next, click on Add a new Panel option in the new dashboard, as shown below, which redirects the browser to the Edi Panel page (step three).
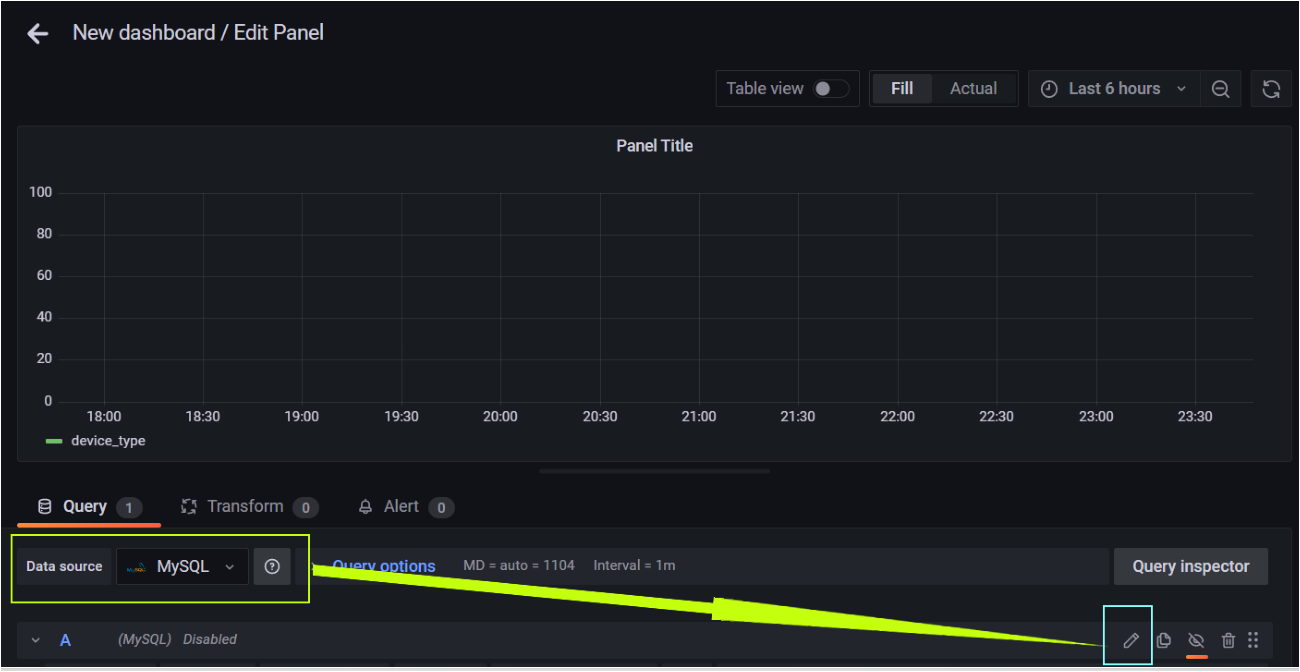
3. On the Edit Panel page, select the Data source as MySQL, then click on the Edit button (pencil icon) to open a code box where you’ll put in a query (step four).
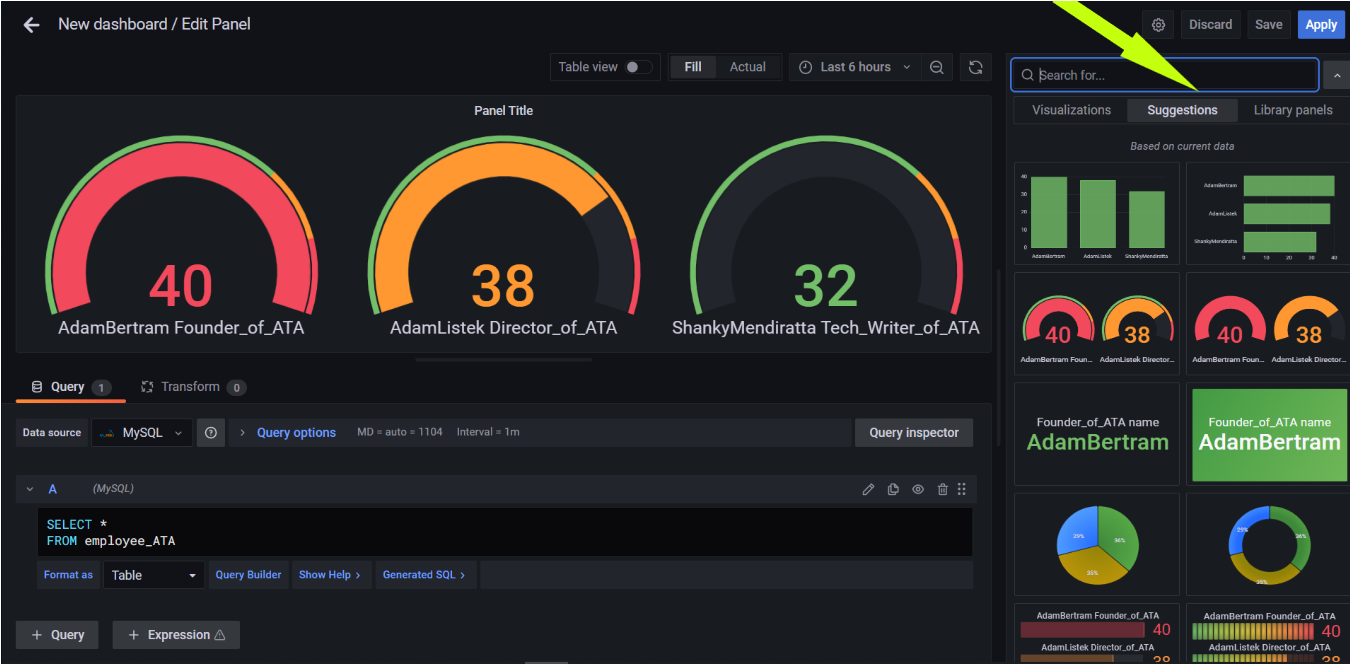
4. Finally, copy/paste the below code in the code box, choose the Format as Table, and click on Apply (top-right) to apply the query.
The below query will publish all data (SELECT *) that resides inside the employee_ATA table.
SELECT *
FROM employee_ATA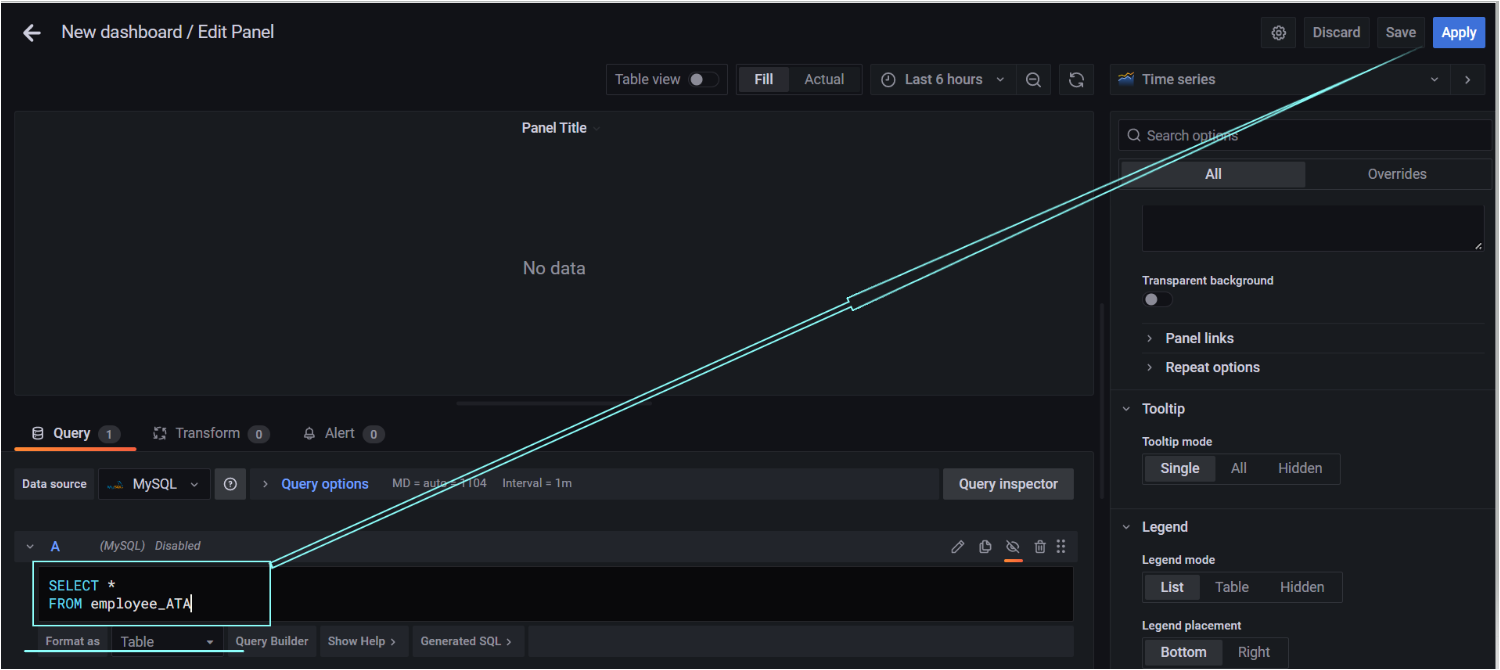
After applying the query, you’ll see the panel below in the Grafana dashboard showing all the employees, their ages, and the designation of each employee.
Notice there are multiple visualizations that Grafana provides you a suggestion to incorporate into your dashboard.
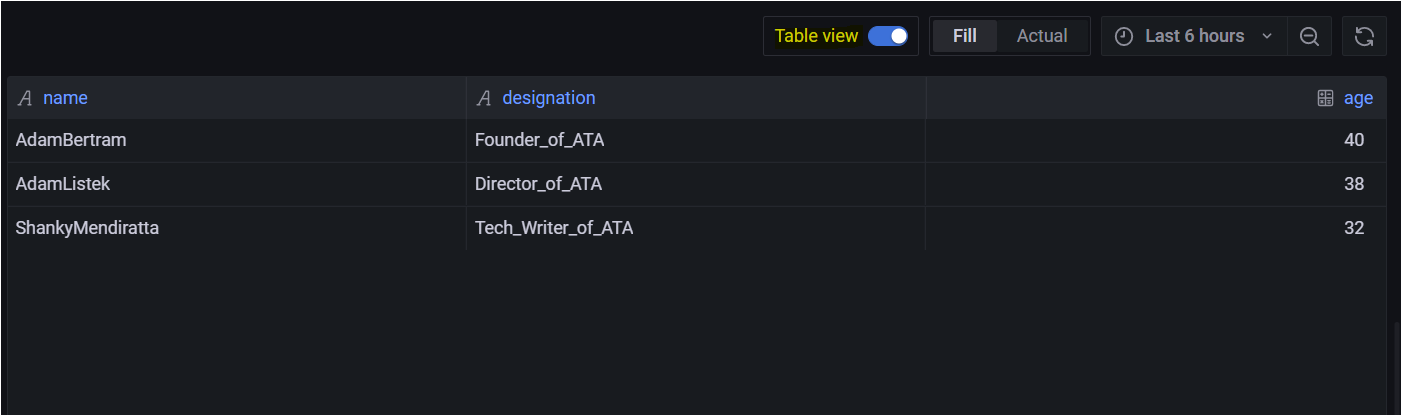
You can also view the same data in tabular format if you select the Table view on the same page, as shown below.
Configure different Visualization in the Grafana Dashboard
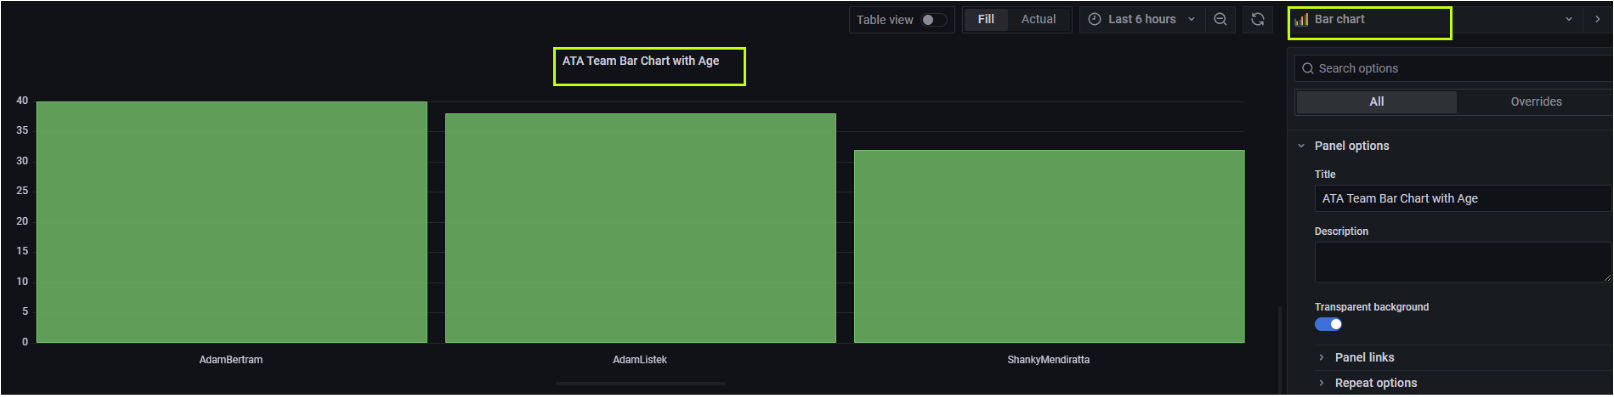
Previously you saw how Grafana generates the data in table format as well as in graphical mode. By default, Grafana provides potential suggestions for Dashboard configuration, based on the selected data source. To further demonstrate this, shown below are two of the visualizations that are most widely used, Bar and Gauge charts.
When you need to display the Dashboard in the Bar chart format you will need to select the bar chart in the visualization, for example, the age of all users in the employee_ATA table are shown in bar format.
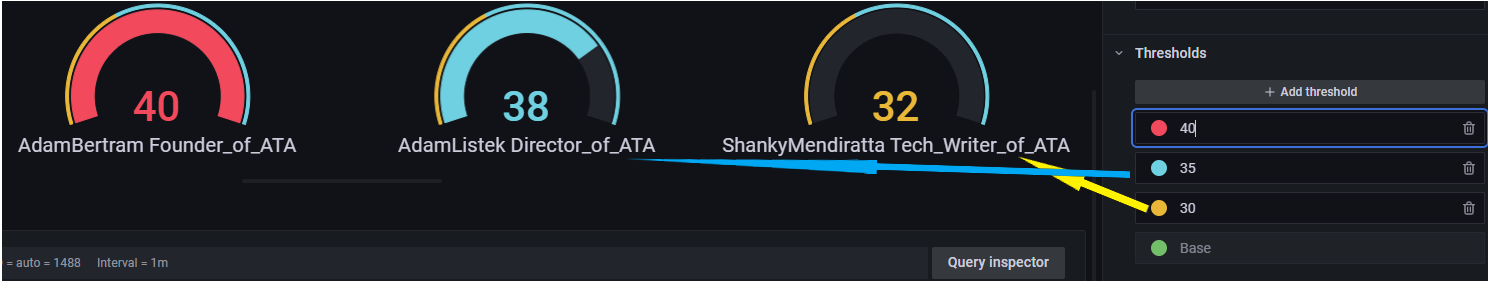
Similarly, choose the Gauge format for a different visualization option. To help determine visual warning conditions, set the threshold and assign the values to a color.
As you can see in the below image, the three selected users have ages greater than 32, hence why yellow is present in each representation. But for the age greater than 40 only Adam Bertram crosses the assigned threshold so his user is represented in Red color.
Conclusion
In this Grafana tutorial, you’ve learned how to set up Grafana and monitor the data stored in MySQL using Grafana. You also learned how to view the data in various visualizations in different panels within the Grafana Dashboard.
Now that you have a fully functional Grafana Dashboard in your machine, what do you plan to monitor next in your Grafana Dashboard?


