

Log monitoring and analysis have become critical nowadays, whether for applications or server/container infrastructure. One of the most popular software stacks for log analysis and monitoring you can choose is Elasticsearch, Fluentd, and Kibana (EFK stack).
EFK stack is a distributed and scalable search engine that allows structured search and analytics. And in this tutorial, you’ll learn how to set up EFK stack log monitoring with Docker and centralize container logs to the EFK stack.
Ready? Read on and ease up your log analysis!
Prerequisites
This tutorial comprises hands-on demonstrations. To follow along, ensure you have the following:
- A Linux host – This example uses the Debian 11 Bullseye server with a memory capacity of 6GB.
- A Docker CE (Community Edition) and Docker Compose installed on your Linux host.
Setting up an EFK Stack Project
EFK Stack is an enterprise-ready log aggregation and logs analysis framework for bare-metal and container infrastructure. But before deploying an EFK stack, you’ll first set up a project directory and create a Docker configuration for deploying EFK Stack on your Docker host.
For this example, you’ll use Docker images with the following specs:
- Elasticsearch 7.17.0 – Capable of storing data with fast lightning Apache Lucene-based search capabilities
- Kibana 7.17.0 – Open-source data aggregation and collector that supports JSON data, and
- Fluentd Custom image based on v1.14.1 – Data visualization software for Elasticsearch.
To set up your EFK stack project:
1. Open a terminal and log in to your server.
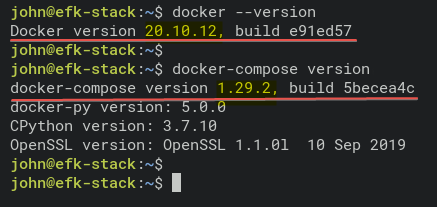
2. Run the below commands to verify both the Docker and Docker Compose are installed on your system.
# Checking Docker version
docker --version

# Checking docker-compose version
docker-compose version
As you see below, the installed versions of Docker CE (Community Edition) v20.10.12 and the Docker Compose v1.29.2.
3. Run the following command to create a new project directory (mkdir) and set it as the working directory (cd).
You can name the directory as you prefer, but in this tutorial, the directory is named efk. This directory will store all of the EFK Stack configuration files in this tutorial.
mkdir -p ~/efk; cd ~/efk4. Now, create a new configuration file (docker-compose.yml) using your preferred editor and populate the following configurations.
The configuration below uses the Docker Compose script v3 and defines all EFK stack containers.
version: "3"

# Define the Docker volume named esdata for the Elasticsearch container.
volumes:
  esdata:

# Deploying three container services (fluentd, elasticsearch, and kibana)
services:
	# Deploy using the custom image automatically be created during the build process.
  fluentd:
    build: ./fluentd
    links: # Sends incoming logs to the elasticsearch container.
      - elasticsearch
    depends_on:
      - elasticsearch
    ports: # Exposes the port 24224 on both TCP and UDP protocol for log aggregation
      - 24224:24224
      - 24224:24224/udp

	# Created using the Docker image elasticsearch:7.17.0
  elasticsearch:
    image: elasticsearch:7.17.0
    expose: # Exposes the default port 9200
      - 9200
    environment:
      - discovery.type=single-node # Runs as a single-node
    volumes: # Stores elasticsearch data locally on the esdata Docker volume
      - esdata:/usr/share/elasticsearch/data

	# Created using the Docker image kibana:7.17.0
  kibana:
    image: kibana:7.17.0
    links: # Links kibana service to the elasticsearch container
      - elasticsearch
    depends_on:
      - elasticsearch
    ports: # Runs kibana service on default port 5601
      - 5601:5601
    environment: # Defined host configuration
      - ELASTICSEARCH_HOSTS=http://elasticsearch:9200
5. Run the below command to create a new directory fluentd and navigate to that directory. The fluentd directory will store fluentd service configurations.
mkdir -p fluentd/; cd fluentd/6. Inside the ~/efk/fluentd directory, create a new Dockerfile using your preferred editor and populate the following configuration.
This configuration creates the fluentd custom image containing the elasticsearch client driver and the fluentd-plugin-elasticsearch.
Ensure to use the same version between elasticsearch and elasticsearch client driver — this tutorial uses version 7.17.0.
# image based on fluentd v1.14-1
FROM fluentd:v1.14-1

# Use root account to use apk
USER root

# below RUN includes plugin as examples elasticsearch is not required# you may customize including plugins as you wish
RUN apk add --no-cache --update --virtual .build-deps \
        sudo build-base ruby-dev \
&& gem uninstall -I elasticsearch \
&& gem install elasticsearch -v 7.17.0 \
&& sudo gem install fluent-plugin-elasticsearch \
&& sudo gem sources --clear-all \
&& apk del .build-deps \
&& rm -rf /tmp/* /var/tmp/* /usr/lib/ruby/gems/*/cache/*.gem

# copy fluentd configuration from host image
COPY ./conf/fluent.conf /fluentd/etc/
# copy binary start file
COPY entrypoint.sh /bin/

RUN chmod +x /bin/entrypoint.sh

USER fluent
7. Next, create another configuration file (entrypoint.sh) using your preferred editor and populate the following configuration. This script executes when the fluentd container service starts.
Below is the starter script for the fluentd container service, which executes the basic command fluentd –config /fluentd/etc/fluentd.conf –plugin /etc/fluentd/plugins.
#!/bin/sh

#source vars if file exists
DEFAULT=/etc/default/fluentd

if [ -r $DEFAULT ]; then
    set -o allexport
    . $DEFAULT
    set +o allexport
fi

# If the user has supplied only arguments append them to `fluentd` commandif [ "${1#-}" != "$1" ]; then
    set -- fluentd "$@"
fi

# If user does not supply config file or plugins, use the defaultif [ "$1" = "fluentd" ]; then
    if ! echo $@ | grep -e ' \-c' -e ' \-\-config' ; then
      set -- "$@" --config /fluentd/etc/${FLUENTD_CONF}
    fi

    if ! echo $@ | grep -e ' \-p' -e ' \-\-plugin' ; then
      set -- "$@" --plugin /fluentd/plugins
    fi
fi

exec "$@"
8. Run the below command to create a new directory conf under the ~/efk/fluentd directory.
mkdir -p conf9. Now, create a fluentd configuration (conf/fluent.conf) using your preferred editor and populate the following configuration.
This configuration allows the fluentd container service to receive log messages, and forward them to the elasticsearch container service.
# bind fluentd on IP 0.0.0.0
# port 24224
<source>
@type forward
port 24224
bind 0.0.0.0
</source>
# sendlog to the elasticsearch
# the host must match to the elasticsearch
# container service
<match *.**>
@type copy
<store>
@type elasticsearch
host elasticsearch
port 9200
logstash_format true
logstash_prefix fluentd
logstash_dateformat %Y%m%d
include_tag_key true
type_name access_log
tag_key @log_name
flush_interval 300s
</store>
<store>
@type stdout
</store>
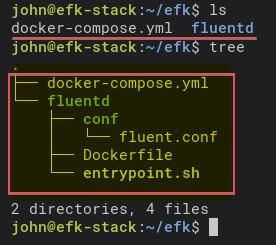
</match>10. Lastly, run the below commands to check the structure of the EFK Stack project directory.
If you don’t have the tree command, install it using the following command: apt install tree -y
# Checking list of files and directory
ls

# Checking directory structure
tree
Below is the complete structure of the EFK Stack project directory.
Deploying EFK Stack with Docker
You’ve now created all configuration files for deploying EFK Stack using Docker and Docker Compose. The next step is to deploy the EFK Stack using the docker-compose command, and the deployment will happen in your project directory (~/efk).
1. First, run the below command to change the working directory to the efk project directory.
cd ~/efk/2. Next, run the docker-compose command below to deploy (up) the EFK Stack log analysis and log monitoring system.
This command automatically downloads Docker images Elasticsearch and Kibana. And the Fluentd Docker image automatically builds using the Dockerfile in the fluentd directory.
Deployment may take some time, depending on the specs of the Docker host.
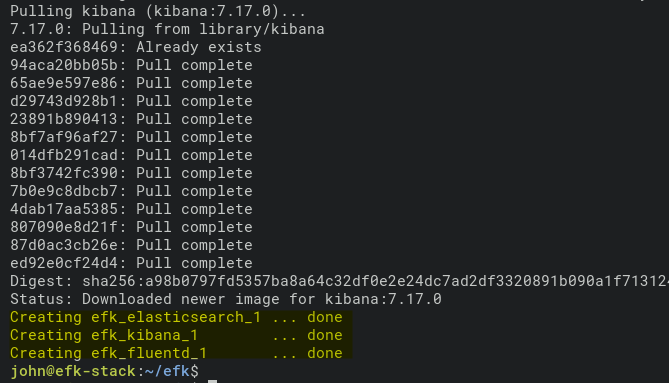
docker-compose up -dBelow is the screenshot of the build process for the Fluentd Docker image.
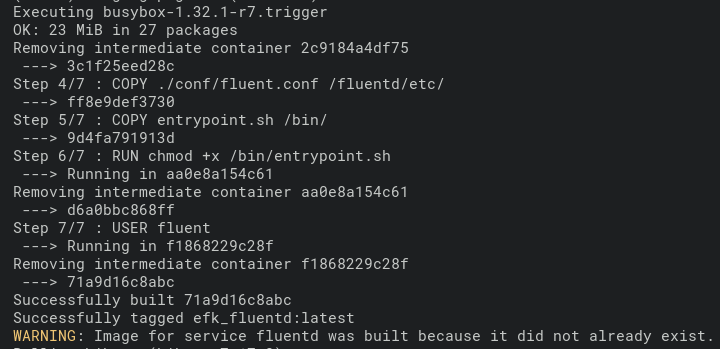
And below is the screenshot showing the deployment is complete, and the Kibana container service is running.
3. Run each command below to check logs of the EFK stack build process. Always run these commands whenever you get an error in the deployment process.
# Checking logs for service fluentd
docker-compose logs fluentd
# Checking logs for service kibana
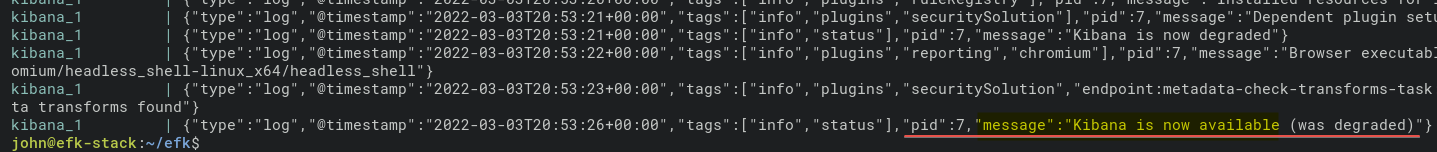
docker-compose logs kibanaBelow is the log message when the fluentd container service is running.

And below is the log for the kibana container.
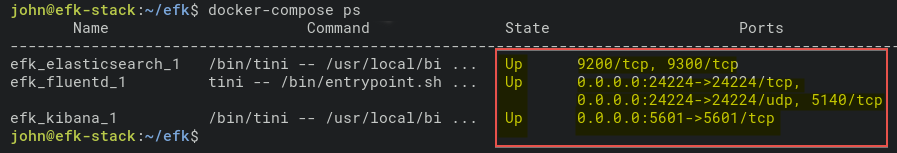
4. Now, run the below command to check all container services’ status (ps).
docker-compose psAs you see below, the EFK Stack container service is Up. Note down the elasticsearch container name (efk_elasticsearch_1) to further verify the container is properly running in the next step.
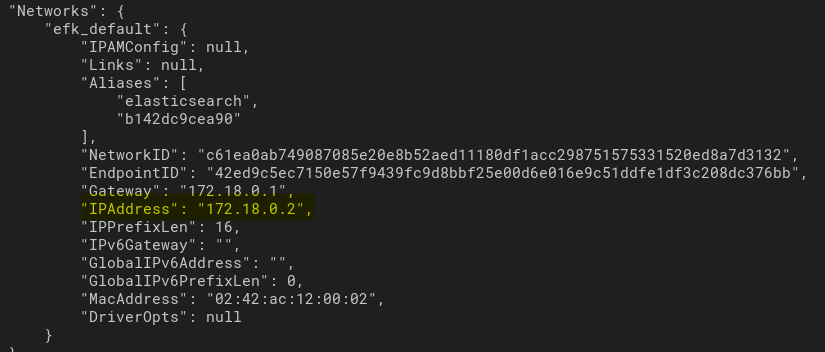
5. Additionally, run the below command to verify the elasticsearch container service. This command prints the detailed settings of the efk_elasticsearch_1 container.
docker inspect efk_elasticsearch_1As you can see below, the efk_elasticsearch_1 container gets an IP address of 172.18.0.2.
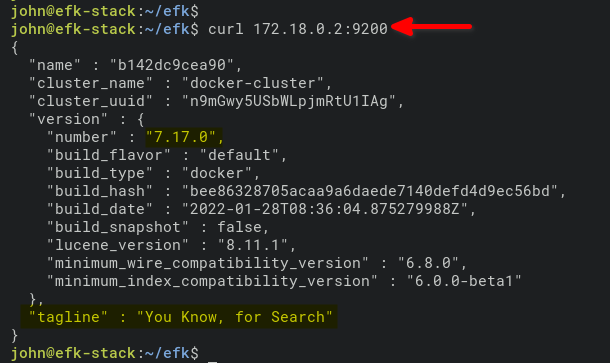
6. Lastly, run the below command to access and verify the elasticsearch container by IP address (172.18.0.2). Port 9200 is the default port for the elasticsearch container.
curl 172.18.0.2:9200You’ll see an output similar to the one below if the elasticsearch container on your machine is running.
Configuring Kibana Index Pattern
Now that you’ve completed deploying the EFK Stack in the Docker environment, you’ll open Kibana from your web browser. You’ll set up an index pattern for log monitoring and analysis.
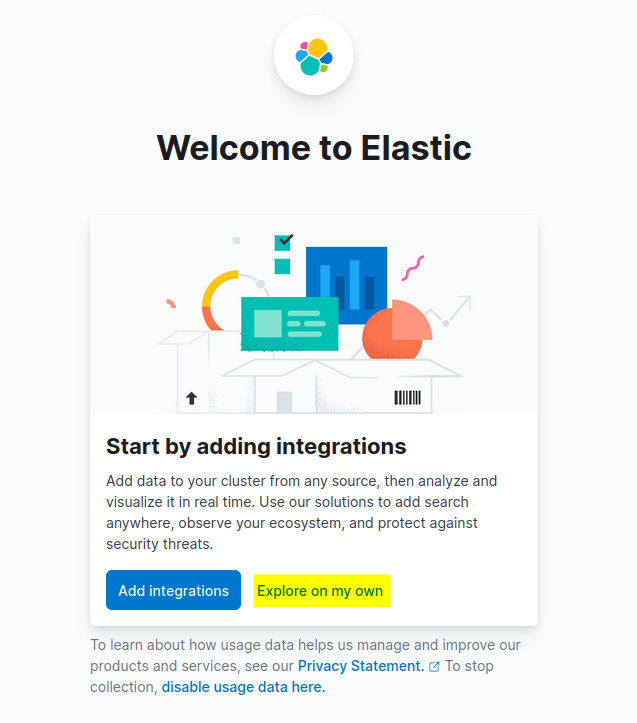
1. Open your favorite web browser and navigate to the server IP address followed by the Kibana service port 5601 (i.e., http://172.16.1.10:5601).
2. Next, click the Explore on my own button on the welcome page below.
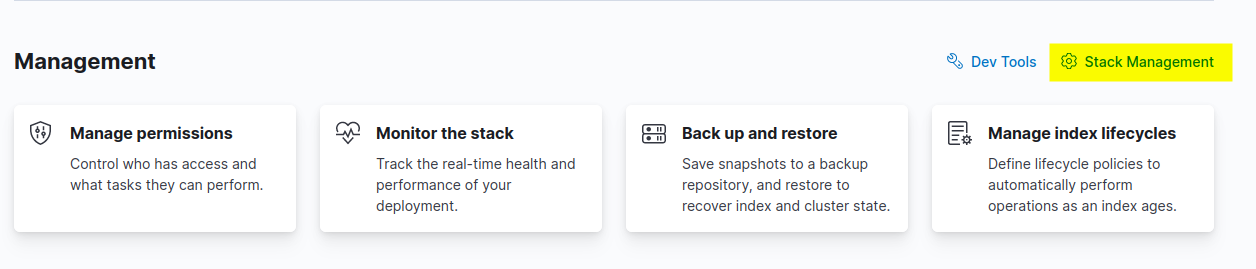
3. Click the Stack Management option to set up the Kibana index pattern in the Management section.
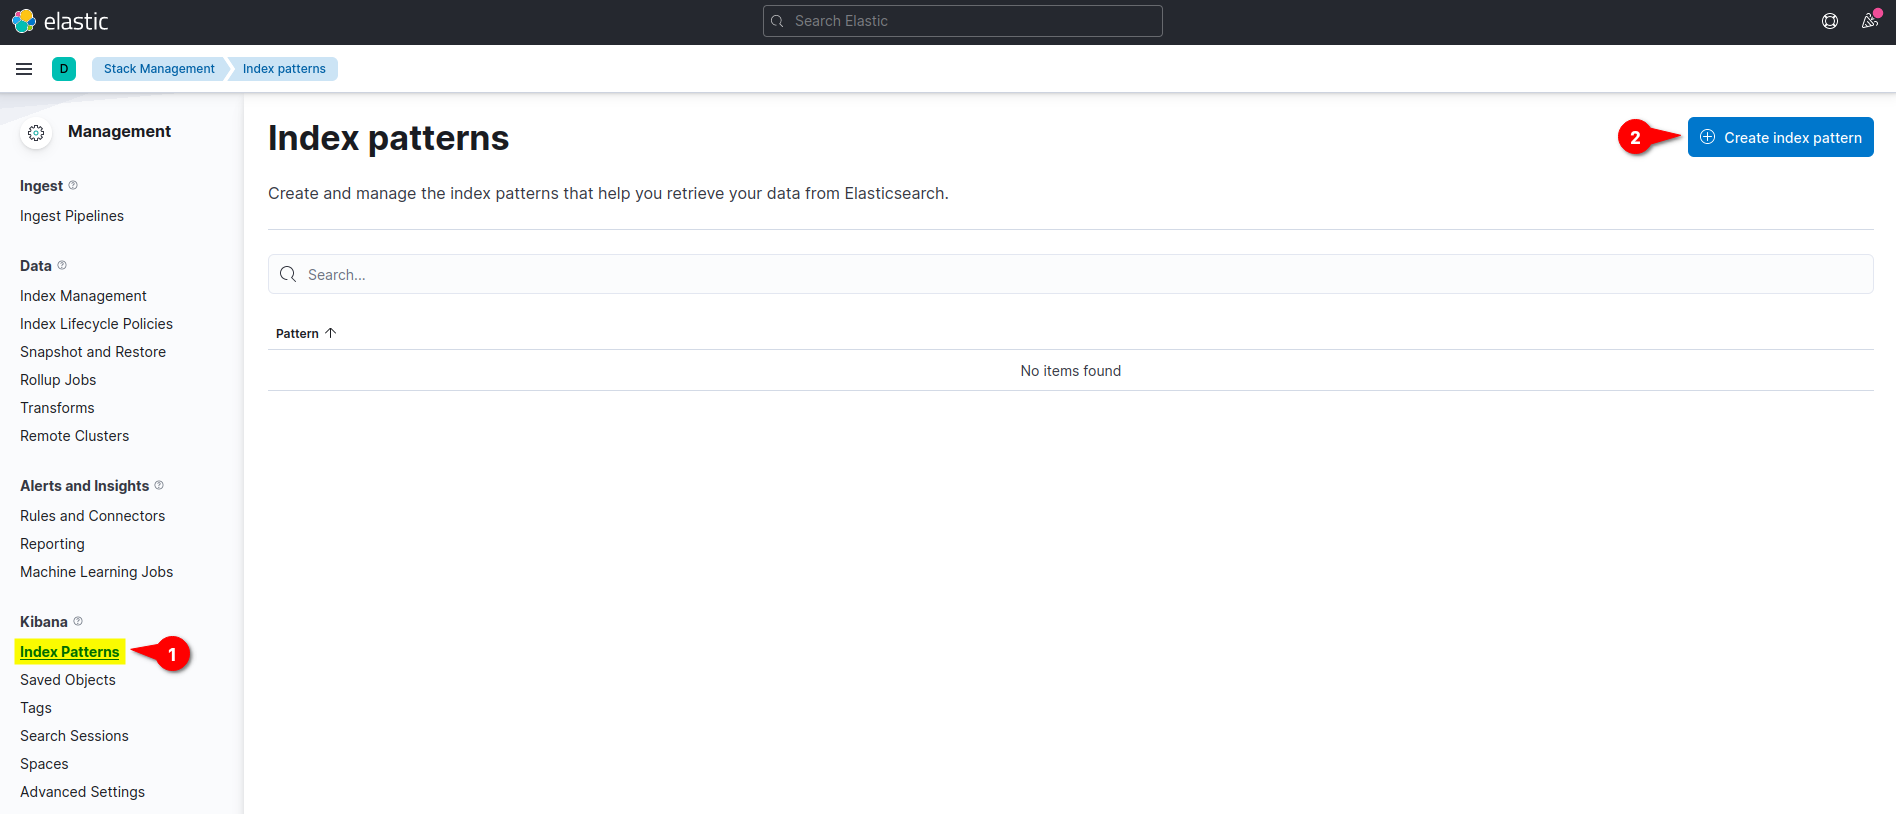
4. On the Kibana left menu section, click menu Index Patterns and click the Create Index Pattern button to create a new index pattern.
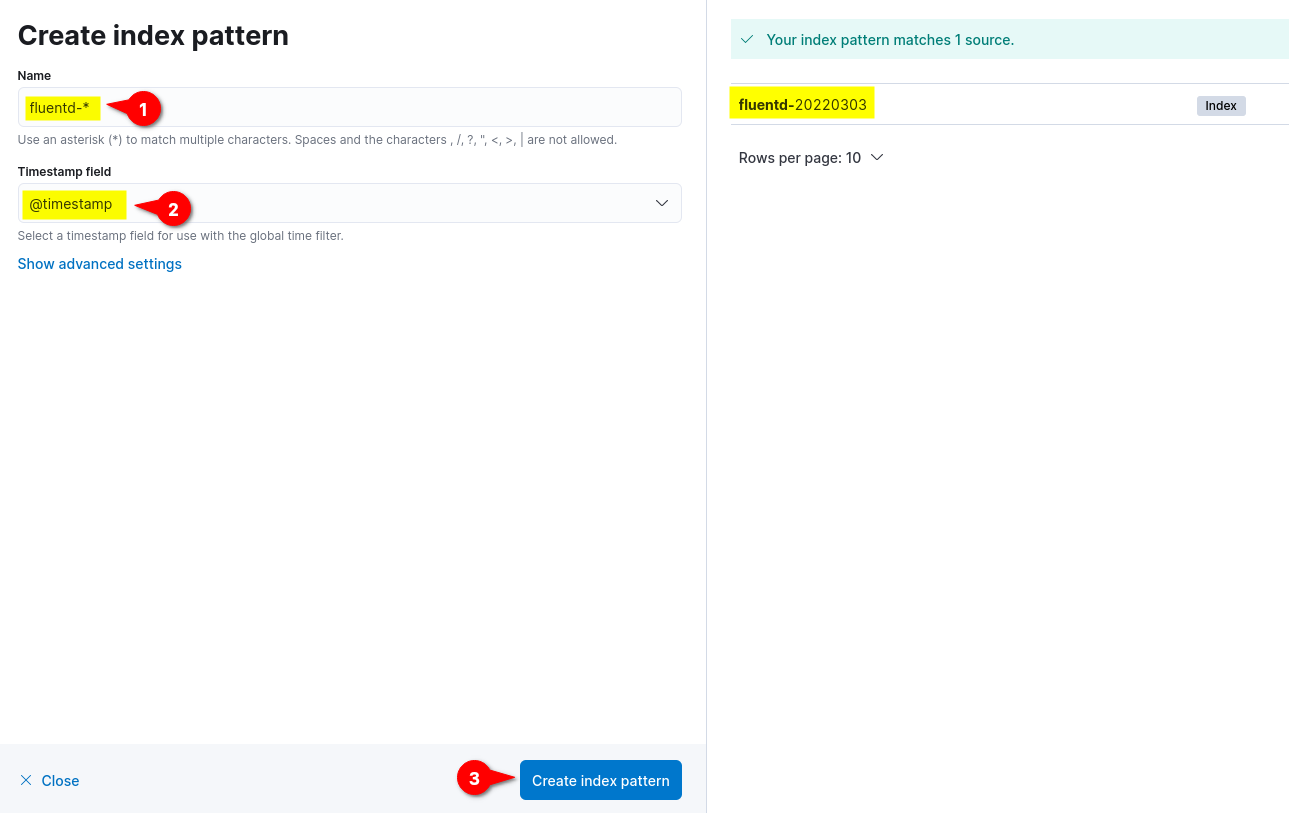
5. Now, input the index pattern Name as fluentd-*, set the Timestamp field to @timestamp, and click the Create index pattern button to confirm the index pattern settings.
On the right side, you can see available index patterns from the fluentd such as fluentd-%Y%m%d. The %Y%m%d date format is based on the fluentd configuration (fluentd.conf).
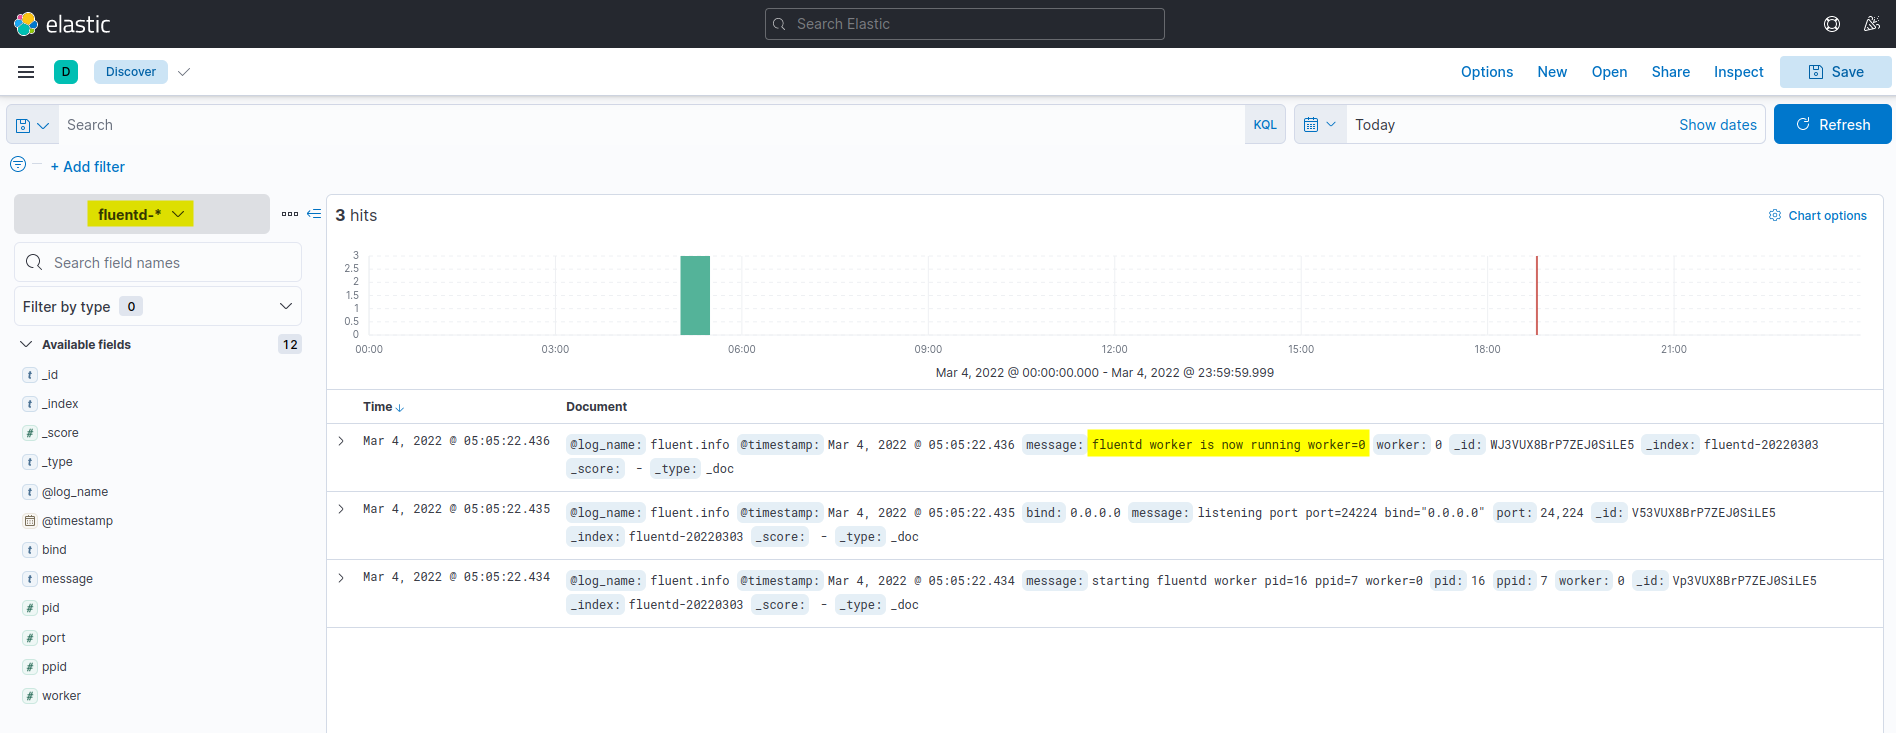
6. Lastly, click on the top left menu (ellipsis), then click the Discover menu to show the logs monitoring.
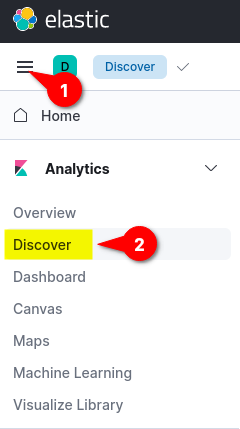
Below is the screenshot of the Kibana log monitoring and analysis dashboard. All listed logs are taken from the Elasticsearch and shipped by the Fluentd log aggregation.
Running a Docker Container with Fluentd Log Driver
After configuring the Kibana index pattern, you’ll run a Docker container with Fluentd log drive, automatically sending logs to the EFK stack.
1. Run the below command to download the NGINX image. The alpine version is smaller than normal images based on Ubuntu, CentOS, or Fedora.
docker pull nginx:alpine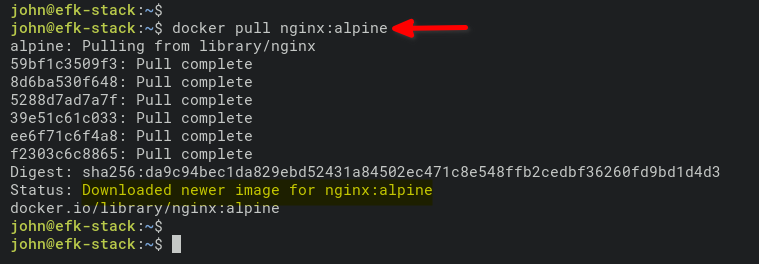
2. Next, run the below command to start a new NGINX container (nginx_container) in detached mode (-d).
The command also sets the log drive to Fluentd (–log-driver=fluentd) and exposes port 8080 on the Docker host machine for the container (nginx_container).
docker run --name nginx_container -d --log-driver=fluentd -p 8080:80 nginx:alpine
3. After running the container, run the docker command below to check all running containers.
docker psYou should see that the nginx_container is Up and running on the host port 8080.

4. Now, run the below command to access the nginx_container and generate access logs.
curl localhost:8080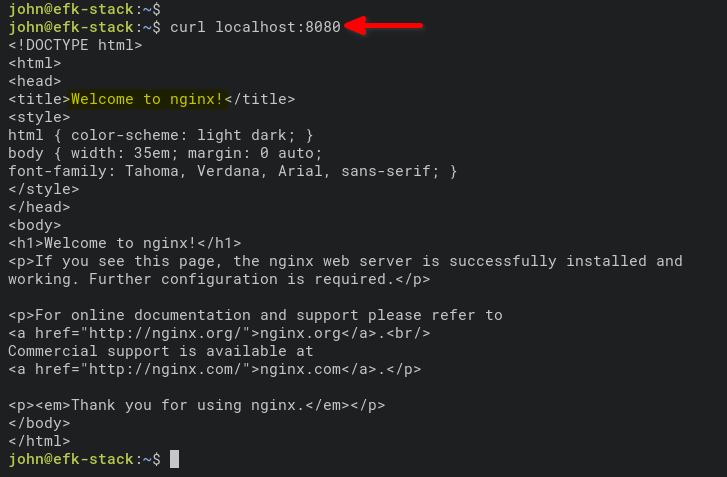
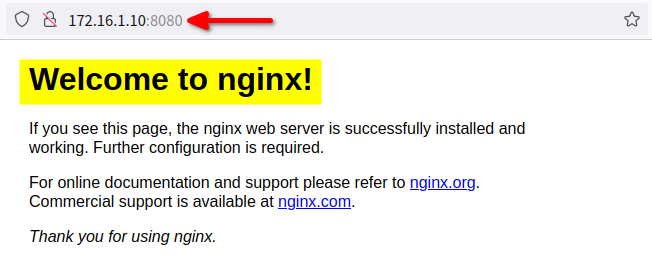
Alternatively, open a new tab on your web browser and type the server IP address followed by port 8080 (i.e., http://172.168.1.10:8080).
If all goes well, you’ll see the default index.html page from the nginx_container.
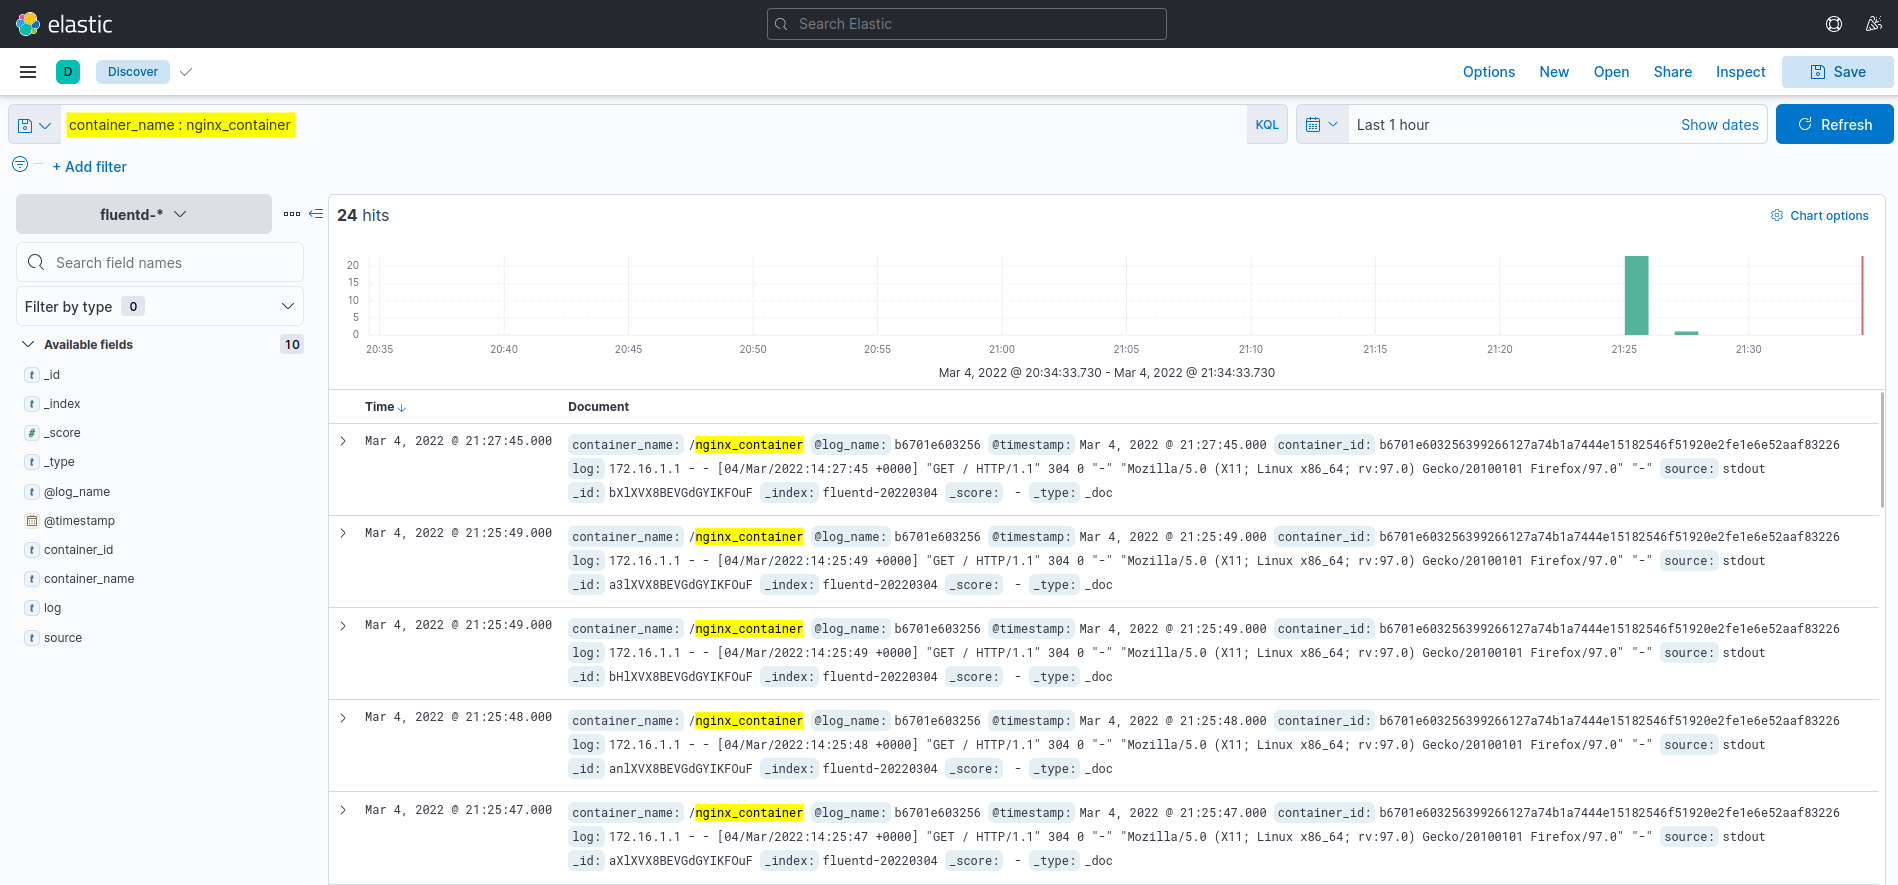
5. Lastly, switch back to the Kibana dashboard, and click the Discover menu on the left side.
Click the container_name : nginx_container query on the KQL (Kibana Query Language) field, and you’ll see logs from the nginx_container, as shown below.
Conclusion
You’ve learned how to deploy EFK Stack (Elasticsearch, Fluentd, and Kibana) throughout this tutorial for log monitoring and analysis using Docker. You’ve also learned how to set up logging for the Docker container using the Fluentd log driver. And at this point, you now have a fully functional log monitoring for applications and services.
For the next stage, you may be interested in using KQL (Kibana Query Language) to visualize log monitoring and analysis.


