

Monitoring is crucial for multi-tier microservices and applications in a data center or cloud infrastructure. One of the most widely used log monitoring tools is Datadog which retrieves logs, events, and metrics from hosts with the Datadog agent.
The Datadog agent is a lightweight software installed on applications hosts that helps push every log, event, trace, and metric produced by your applications and infrastructure using the Datadog APIs.
In this tutorial, you’ll learn how to install the Datadog agent on Ubuntu, monitor the host from your Datadog account online, and create a sample criteria-based monitoring alert.
Prerequisites
This post will be a step-by-step tutorial. To follow along, be sure you have the following:
- You’ll need a computer running at least Ubuntu 14.04.4 LTS. This tutorial uses Ubuntu 20.04.4 LTS.
- You must have installed an Ansible instance on your Ubuntu computer.
- You’ll need a Datadog account and API key.
When you register for a Datadog account, your new account will automatically have a new API key.
Installing Datadog Agent on Ubuntu Machine
Before installing Datadog Agent on Ubuntu, you should first run through a few prerequisite tasks to ensure the installation goes smoothly.
To get started, open your favorite SSH client, connect to an Ubuntu machine and follow along.
- First, update your Ubuntu package repository list by running the
apt updatecommand.
sudo apt update -y2. Now, run the apt install to install the Datadog agent dependency packages transport-https and curl. You’ll need these packages to download the required Datadog agent packages later.
# Installing the transport-https and curl package on each ubuntu system
sudo apt-get install -y apt-transport-https curl gnupg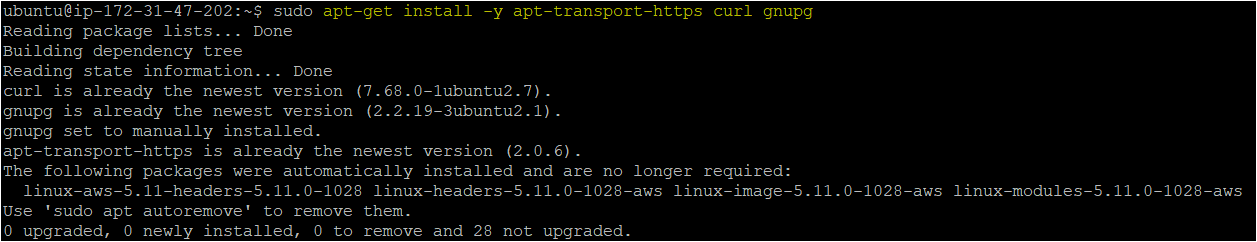
3. Next, configure and set up the Datadog repository by creating a Datadog archive keyring. Afterward, run curl to download and add the required GPG security key with apt-key to authenticate to the Datadog package repository later.
# Setting up the Datadog repository and creating the archive keyring
sudo sh -c "echo 'deb [signed-by=/usr/share/keyrings/datadog-archive-keyring.gpg] https://apt.datadoghq.com/ stable 7' > /etc/apt/sources.list.d/datadog.list"
sudo touch /usr/share/keyrings/datadog-archive-keyring.gpg
sudo chmod a+r /usr/share/keyrings/datadog-archive-keyring.gpg

# Adding the Datadog GPG Key on each ubuntu system
curl https://keys.datadoghq.com/DATADOG_APT_KEY_CURRENT.public | sudo gpg --no-default-keyring --keyring /usr/share/keyrings/datadog-archive-keyring.gpg --import --batch
curl https://keys.datadoghq.com/DATADOG_APT_KEY_382E94DE.public | sudo gpg --no-default-keyring --keyring /usr/share/keyrings/datadog-archive-keyring.gpg --import --batch
curl https://keys.datadoghq.com/DATADOG_APT_KEY_F14F620E.public | sudo gpg --no-default-keyring --keyring /usr/share/keyrings/datadog-archive-keyring.gpg --import --batch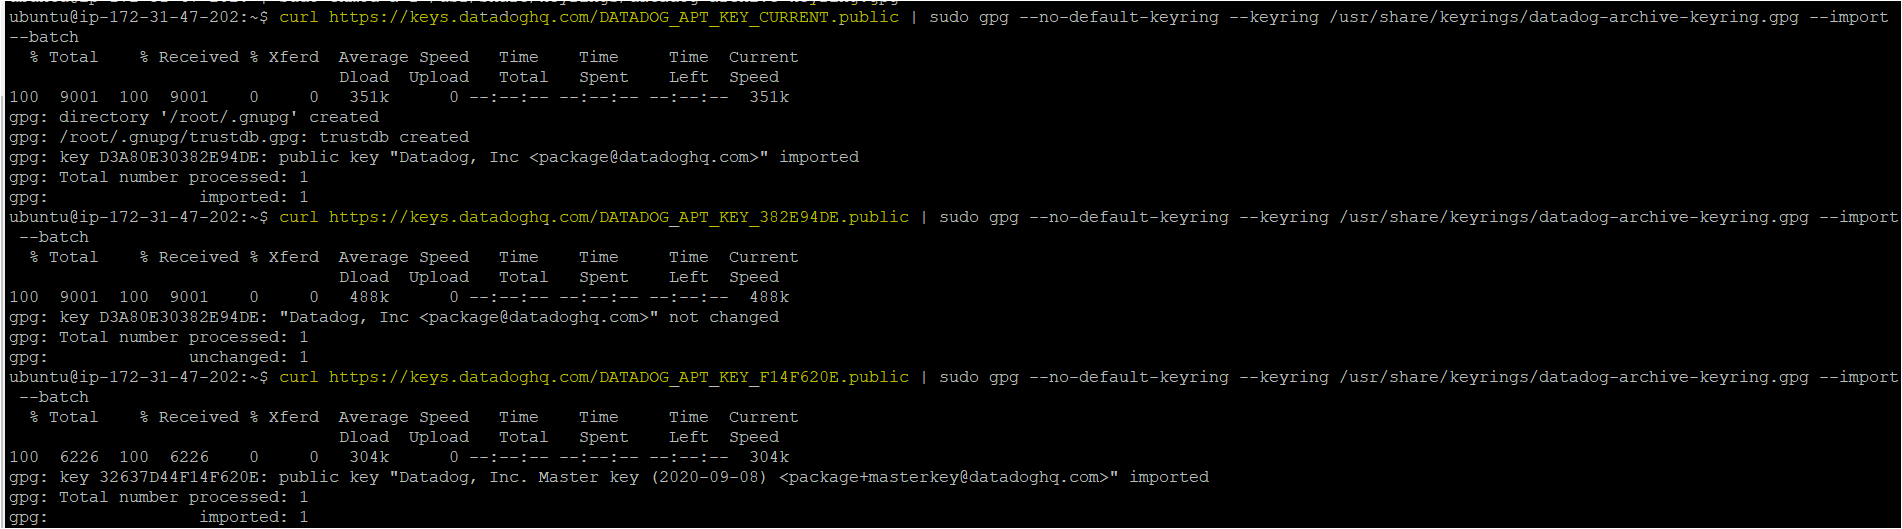
4. Again run the sudo apt update command to force apt to read the new package repository list and ensure all of the latest packages are available for installation.
5. Now, run the command below to install the Datadog agent package on your Ubuntu machine.
sudo apt-get install datadog-agent datadog-signing-keys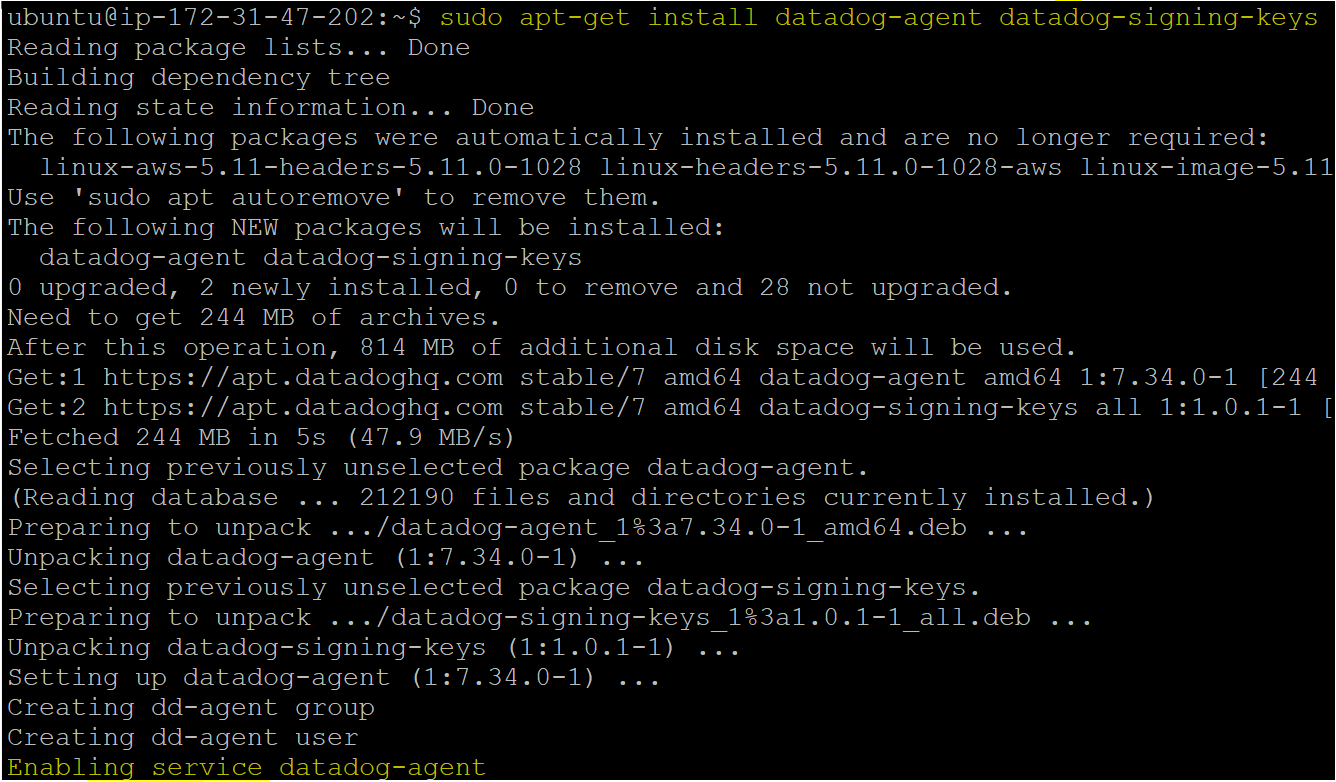
6. Further, configure the Datadog main configuration file (datadog.yaml), which came with the Datadog agent installation.
The datadog.yaml file allows you to connect and associate your host’s data to the Datadog site using the Datadog API key. The below command adds your Datadog API key to datadog.yaml. Before running the below command, make sure to replace <API-KEY> with your 32-character Datadog API key value.
The API keys will be different for every Datadog account, so make sure to replace this tutorial API Keys with yours.
sudo sh -c "sed 's/api_key:.*/api_key: <API-KEY>/' /etc/datadog-agent/datadog.yaml.example > /etc/datadog-agent/datadog.yaml"
sudo sh -c "sed -i 's/# site:.*/site: datadoghq.com/' /etc/datadog-agent/datadog.yaml"
sudo sh -c "chown dd-agent:dd-agent /etc/datadog-agent/datadog.yaml && chmod 640 /etc/datadog-agent/datadog.yaml"
7. Finally, start the Datadog agent with the below command on your ubuntu machine.
sudo systemctl start datadog-agent.service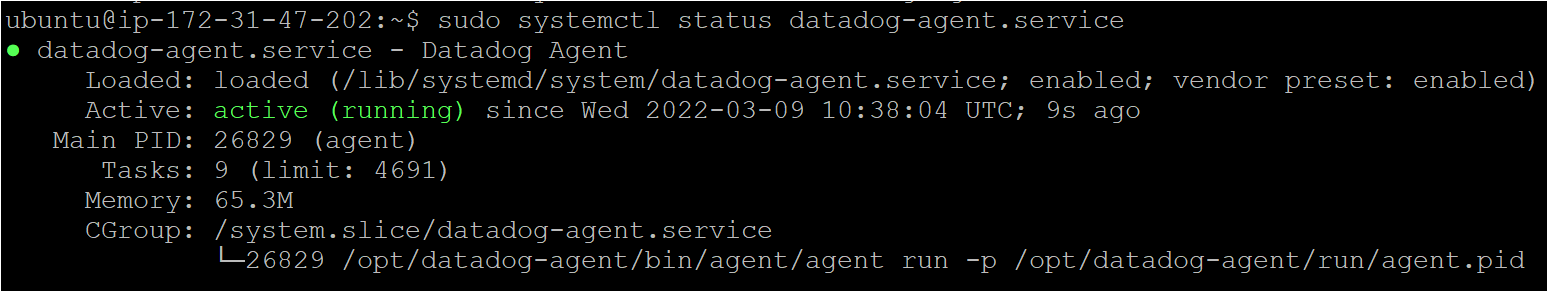
To verify if the Datadog agent has started, run the below datadog-agent command.
sudo datadog-agent status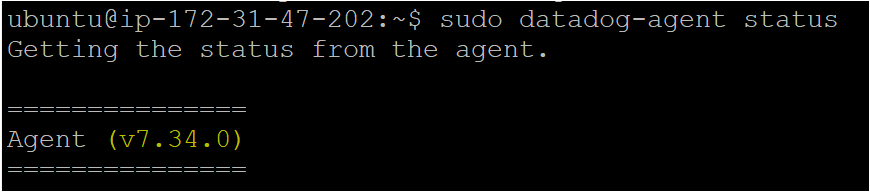
Monitoring the Metrics in Datadog dashboard
You’ve successfully installed the Datadog agent on an Ubuntu machine. What next? There are many things you can do in the Datadog dashboard, such as monitoring the metrics of your machine where you recently installed the agent, configuring the metrics, and creating a real-time monitoring dashboard.
But in this section, you’ll first learn to monitor your Ubuntu machine’s metrics quickly. Assuming you have Datadog’s website opened.
1. First, open a web browser, navigate to the Datadog website, and log in with your account.
2. Click Metrics ➔ Explorer on the sidebar, which will open the Metrics Explorer. On the Metrics Explorer, click inside the Graph and click datadog.agent.running.
As you can see in the below image, Datadog metrics showed that the agent has been running for the last 4 hours.
3. To check the summary of all metrics of the Ubuntu machine where you previously installed the agent, click Metrics → Summary on the sidebar.
As you can see, the below snapshot shows various metrics such as:
datadog.dogstatsd.client.metric_dropped_on_receive
datadog.dogstatsd.client.packets_sent
datadog.trace_agent.cpu_percent
Click each metric to drill down each metric’s data.
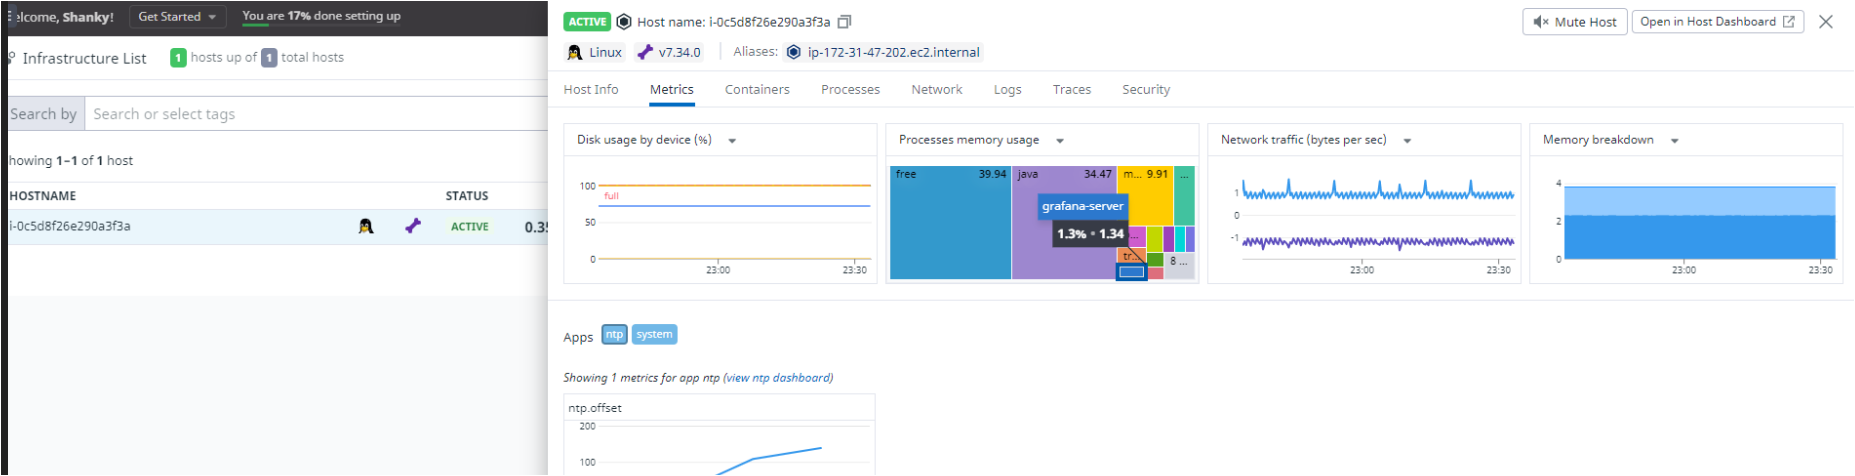
4. Finally, navigate to the Infrastructure section from the sidebar. On the Infrastructure page, you’ll find all the information regarding your host’s infrastructure, including running processes, installed software, memory consumption, and so much more.
For example, the screenshot below shows the grafana-server server process running on the host and its memory and disk consumption.
Creating Monitoring Alerts
Nowadays, monitoring alerts is crucial for any organization running applications or microservices. Suppose you’ve decided to spin up some new Linux VMs or Kubernetes cluster host, and if any of your nodes go offline or if the CPU spikes, then you need a way to notify your team.
But, in this example, you’ll create a monitoring alert that sends an email notification if any of your Datadog agent hosts are offline.
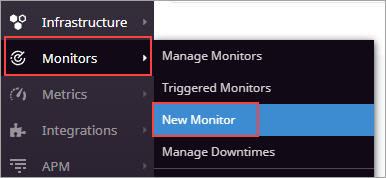
1. On the Datadog website, click Monitors → New Monitor on the left sidebar.
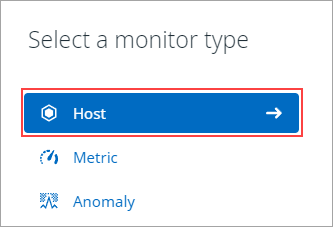
2. Click Host as the monitor type.
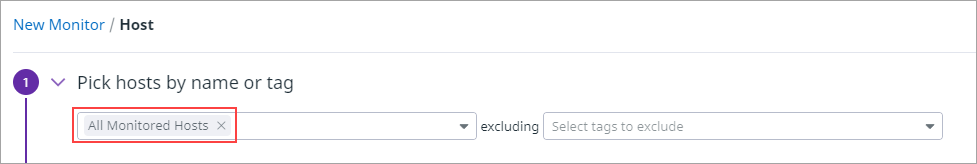
3. Select All Monitored Hosts from the dropdown box on the Pick hosts by name or tag section.
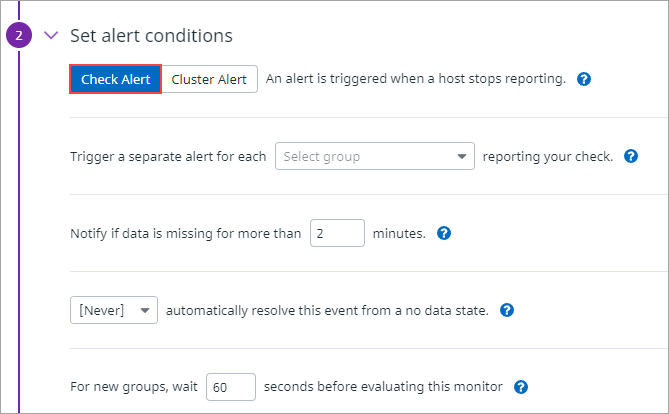
4. On the Set alert conditions, leave the Check Alert selection. Doing so means that the monitor tracks if any host stop reporting to Datadog at any time. Leave the other options unchanged.
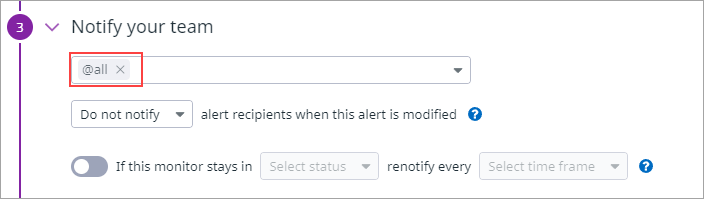
5. Under Notify your team, select @all from the dropdown. This option means to notify every user you added to your Datadog organization.
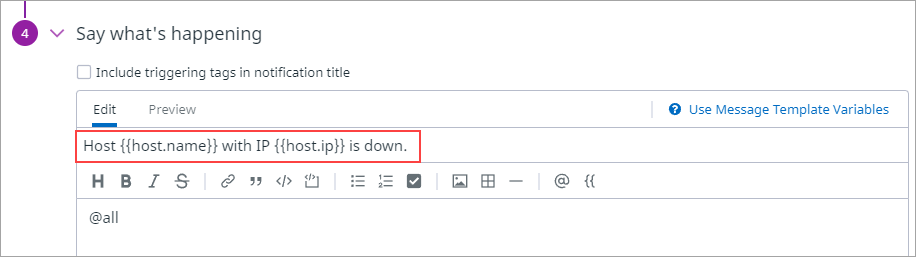
6. Under the Say what’s happening section, compose the message title as below. This title includes {{host.name}} and {{host.ip}}, which are the variables for the affected host’s hostname and IP address.
Host {{host.name}} with IP {{host.ip}} is down.Hover your mouse cursor over the Use Message Template Variables link to see every available variable.
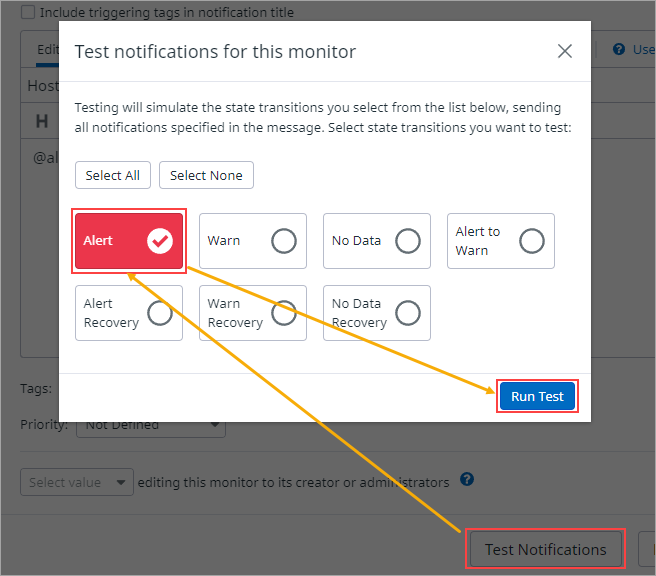
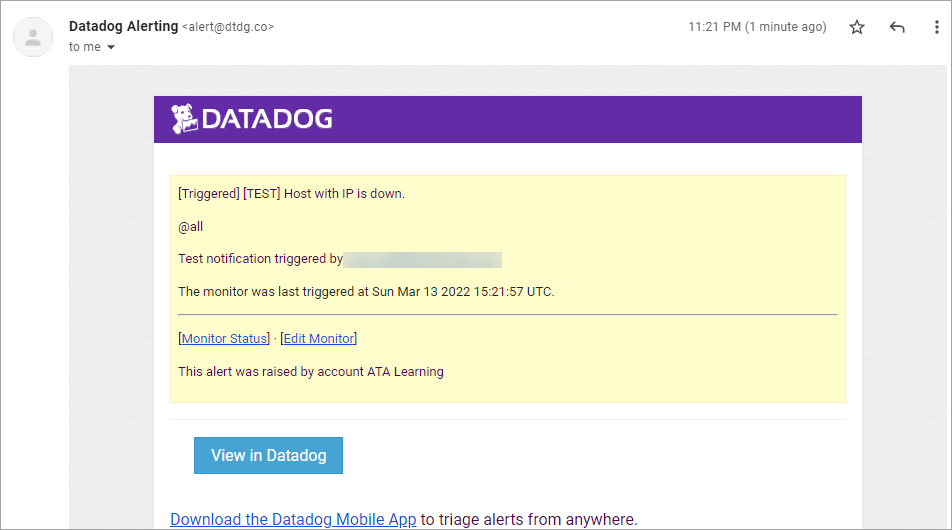
7. Now, click on the Test Notifications button to run a monitoring alert simulation and ensure that the monitor works. Select Alert and click Run Test.
8. Now, check your inbox (the email address you registered with your Datadog account), and you should find an email similar to the one below.
9. Finally, go back to the Datadog monitor page and click Save to save the new monitoring alert.
And that’s how you create a monitoring alert in Datadog. You can now try creating different monitor types, such as monitoring metrics and audit logs.
Integrating Datadog Agent with Third-Party Tools and Services (High-Level Example)
So far, you have learned how to check your host’s metrics and create monitors, which is cool, but that’s not the end of Datadog’s awesomeness. If you work with third-party tools like Ansible or Kubernetes, you’ll be glad to know that Datadog can integrate with them and more.
This section shows you an example of how to integrate Datadog with Amazon EKS.
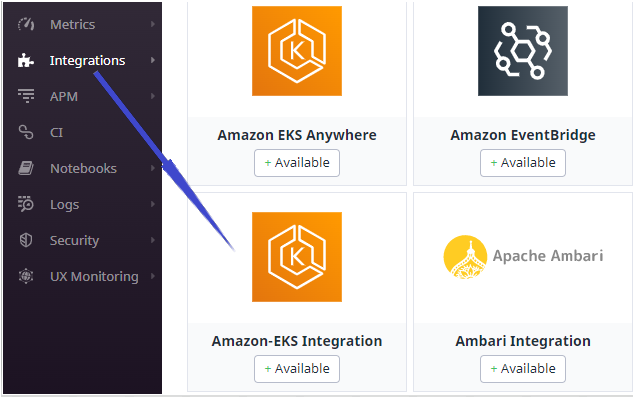
1. Click Integrations on the sidebar and again click on Integrations.
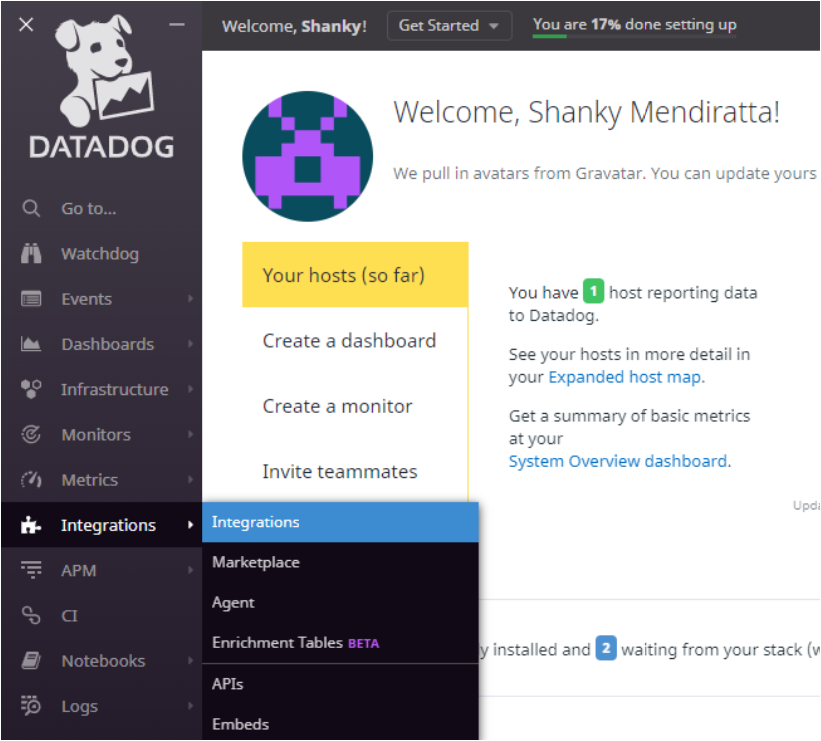
You should see a couple of available integrations that you can install.
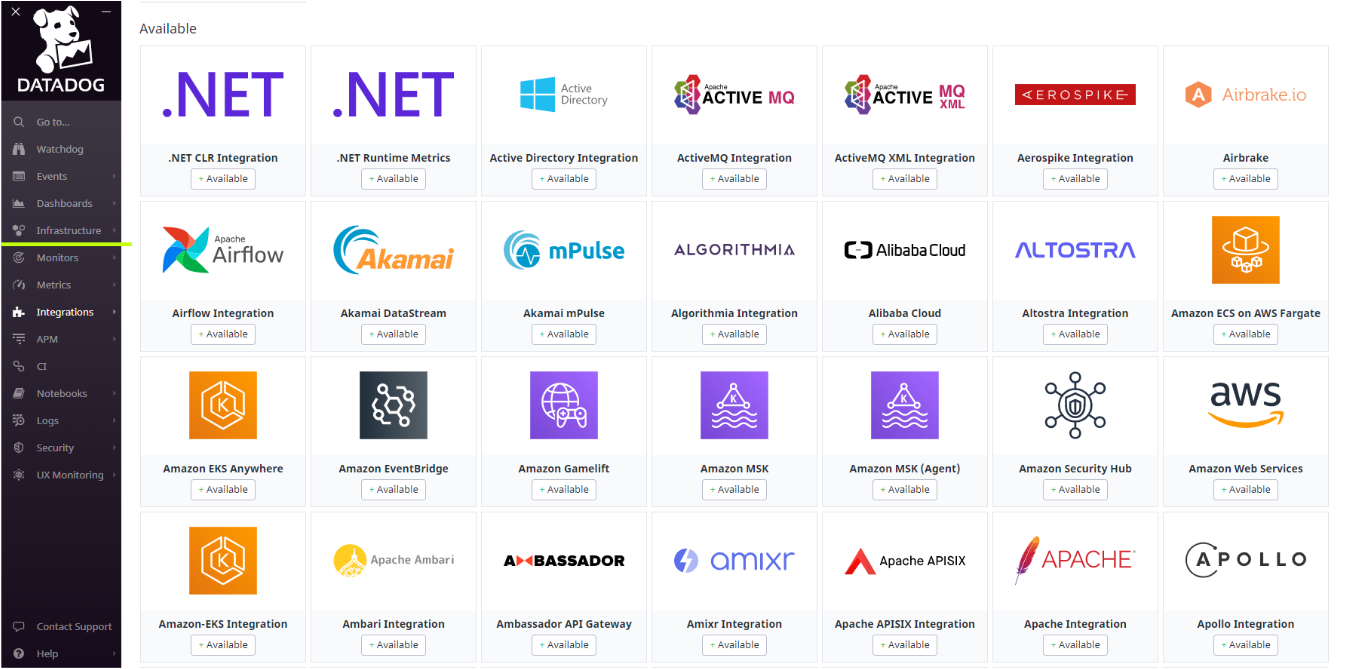
2. In this example, install the Amazon EKS Integration with Datadog to manage the Kubernetes service on AWS Cloud.
Click on the Integrations → Amazon EKS Integration, which is available for installation.
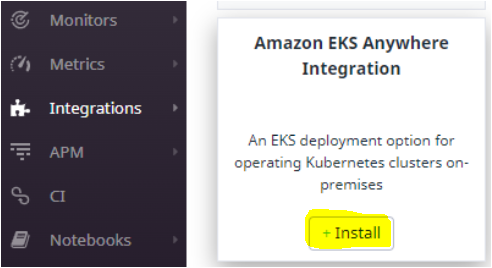
3. When you see the option to install the plugin, as shown below, click Install.
After you install the plugin, you will see a list of all the configuration steps you can perform so that Datadog can monitor your Kubernetes and its related components.
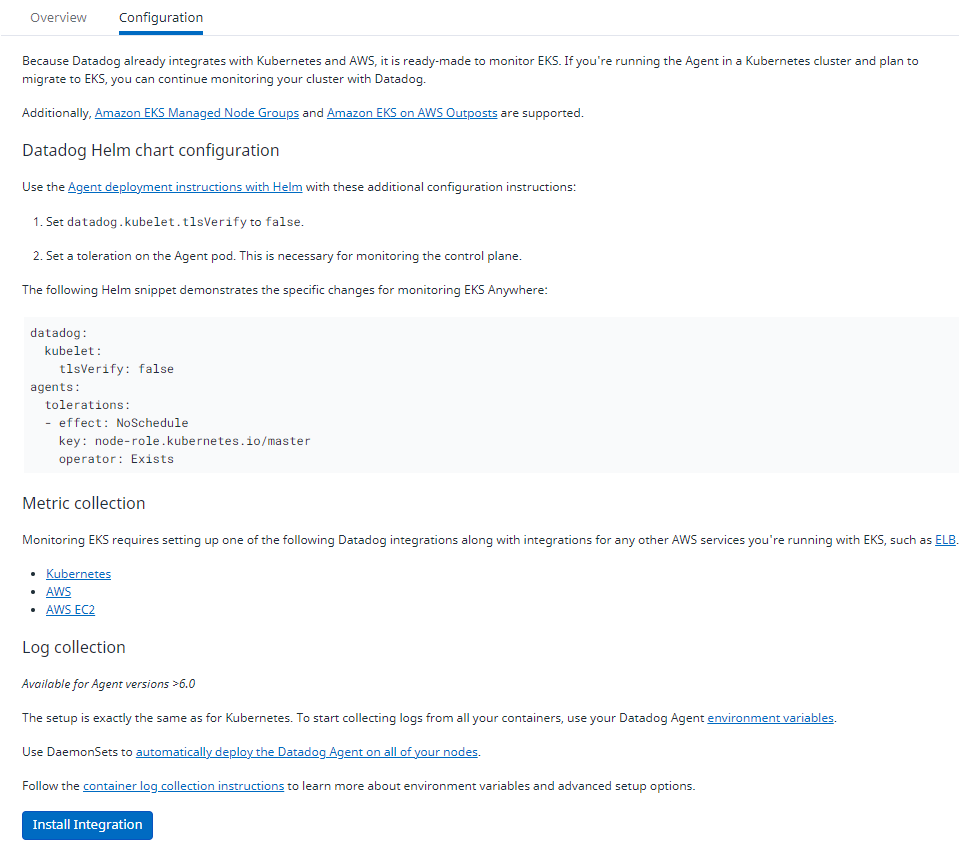
If you want to list all the configuration steps to configure EKS and Kubernetes on Datadog, you can find them here.
Conclusion
In this tutorial, you’ve learned how to set up a Datadog agent and monitor the data stored in the Datadog agent host. You also learned to monitor the metrics in various visualizations in different panels within the Datadog Dashboard.
You now have a fully functional Datadog Dashboard and agent installed in your machine. So go wild and test out everything you can with the Datadog agent.
After all, you have 14 days to use Datadog for free before. Perhaps by then, you can decide whether upgrading to a paid Datadog account is worth the investment. Good luck!


