


As your AWS cloud Infrastructure grows, monitoring dozens of AWS services becomes challenging and tedious, and you certainly need to monitor AWS resources. Luckily, the AWS CloudWatch service is an excellent tool for monitoring a vast AWS infrastructure.
Not a reader? Watch this related video tutorial!AWS CloudWatch is a service for monitoring the resource utilization, application performance, and operational health of the AWS infrastructure.
In this tutorial, you will learn how you can provision AWS CloudWatch and its components in AWS Cloud using the Terraform CloudWatch Module.
Prerequisites
This post will be a step-by-step tutorial. If you’d like to follow along, ensure you have the following in place:
- A code editor – Even though you can use any text editor to work with Terraform configuration files, consider using Visual Studio (VS) Code as it understands the HCL Terraform language well.
- Terraform – This tutorial uses Terraform v1.1.5 running on Ubuntu 20.04 LTS, but any operating system with Terraform should work.
- IAM role attached on Ubuntu 20.04 LTS with full privileges to create AWS Elastic File System (EFS) and related components.
- An email account for receiving the monitoring email notifications.
Building the Configuration for a Terraform CloudWatch Module
Terraform is an infrastructure as code tool that allows you to build, change, and version infrastructure via a configuration. Since you’ll be using the Terraform CloudWatch module to create CloudWatch metrics and alarms in AWS Cloud, you’ll first have to build a Terraform configuration for AWS CloudWatch. Start building the Terraform configuration as follows.
1. Log in to the Ubuntu machine with your favorite SSH client.
2. Next, run the commands below to create a working directory called ~/terraform-cloudwatch-demo. This folder will contain all of the configuration files you’ll be working on in this tutorial.
mkdir ~/terraform-cloudwatch-demo
cd ~/terraform-cloudwatch-demo
3. Open your preferred code editor and create a file called main.tf inside the ~/terraform-cloudwatch-demo directory.
Copy/paste the following configuration to the main.tf file, and save the changes. This main.tf file is the Terraform configuration for the AWS CloudWatch.
The below Terraform configuration creates the following resources:
- CloudWatch Dashboard: The CloudWatch Dashboard shows all the metrics of all the Running AWS EC2 instances based on CPU utilization.
- CloudWatch metrics alarm: First, you need to set the metric on the AWS resource, such as a CPU threshold of 70 percent, and then a metric alarm keeps an eye on the CloudWatch metric and generates the alert based on the same.
- CloudWatch log group: In AWS CloudWatch, the Log groups contain the log streams, which contain the same monitoring, and access control settings. A log stream is a sequence of log events that share the same source, and a log group is a group of log streams that share the same retention.
- A composite alarm: Includes a rule expression that considers the alarm states of other alarms you have created. The composite alarm goes into ALARM state only if the resource thresholds meet all the rules’ conditions.
Note: The Terraform configuration below is specific to this tutorial and to the AWS subscription it uses. Make sure to customize the configuration as needed or if you encounter errors.
resource "aws_cloudwatch_dashboard" "EC2_Dashboard" {
  dashboard_name = "EC2-Dashboard"

  dashboard_body = <<EOF
{
    "widgets": [
        {
            "type": "explorer",
            "width": 24,
            "height": 15,
            "x": 0,
            "y": 0,
            "properties": {
                "metrics": [
                    {
                        "metricName": "CPUUtilization",
                        "resourceType": "AWS::EC2::Instance",
                        "stat": "Maximum"
                    }
                ],
                "aggregateBy": {
                    "key": "InstanceType",
                    "func": "MAX"
                },
                "labels": [
                    {
                        "key": "State",
                        "value": "running"
                    }
                ],
                "widgetOptions": {
                    "legend": {
                        "position": "bottom"
                    },
                    "view": "timeSeries",
                    "rowsPerPage": 8,
                    "widgetsPerRow": 2
                },
                "period": 60,
                "title": "Running EC2 Instances CPUUtilization"
            }
        }
    ]
}
EOF
}

resource "aws_cloudwatch_composite_alarm" "EC2" {
  alarm_description = "Composite alarm that monitors CPUUtilization "
  alarm_name        = "EC2_Composite_Alarm"
  alarm_actions = [aws_sns_topic.EC2_topic.arn]

  alarm_rule = "ALARM(${aws_cloudwatch_metric_alarm.EC2_CPU_Usage_Alarm.alarm_name}) OR ALARM(${aws_cloudwatch_metric_alarm.EBS_WriteOperations.alarm_name})"

  depends_on = [
    aws_cloudwatch_metric_alarm.EC2_CPU_Usage_Alarm,
    aws_sns_topic.EC2_topic,
    aws_sns_topic_subscription.EC2_Subscription
  ]
i}


# Creating the AWS CLoudwatch Alarm that will autoscale the AWS EC2 instance based on CPU utilization.
resource "aws_cloudwatch_metric_alarm" "EC2_CPU_Usage_Alarm" {
# defining the name of AWS cloudwatch alarm
  alarm_name          = "EC2_CPU_Usage_Alarm"
  comparison_operator = "GreaterThanOrEqualToThreshold"
  evaluation_periods = "2"
# Defining the metric_name according to which scaling will happen (based on CPU)
  metric_name = "CPUUtilization"
# The namespace for the alarm's associated metric
  namespace = "AWS/EC2"
# After AWS Cloudwatch Alarm is triggered, it will wait for 60 seconds and then autoscales
  period = "60"
  statistic = "Average"
# CPU Utilization threshold is set to 10 percent
  threshold = "70"
alarm_description     = "This metric monitors ec2 cpu utilization exceeding 70%"


resource "aws_cloudwatch_log_group" "ebs_log_group" {
  name = "ebs_log_group"
  retention_in_days = 30
}


resource "aws_cloudwatch_log_stream" "ebs_log_stream" {
  name           = "ebs_log_stream"
  log_group_name = aws_cloudwatch_log_group.ebs_log_group.name
}


resource "aws_sns_topic" "EC2_topic" {
  name = "EC2_topic"
}

resource "aws_sns_topic_subscription" "EC2_Subscription" {
  topic_arn = aws_sns_topic.EC2_topic.arn
  protocol  = "email"
  endpoint  = "[email protected]"

  depends_on = [
    aws_sns_topic.EC2_topic
  ]
}
4. Create another file in ~/terraform-cloudwatch-demo named provider.tf, and populate the file with the content below.
The provider.tf file contains Terraform providers as Terraform depends on the plugins to connect or interact with cloud providers or API services.
Including all configuration values in a single configuration file is possible. But to keep things clear for developers and admins, breaking the logic and variables into separate files is preferable.
# Declaring the AWS Provider
provider "aws" {
   region = "us-east-1"
 }
The tutorial creates resources in the us-east-1 region. But a list of regions that AWS support is also available.
5. Finally, run the tree command to verify all required files in the ~/terraform-cloudwatch-demo directory, as shown below.
tree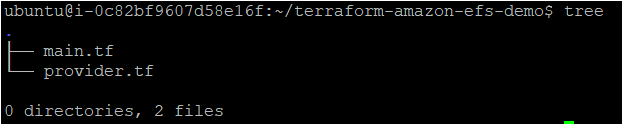
Creating the Monitors and Log Groups with a Terraform CloudWatch Module
Now that you have the Terraform configuration file and variables files set up, it’s time to initiate Terraform and create the AWS CloudWatch and its components.
To provision the AWS CloudWatch components such as Cloudwatch Dashboard, log group, and metrics alarm, like all other Terraform configurations, Terraform uses three commands in sequence (terraform init, terraform plan, and terraform apply).
If the Terraform configuration files you created are not correctly formatted, you can run the terraform fmt command to fix them.
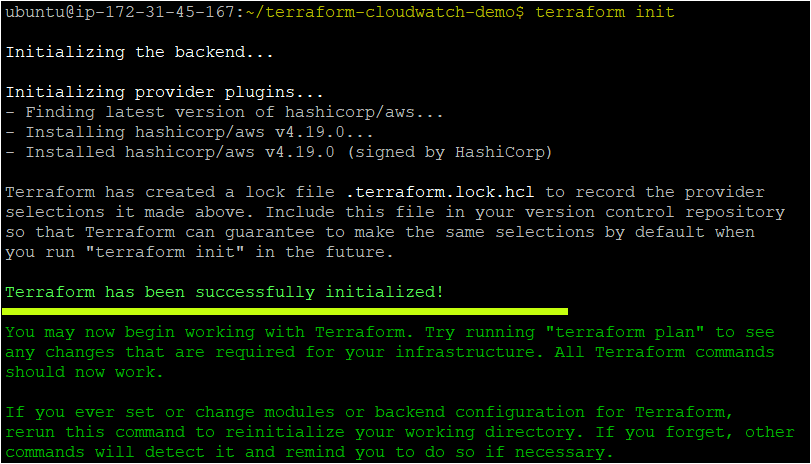
1. Run the terraform init command in the ~/terraform-backend-demo directory to initialize the plugins and providers required to work with resources.
terraform initIf all goes well, you’ll see the message that says Terraform has been successfully initialized in the output, as shown below.
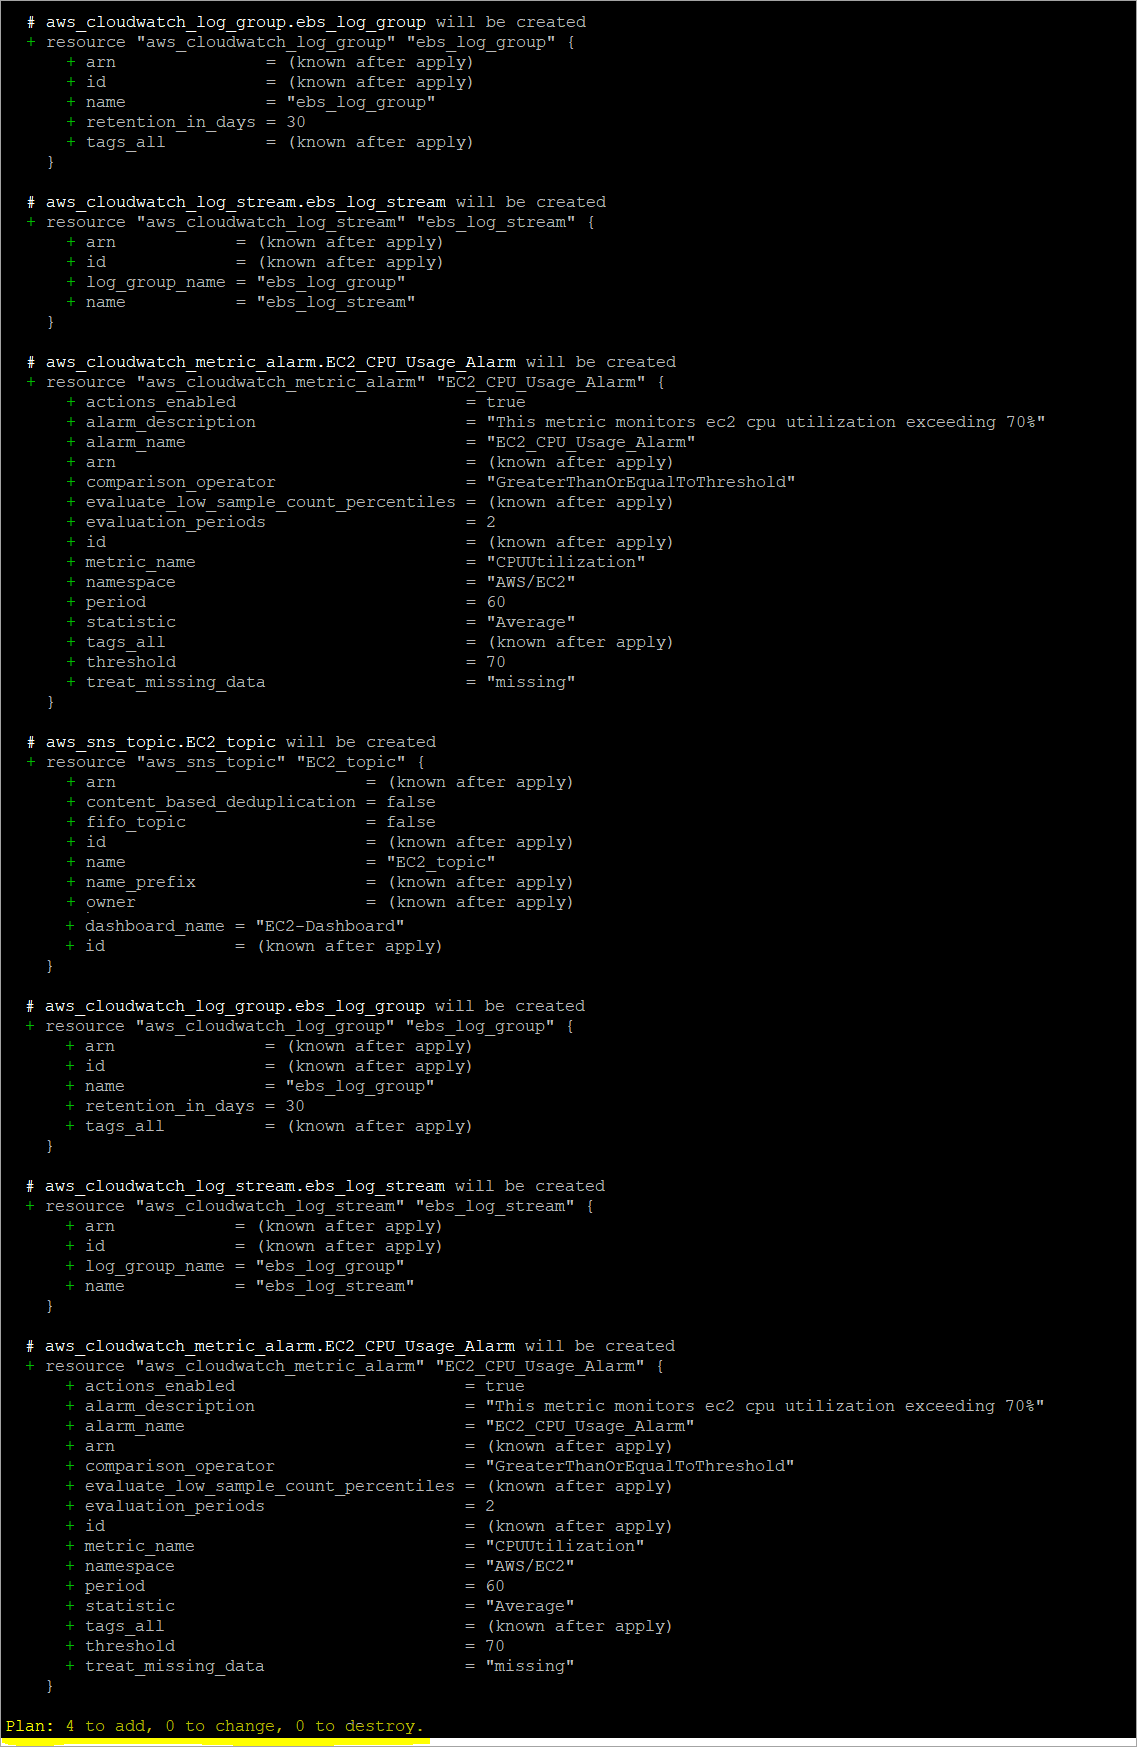
2. Next, run the terraform plan command to ensure your syntax of configuration files is correct and gives you a blueprint of resources you will provision in your infrastructure.
terraform planOnce the command completes, you’ll see a message like Plan: “X” to add, “Y” to change, or “Z” to destroy in the output. Below, the Plan shows 4 to add as four resources to create.
3. Finally, run the terraform and apply the command to provision the AWS CloudWatch and related components using each configuration (*.tf) in the current directory.
The –auto-approve parameter automatically accepts all prompts while running the command.
terraform apply --auto-approve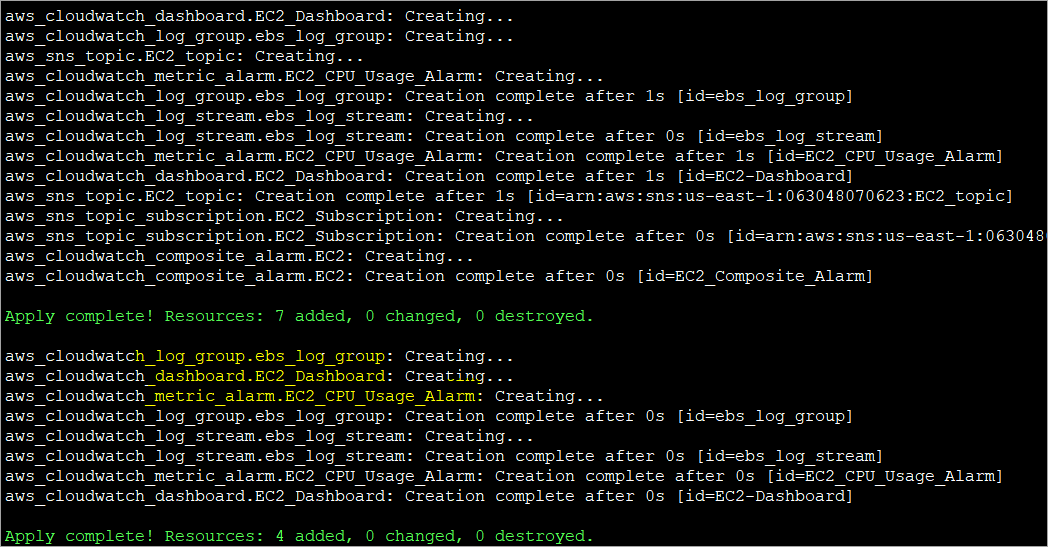
Monitoring EC2 and Other AWS Services Using CloudWatch Alarm
You should have created the AWS CloudWatch and related components with Terraform. But how do you know they exist in your AWS cloud? Verify the AWS CloudWatch service and components by manually checking the AWS Management Console.
1. Open your favorite web browser and log in to the AWS Management Console.
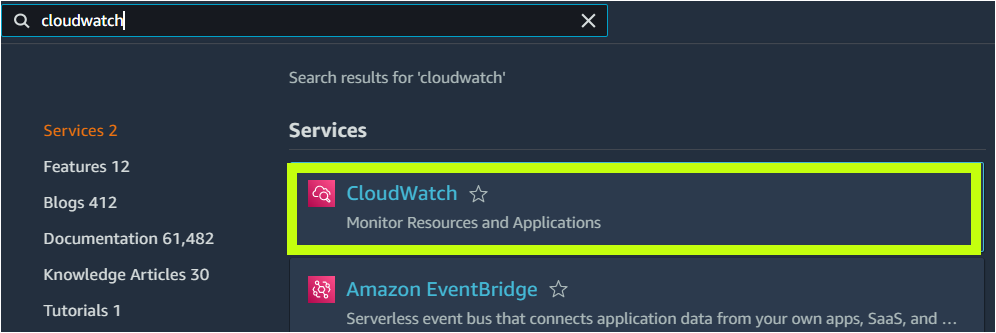
2. On the console’s home page, click on the search box, search for and click ‘CloudWatch’ to access the CloudWatch dashboard. Your browser automatically redirects the page to the CloudWatch dashboard.
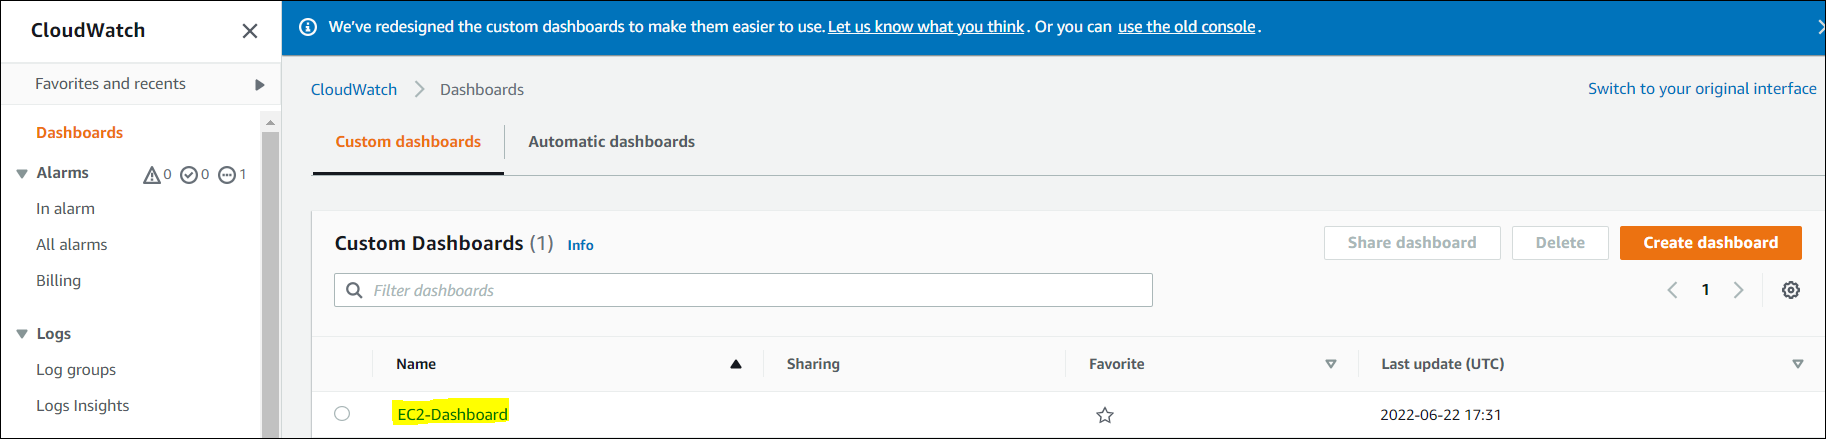
3. Once on the CloudWatch page, click Dashboard on the left navigation menu. You should see the EC2 Dashboard you created. Click on EC2-Dashboard to view the Dashboard.
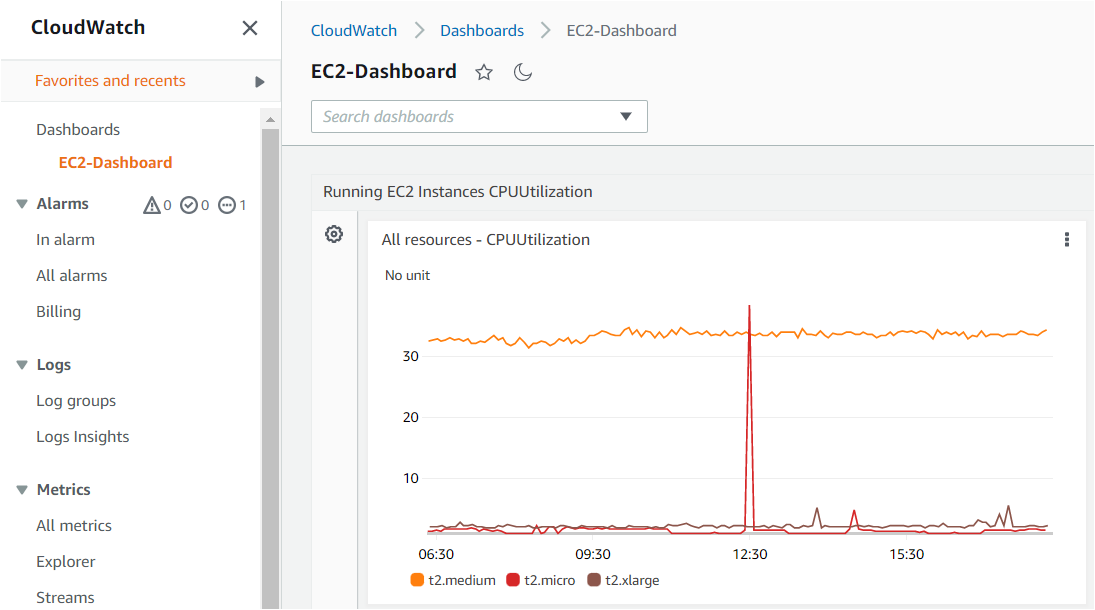
4. After you click on EC2-Dashboard, the page opens the Dashboard and shows the CPU utilization of all the running instances in the AWS account.
As you can see below, there are three pre-configured instances in the account, and three different colored lines show their CPU utilization for the last 9 hours.
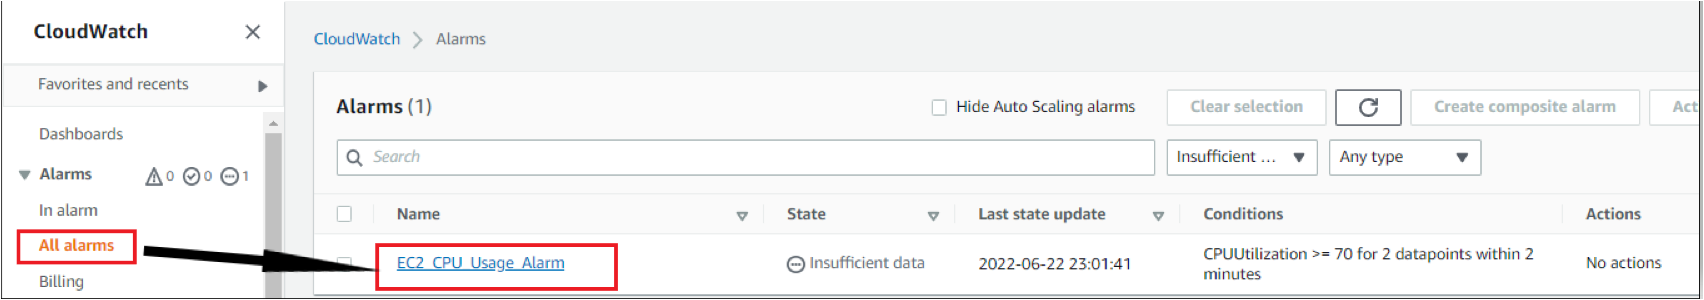
5. Next, click on the All alarms menu as shown below, and you will see EC2_CPU_Usage_alarms that you specified in Terraform.
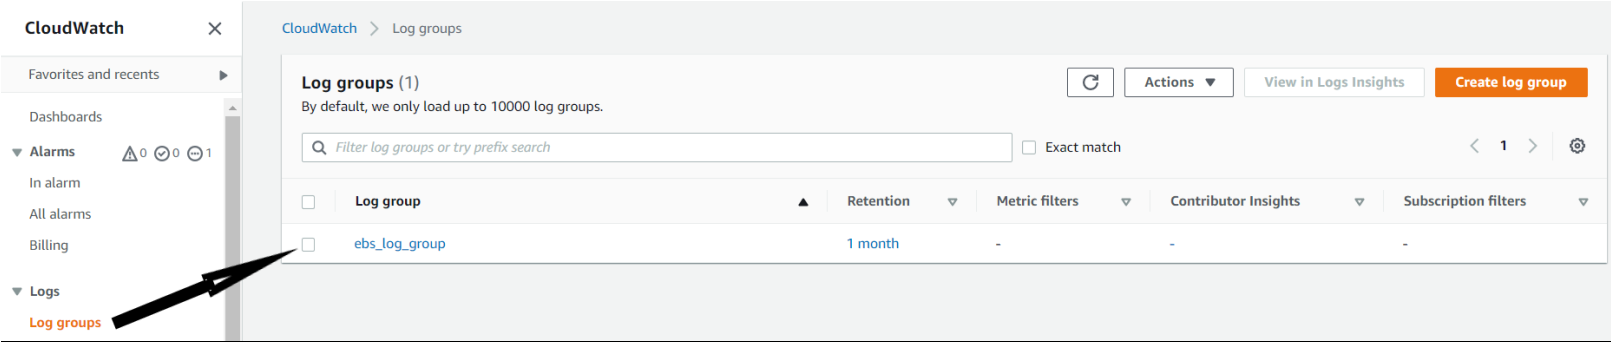
6. Now, verify if the CloudWatch log group you created is on the CloudWatch page. To verify, click on Log groups, and you should see ebs_log_group.
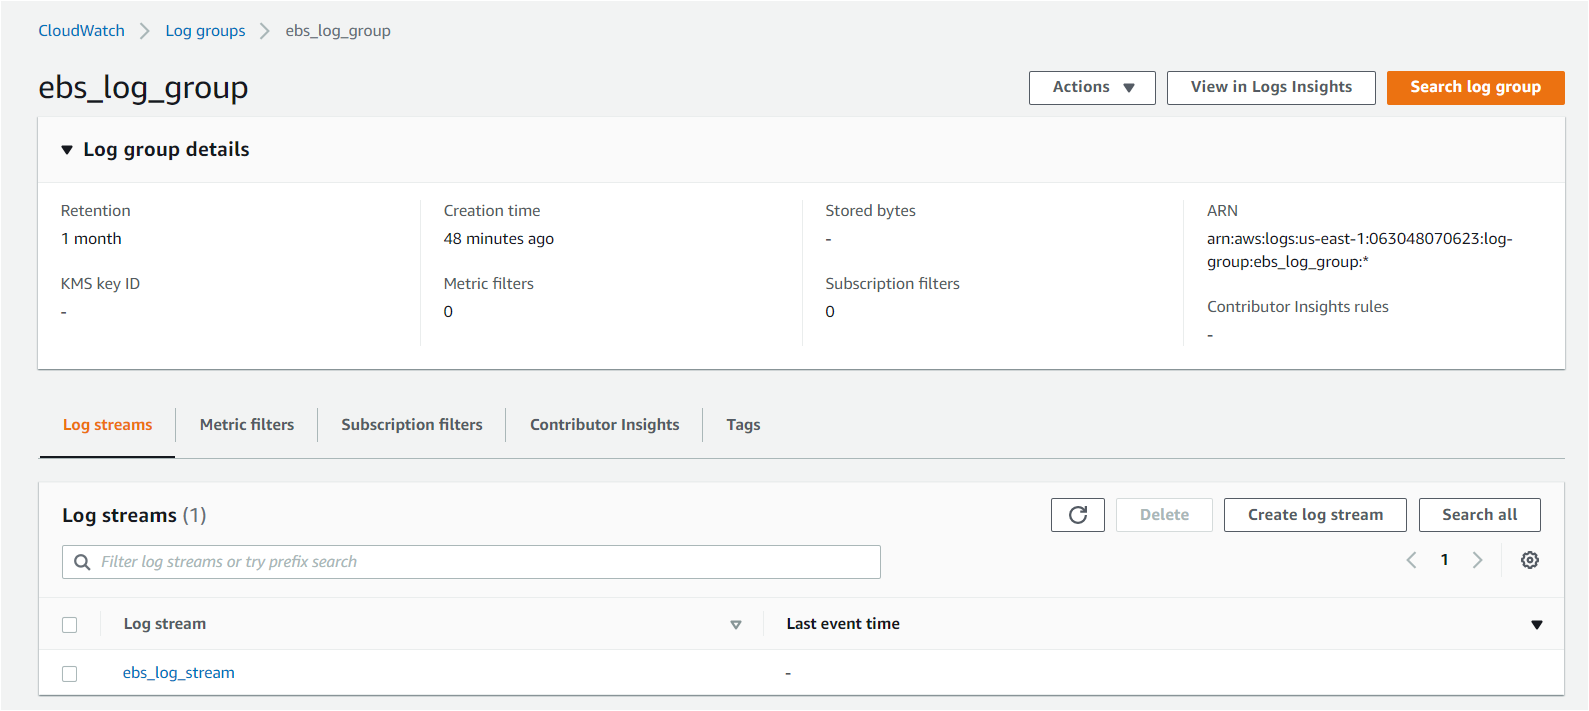
7. Further, click on ebs_log_group log group, and you will see all the details of the log group, such as Retention, creation time, and log group ARN. Also, you will see the Log streams present for the log group (ebs_log_stream).
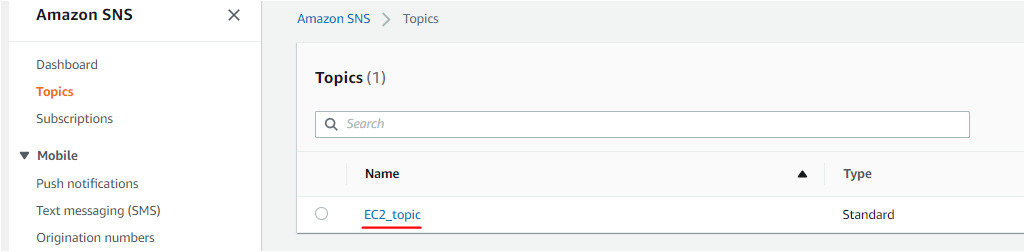
8. To verify the Amazon Simple Notification Service (SNS) topic you created, navigate to the SNS page in the AWS management console, and you should see Topics on the left sidebar. When the CPU utilization crosses the threshold and triggers the alarm, this topic notifies you through the SNS subscription.
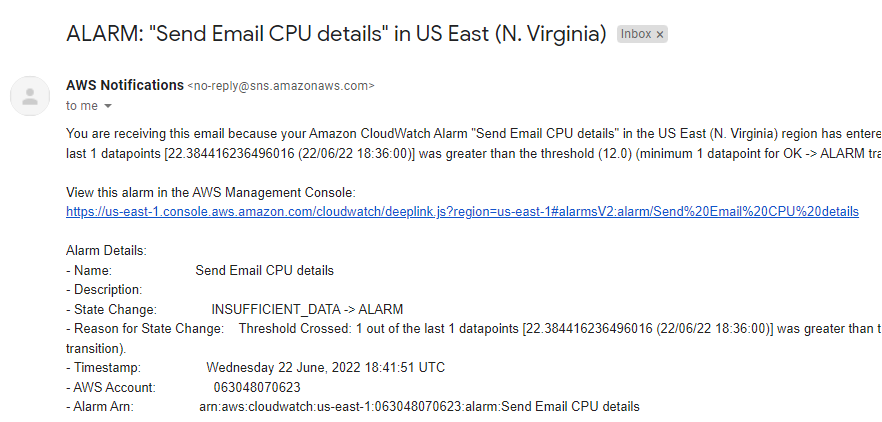
If the CPU crosses the threshold, you will receive an email as shown below on your email account.
You can visit this link to learn about setting up email notifications.
Conclusion
In this tutorial, you’ve learned how to set up AWS Cloud watch components and monitor the data stored on the CloudWatch Page. You also learned to monitor the metrics in various visualizations in different panels within the CloudWatch Dashboard.
You now have fully functional AWS CloudWatch components in your AWS account. Go wild and test out everything you can with the CloudWatch Dashboard and its features.


