


Your Linux system is an excellent platform for servers and desktops. But like any other complex system, having proper monitoring in place is crucial to keep your system at its peak. Luckily, Sysdig is just around the corner!
Sysdig is a comprehensive Linux monitoring tool that can monitor your system for threats, errors, usage patterns, and many more. And in this tutorial, you’ll learn to install Sysdig while highlighting particular configuration options along the way on how to monitor your Linux system better.
Read on and never miss an ‘alert’ again!
Prerequisites
This tutorial will be a hands-on demonstration. If you’d like to follow along, be sure you have the following.
- A Linux machine – This tutorial uses Ubuntu 20.04 LTS, but any Linux distributions will work.
- A non-root user with sudo privileges.
Installing Sysdig on Linux
The Sysdig command-line tool is typically available in most modern Linux distributions, and you can install Sysdig like other packages you’ve installed so far on your machine.
1. Open your terminal, and run the apt update command below to ensure you have the latest updates from your distribution’s repositories. This command updates your system’s package lists and may take a few minutes to complete.
sudo apt update -y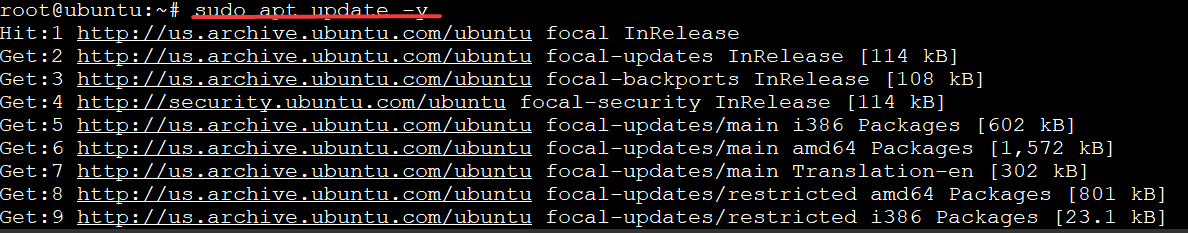
2. Next, run the apt install command below to download (curl) and install the necessary packages for Sysdig. This command also installs some additional modules used later in this tutorial as follows:
gnupg– The GNU Privacy Guard is a tool for secure communication and data storage. This package enables downloading of Sysdig’s public GPG key to verify the validity of Sysdig packages.
software-properties-common– Provides a quick way to manage your software sources via the command line environment or GUI. This package lets you use theadd-apt-repositorycommand to add the Sysdig package repositories.
linux-headers-$(uname -r)– Provides the necessary files to build kernel modules for your running kernel. This package is required because you might install Sysdig on a machine with an older stock kernel.
sudo apt install gnupg software-properties-common curl -y && sudo apt install linux-headers-$(uname -r) -y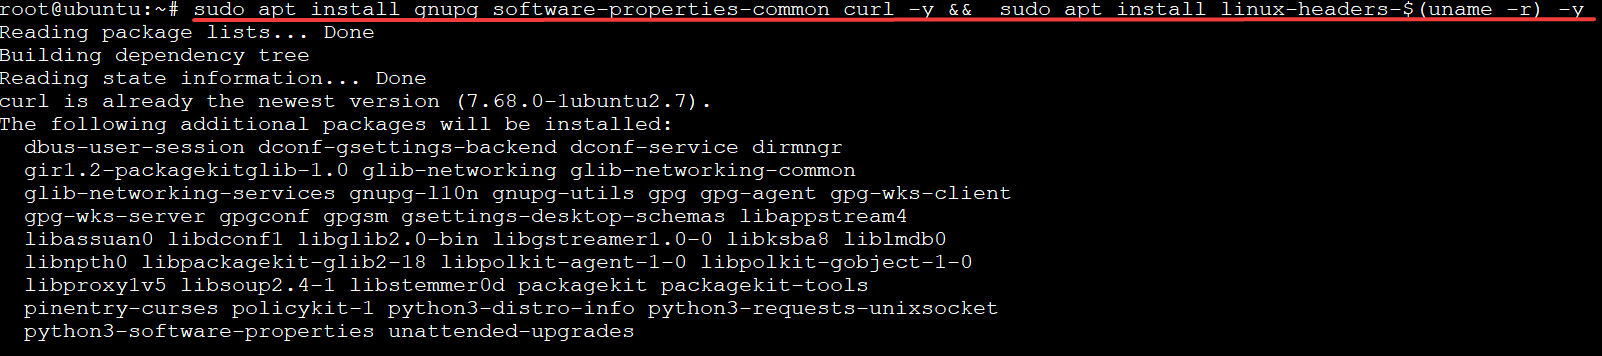
3. Run the curl command below to add Sysdig’s GPG public key (GPG) to your APT’s keyring. This command lets you verify that packages downloaded from sysdig.com are valid and unmodified.
curl -s https://s3.amazonaws.com/download.draios.com/DRAIOS-GPG-KEY.public | apt-key add -You will get an OK message after you’ve successfully added the key, as shown below.

4. Now, run the curl command below to silently (-s) download the Sysdig repositories as draios.list and add it to your system. The .list extension tells your APT that the file is a list of URLs for repositories, rather than just one URL.
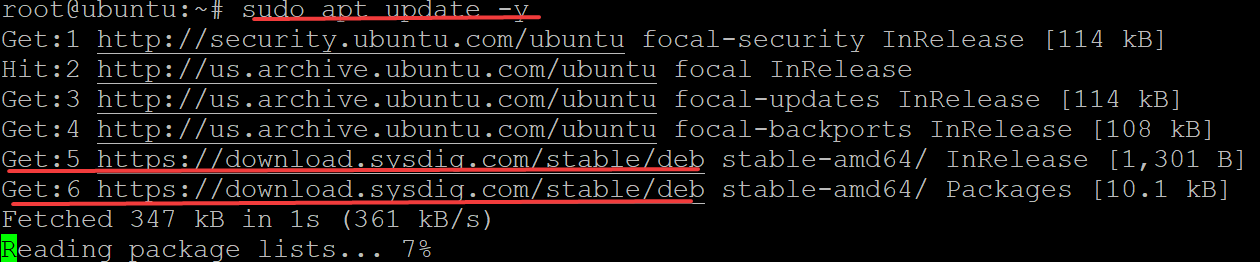
curl -s -o /etc/apt/sources.list.d/draios.list http://download.draios.com/stable/deb/draios.list5. Rerun the apt update command below to download the new Sysdig repositories and update your APT’s package lists with the new repositories’ information.
sudo apt update -yYou will see the following output if your APT is configured correctly.
6. After downloading the Sysdig repositories, run the apt install command below to install sysdig on your machine. This command downloads and installs the sysdig package and its supporting packages.
sudo apt install sysdig -y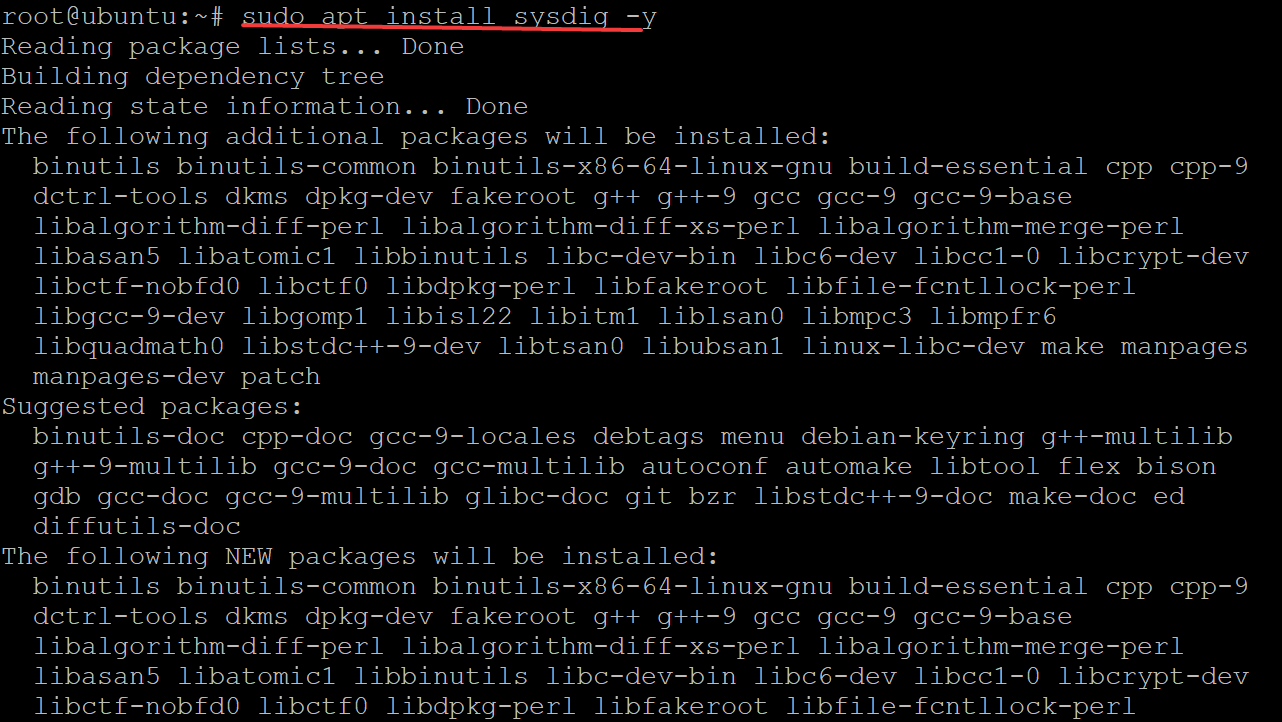
7. Finally, run the sysdig command below to check the Sysdig version installed on your machine.
sudo sysdig --versionThe version number helps determine if your Sysdig package is up to date. The version also gives insight into whether or not the release of Sysdig impacts system performance.
As shown below, 0.28.0 is the latest version of sysdig as of this writing. Your version number might be different.

Monitoring Linux Systems with csysdig
Now that you have Sysdig installed, you can use Sysdig to look at what is going on with your system. The Sysdig command-line tool has many flags that give you different views of your system and its activity. The most basic example is the csysdig command.
Run the command csysdig without any flags to see what is happening on your system right now. The command will show you the activity of all the processes currently running.
Note that you must run Sysdig commands with
sudoprivilege to have full access to your system. Some system activity might be hidden by default from non-root users, like the output of the /proc file system. Sysdig also requiressudoprivileges to auto-load the kernel symbols necessary to do many of its tricks, like the sysdig-probe kernel module
sudo csysdig
If you encounter the following error, you’ll need to reinstall the ncurses-term package. The ncurses-term package tends to get corrupted after a fresh Sysdig installation. Sysdig depends on the ncurses-term package to support its ncurses UI.

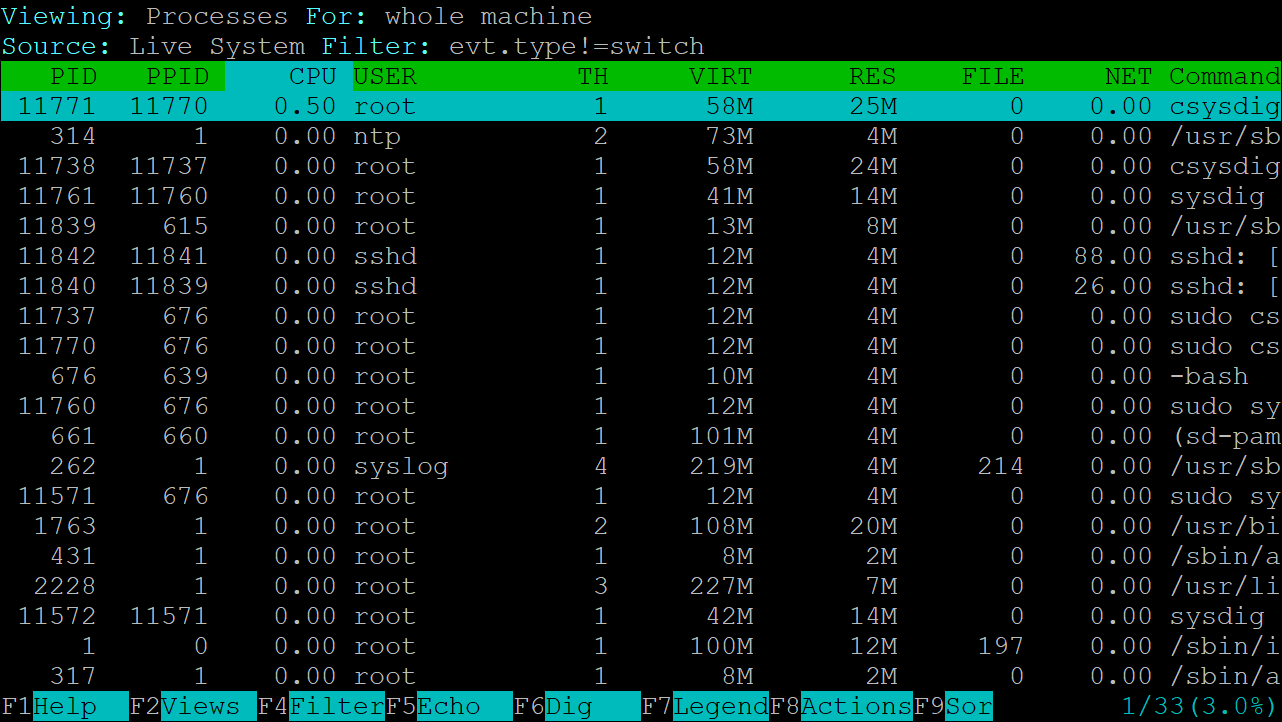
If the csysdig command is successful, you’ll get the following output organized into tabs.
| Description | |
| PID | The Process ID that assigned by the Linux kernel. You use PIDs to identify and manage processes. |
| PPID | The parent process ID of the process. You use PPID to trace the process back through its parent processes. Together, PID and PPID uniquely identify a process on your system. |
| CPU | The percentage of CPU used by the application since it started can be seen on a scale from 0 to 100%, where 100% equals total CPU usage. You use CPU usage to find applications that are hogging system resources. |
| USER | The name of the user that started the process. You use USER to find out who is executing a process you are interested in. |
| TH | The name of the user that started the process. You use USER to find out who is executing a process you are interested in. |
| VIRT | The total amount of virtual memory used by the application. You use VIRT to find applications that are hogging your system’s memory. |
| RES | The number of resident memory pages a process has, as mapped to physical memory. You use RES to find applications that are hogging your system’s memory. |
| FILE | The disk’s file descriptor used by the application. You use FILE to see which files are being read or written frequently, usually an indication of I/O activity. |
| NET | The network socket descriptor used by the application. You use NET to see which network connections are being used by the process, and how much data is being transferred in bytes per second. |
| Command | The network socket descriptor used by the application. You use NET to see which network connections are being used by the process, and how much data is being transferred in bytes per second. |
At first glance, the csysdig interface looks similar to monitoring tools like htop.
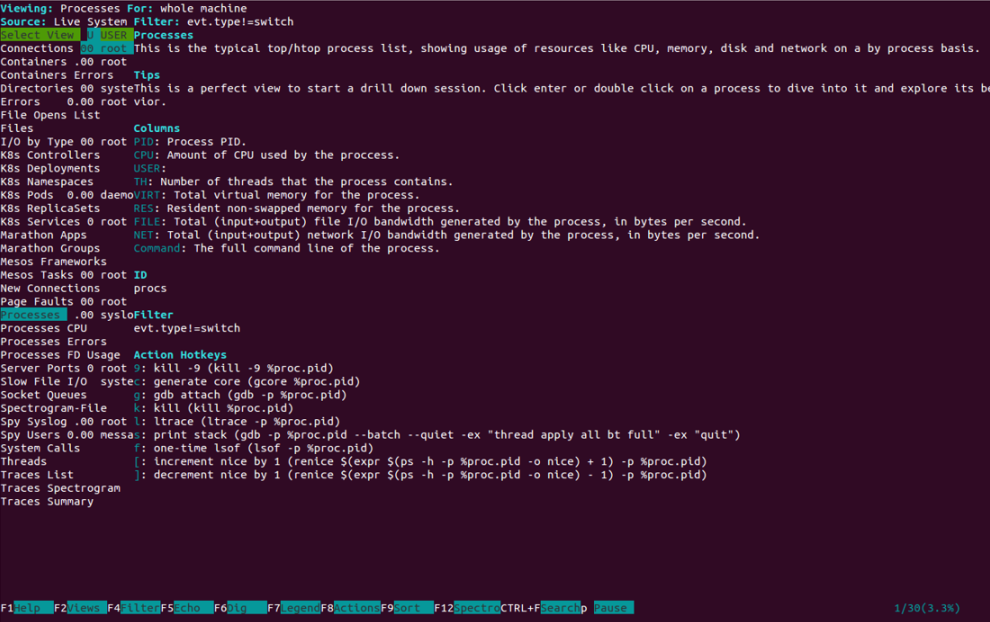
Press F2 and the top tabs will change to display a new set of information organized into tabs on the left, as shown below.
Sysdig calls these “views” because they are different system views, organized by the kind of information they show, offering more context. And since these views are LUA script-based, you can customize the scripts to extract different data from the system and change the view as you prefer.
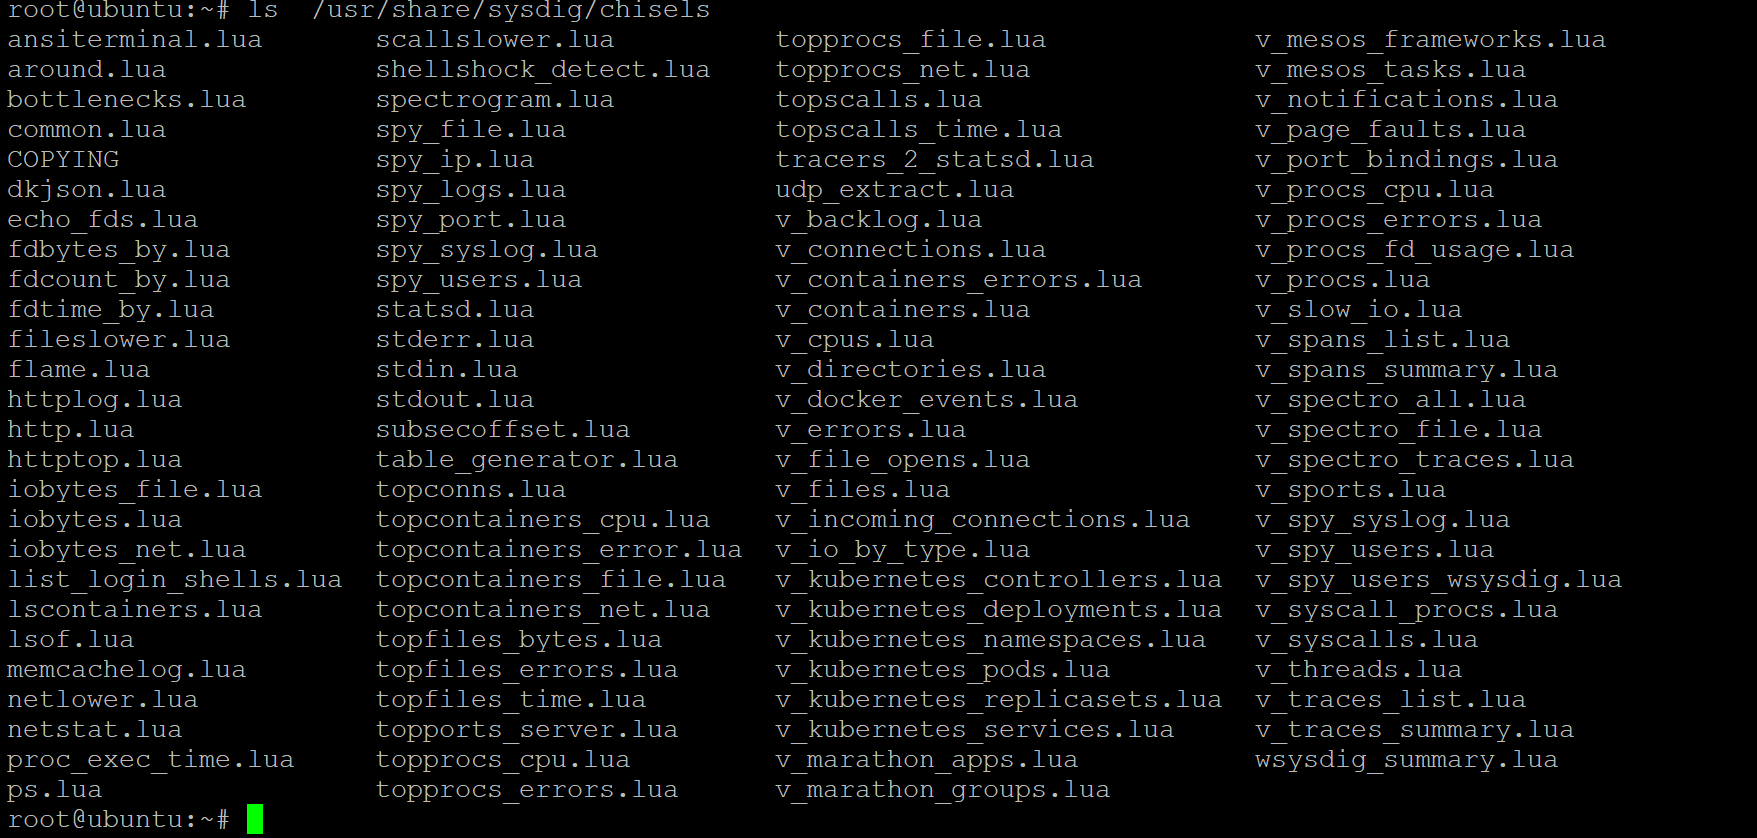
By default, the LUA scripts are located in the /usr/share/sysdig/chisels directory, as shown below.
ls /usr/share/sysdig/chisels
Monitoring CPU-Consuming Processes with Sysdig Chisels
Sysdig offers several ready-to-use chisels that automatically collect specific system information, known as “chisels.” Perhaps you’re experiencing slow performance on your CPU. If so, running the sysdig command with a specified chisel lets you view which applications/processes are taking up most of your CPU usage.
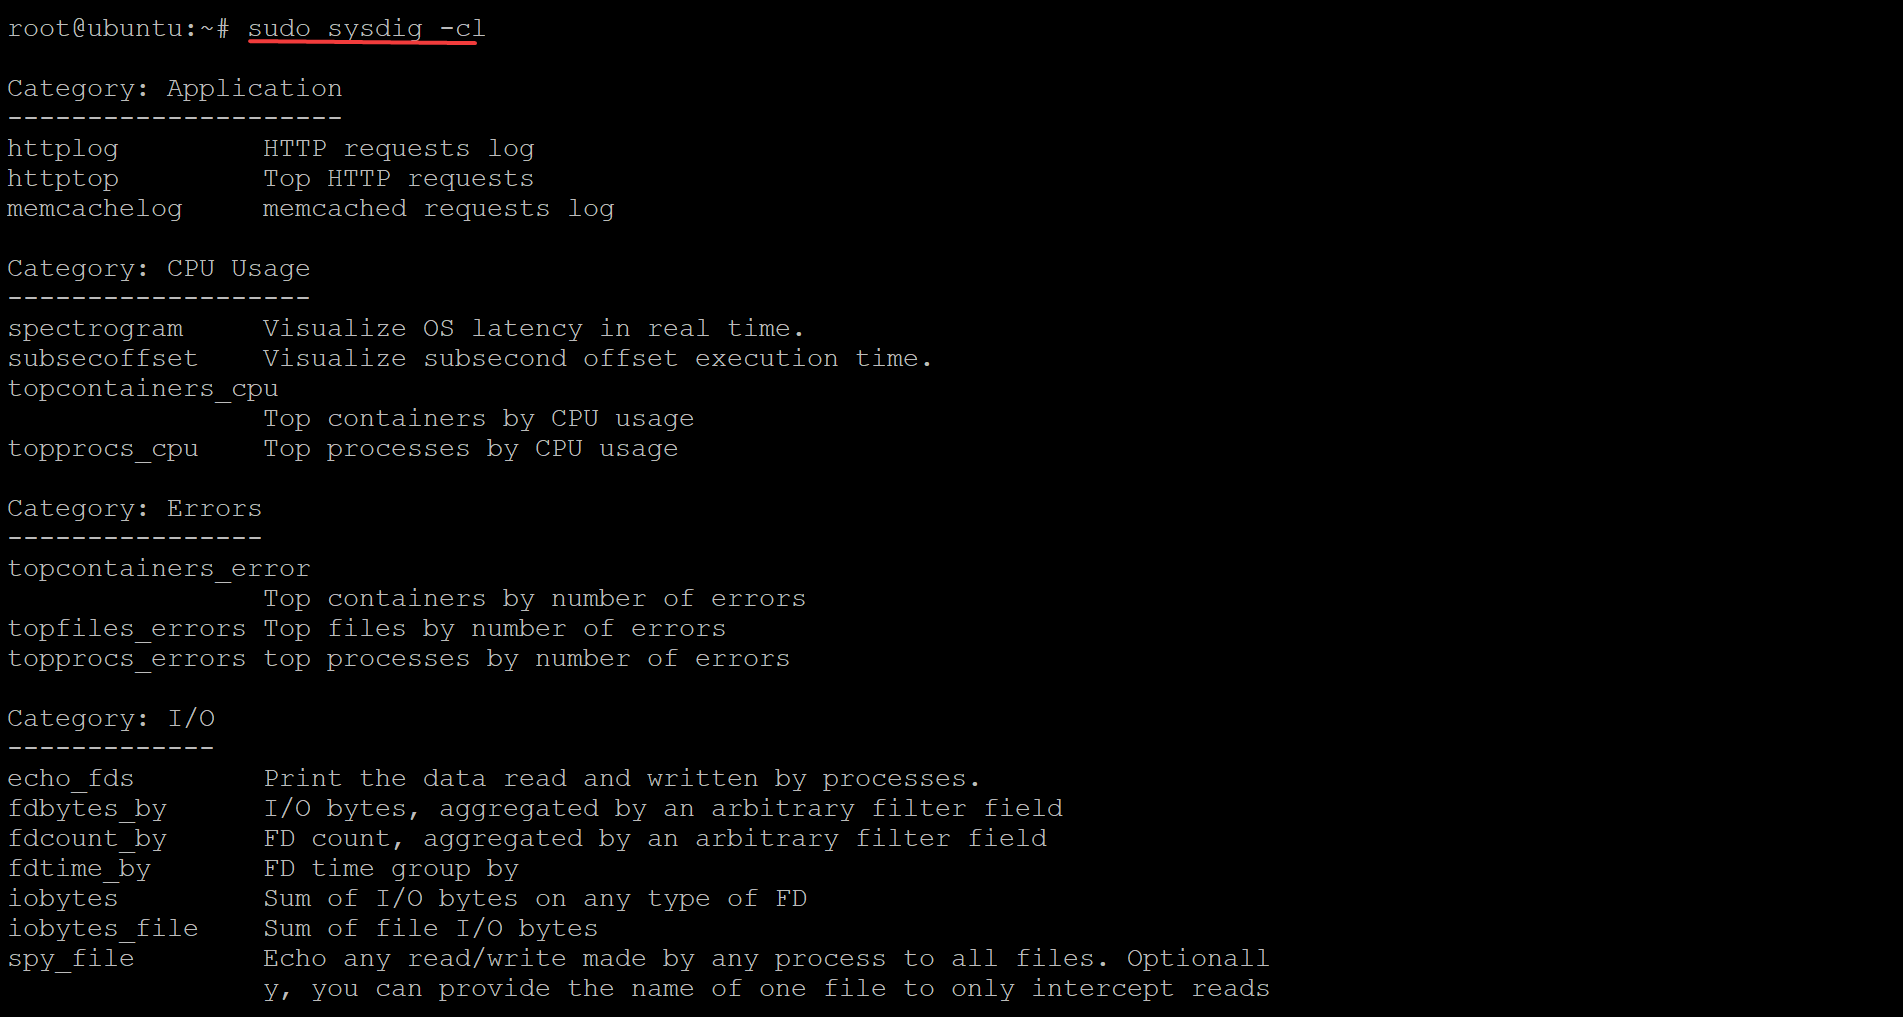
1. Run the sysdig command below to list available chisels.
sudo sysdig -clThe below screenshot shows only a few chisels. But you can find and learn the complete list of all available chisels in the official documentation.
Sysdig chisels are also LUA scripts. You can create your own chisels to monitor specific system information or implement your own view, but this topic is beyond the scope of this tutorial.
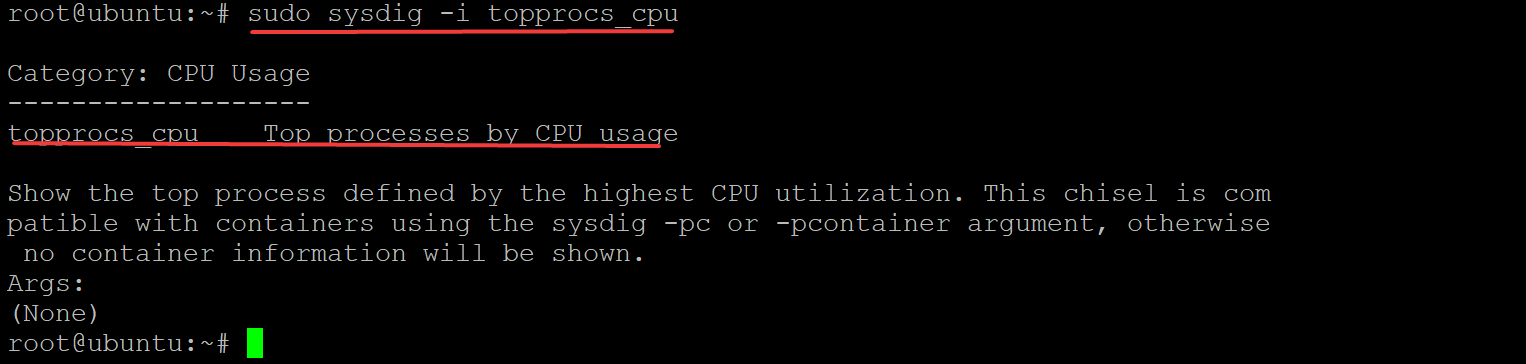
2. Next, run the below command to see the detailed information (-i) about a specific chisel, like topprocs_cpu in this demo.
sudo sysdig -i topprocs_cpuYou can see all the information about the topprocs_cpu chisel below, including the chisel’s name, category, and a brief description of what the chisel does.
In this example, the topprocs_cpu chisel is categorized as CPU Usage and Shows the top process defined by the highest CPU utilization.
Once you understand the functionality of a chisel, you can start using that chisel.
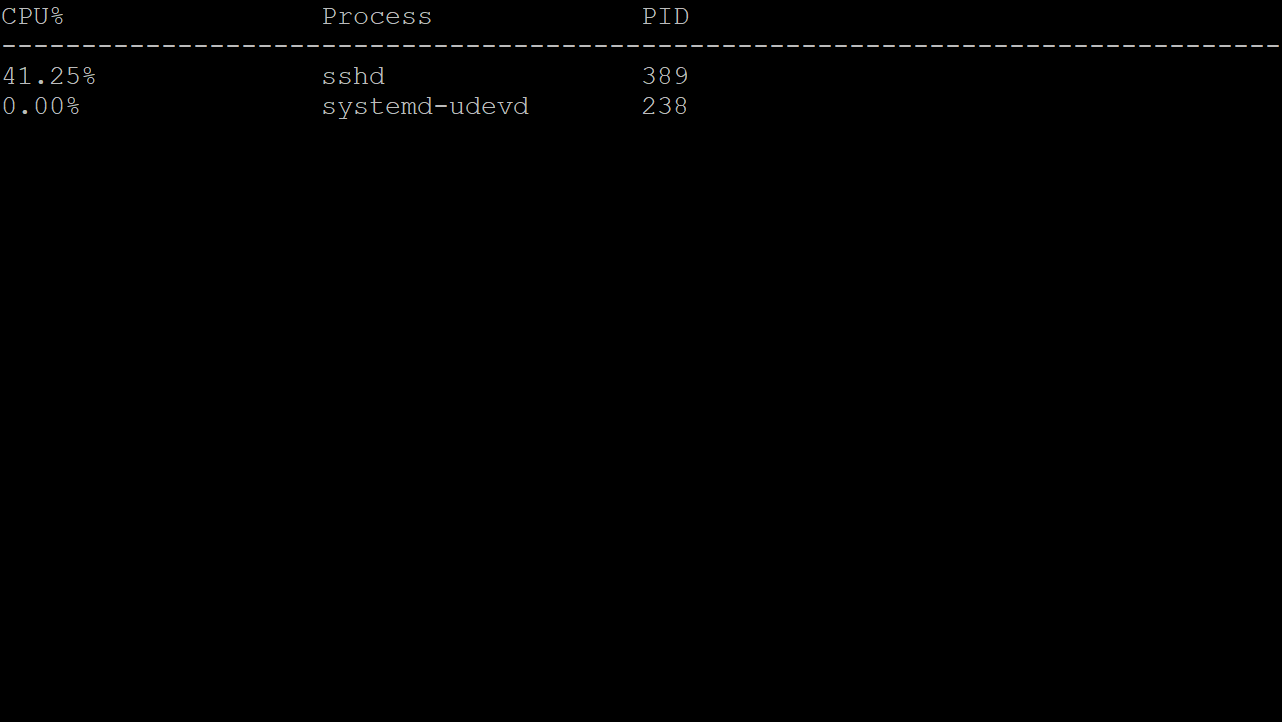
3. Run the sysdig command below, specifying the right chisel (-c topprocs_cpu) to find the applications using the highest amount of CPU in your system.
sudo sysdig -c topprocs_cpuSysdig captures the top 10 CPU-consuming processes in this demo and prints them on the terminal. The most CPU-intensive process will be displayed on top (sshd), making them quicker to find.
Monitoring Filtered System Information
In some cases, the output is enormous, making it hard to filter system information based on a specific chisel. Luckily, Sysdig offers a powerful filtering option that uses Lua syntax so you can perform effective filtering.
Suppose you’re only looking for sshd processes that contribute to high CPU usage. You can define a filter expression by a specific PID or process name.
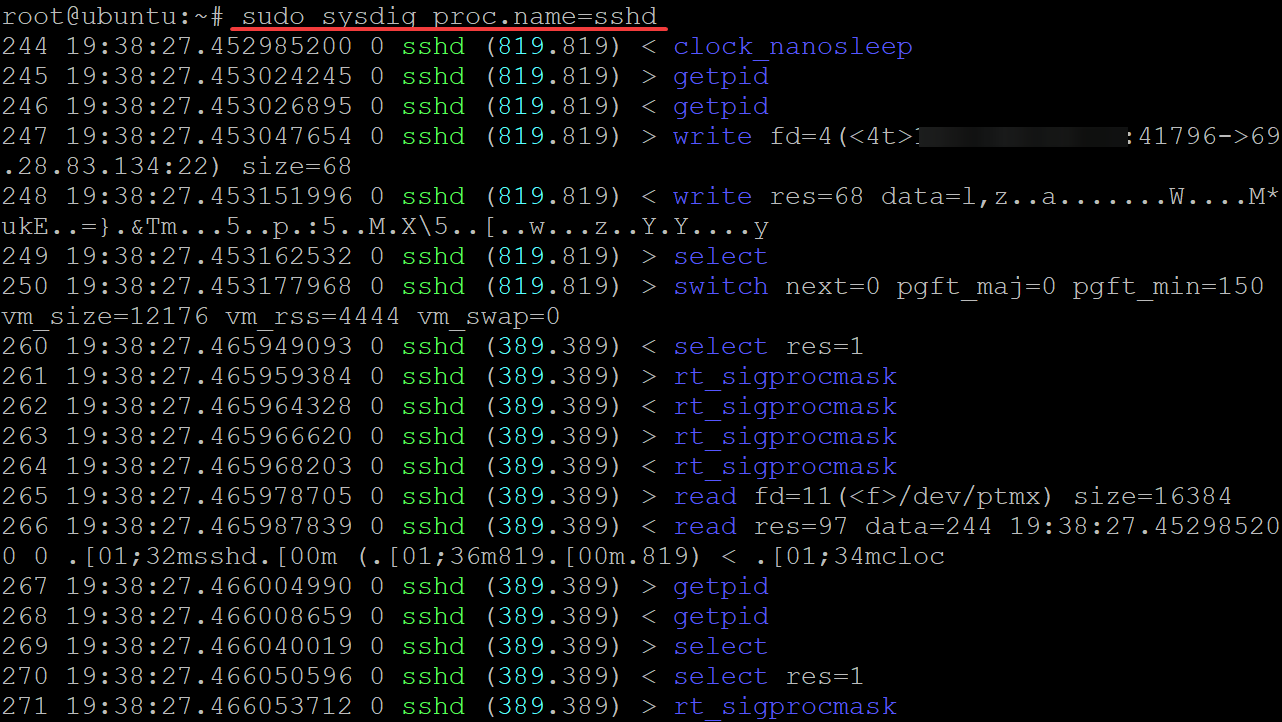
Run the below sysdig command to show only the sshd process that uses a lot of CPU.
sudo sysdig proc.name=sshd
As shown below, you will get a filtered output without getting any other process information.
From the output, you can get more information about the sshd process, like why the sshd process uses more CPU or memory, and so on.
Creating an Event Log File to Monitor your System
One of the great features that Sysdig offers are event log files, which allow you to collect all information about what your application or the system does for later analysis. The event log files provide the same information as the command-line outputs in the previous examples but are saved to a file on disk.
1. Run the below command create a file (-w) called ata.scap in your home directory, where Syslog will store all sysdig outputs.
The .scap file extension allows saving data streams in the form of human-readable text.
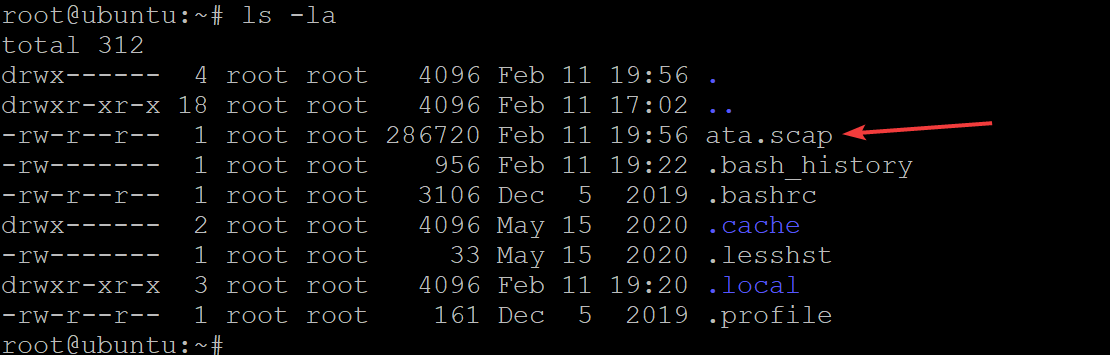
sudo sysdig -w ata.scap2. Next, run the ls -la command below to list all files in the working directory.
ls -laYou’ll notice a new file named ata.scap in your home directory, as shown below.
3. Finally, run the below command for Sysdig to read (-r) the Sysdig event log file (ata.scap) and print your system’s behavior when you SSH into your server.
sudo sysdig -r ata.scap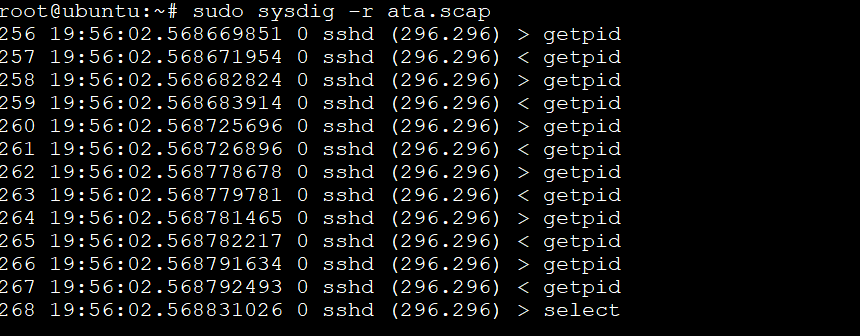
Conclusion
In this article, you learned how to install Sysdig on Ubuntu 20.04 and use csysdig to collect your system, applications, and security information. You also touched on creating an event log file that allows you to record your system’s behavior.
At this point, you’ve realized that having Sysdig installed in your system provides you with powerful tools. And these tools help you gain more insights into how your system, applications, and infrastructure work.
Now, with this newfound knowledge, why not learn to decode your HTTP traffic with Sysdig? Or how to track down application bottlenecks with Sysdig tracers?


