

Monitoring your Kubernetes cluster is critical for ensuring that your services are always available and running. And before you scour the internet for a monitoring system, why not try Grafana and Prometheus Kubernetes cluster monitoring?
In this guide, you’ll learn how to monitor your Kubernetes cluster, viewing internal state metrics with a Prometheus and Grafana dashboard.
Read on so you can keep a close watch on your resources!
Prerequisites
- A Linux machine with Docker installed — This tutorial uses an Ubuntu 20.04 LTS machine with Docker version 20.10.7. Here’s how to install Ubuntu.
- A single node Kubernetes Cluster.
- Helm Package Manager installed — For deploying the Prometheus operator.
- The Kubectl Command-line interface is installed and configured to your Cluster.
Deploying the Kube-Prometheus Stack Helm Chart
Grafana and Prometheus Kubernetes Cluster monitoring provides information on potential performance bottlenecks, cluster health, performance metrics. At the same time, visualize network usage, resource usage patterns of pods, and a high-level overview of what is going on in your cluster.
But before setting up a monitoring system with Grafana and Prometheus, you’ll first deploy the kube-prometheus stack Helm chart. The stack contains Prometheus, Grafana, Alertmanager, Prometheus operator, and other monitoring resources.
1. SSH into your Ubuntu 20.04 machine (if you are running on a cloud server) or simply log into your locally installed Ubuntu 20.04 machine to begin.
2. Next, run the kubectl create command below to create a namespace named monitoring for all the Prometheus and Grafana related deployments.
kubectl create namespace monitoring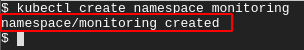
3. Run the following helm repo commands to add the (prometheus-community) Helm repo, and update your Helm repo.
# Add prometheus-community repo
helm repo add prometheus-community https://prometheus-community.github.io/helm-charts

# Update helm repo
helm repo update
4. After adding the Helm repo, run the helm install command below to deploy the kube-prometheus stack Helm chart. Replace prometheus with your desired release name.
This Helm chart sets up a full Prometheus kubernetes monitoring stack by acting based on a set of Custom Resource Definitions (CRDs).
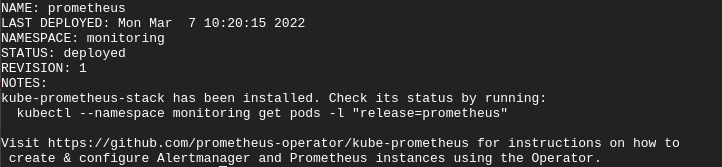
helm install prometheus prometheus-community/kube-prometheus-stack --namespace monitoringOnce the deployment completes, you’ll get the following output.
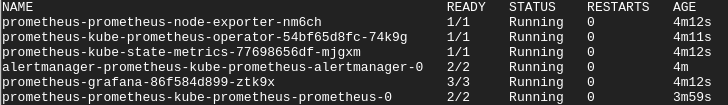
5. Finally, run the following command to confirm your kube-prometheus stack deployment.
kubectl get pods -n monitoringThe output below shows the deployment of the kube-prometheus stack. As you can see, each component in the stack is running in your cluster.
Accessing the Prometheus Instance
You’ve successfully deployed your Prometheus instance onto your cluster, and you’re almost ready to monitor your Kubernetes cluster. But how do you access your Prometheus instance? You’ll forward a local port 9090 to your cluster via your Prometheus service with the kubectl port-forward command.
1. Run the kubectl get command below to view all services in the monitoring namespace to check for your Prometheus service.
kubectl get svc -n monitoringAll the services deployed in the monitoring namespace are shown below, including the Prometheus service. You’ll use the Prometheus service to set up port-forwarding so your Prometheus instance can be accessible outside of your cluster.
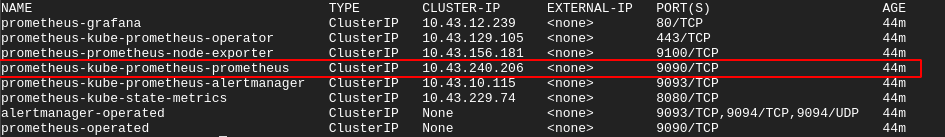
2. Next, run the below kubectl port-forward command to forward the local port 9090 to your cluster via the Prometheus service (svc/prometheus-kube-prometheus-prometheus).
kubectl port-forward svc/prometheus-kube-prometheus-prometheus -n monitoring 9090But if you’re running a single-node Kubernetes cluster on a cloud server, run the following command instead.
kuebctl port-forward --address 0.0.0.0 svc/prometheus-kube-prometheus-prometheus -n monitoring 9090 To run the kubectl port-forward command as a background process, freeing up your terminal for further use, append the & symbol at the end of the command. Follow up by pressing Ctrl+C keys to stop the port-forward foreground process (Doing so will not affect the port-forward background process).
3. Open your favorite web browser, and navigate to either of the URLs below to access your Prometheus instance.
- Navigate to http://localhost:9090 if you’re following along with a local Ubuntu machine
- Navigate to your server’s IP address followed by port 9090 (i.e., http://YOUR_SERVER_IP:9090) if you’re using a cloud server.
For this tutorial, Prometheus is running on a cloud server.
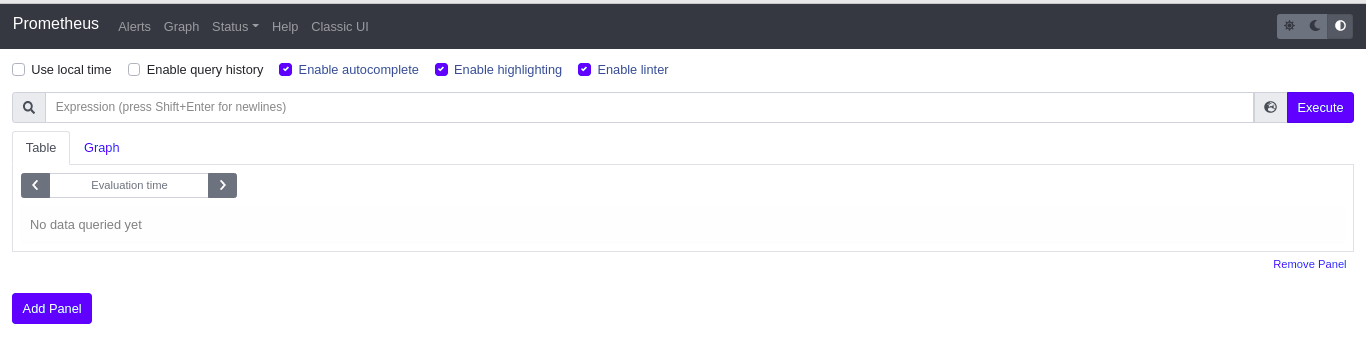
If your Prometheus service works, you’ll get the following page on your web browser.
4. Lastly, on your terminal, press the Ctrl+C keys to close the port-forwarding process. Doing so makes Prometheus inaccessible on your browser.
Viewing Prometheus Kubernetes Cluster Internal State Metrics
Viewing your Kubernetes cluster’s internal state metrics is made possible with the Kube-state-metrics (KSM) tool. With the KSM tool you can keep track of the health and usage of your resources, and also internal state objects. Some of the data points that can be potentially viewed via KSM are; node metrics, deployment metrics, and pod metrics.
The KSM tool comes pre-packaged in the kube-prometheus stack and is deployed automatically with the rest of the monitoring components.
You’ll port-forward a local port to your cluster via the kube-state-metrics service. Doing so lets KSM scrape the internal system metrics of your cluster and output a list of queries and values. But before port-forwarding, verify your KSM Kubernetes service first.
1. Run the below command to check for your kube-state-metrics Kubernetes service.
kubectl get svc -n monitoring | grep kube-state-metricsBelow, you can see the KSM Kubernetes service name (prometheus-kube-state-metrics) along with the ClusterIP. Note down the KSM Kubernetes service name as you’ll need it to perform the port forwarding in the next step.

2. Next, run the below command to port-forward the prometheus-kube-state-metrics service to port 8080.
kubectl port-forward svc/prometheus-kube-state-metrics -n monitoring 8080 If you are following along with this tutorial with an Ubuntu 20.04 machine hosted by a cloud provider, add the (–address 0.0.0.0) flag to the kubectl port-forward command. Doing so allows external access to the local port via your server’s public IP address.
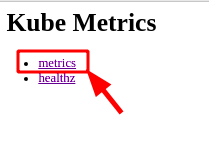
3. Finally, on your web browser, navigate to either of the URLs below to view the Kube Metrics page, as shown below.
- Navigate to your server’s IP address followed by port 8080 (i.e., http://YOUR_SERVER_IP:8080) if you’re using a cloud server.
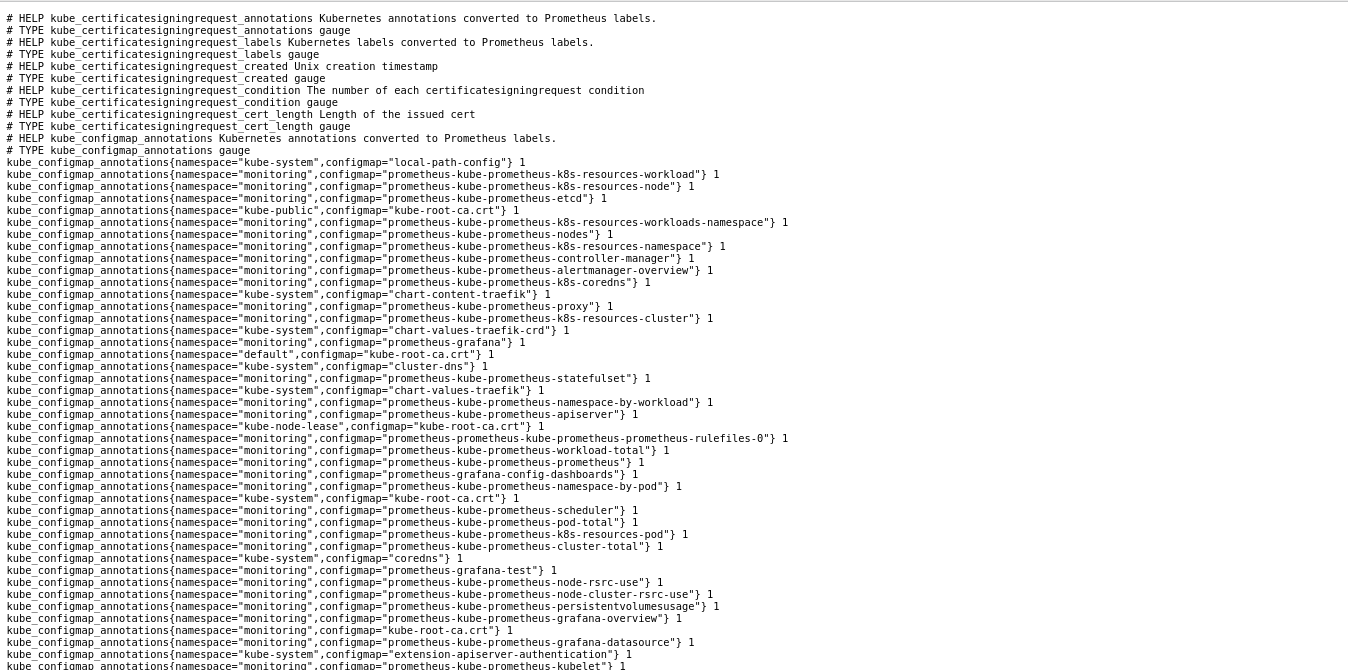
Click on the metrics link to access your cluster’s internal state metrics.
You can see below a cluster’s internal state metrics similar to yours.
Visualizing a Cluster’s Internal State Metric on Prometheus
You’ve successfully performed kube-prometheus stack Helm chart deployment, kube-state-metrics scrape, and Prometheus job configurations. As a result, CoreDNS, kube-api server, Prometheus operator, and other Kubernetes components have been automatically set up as targets on Prometheus.
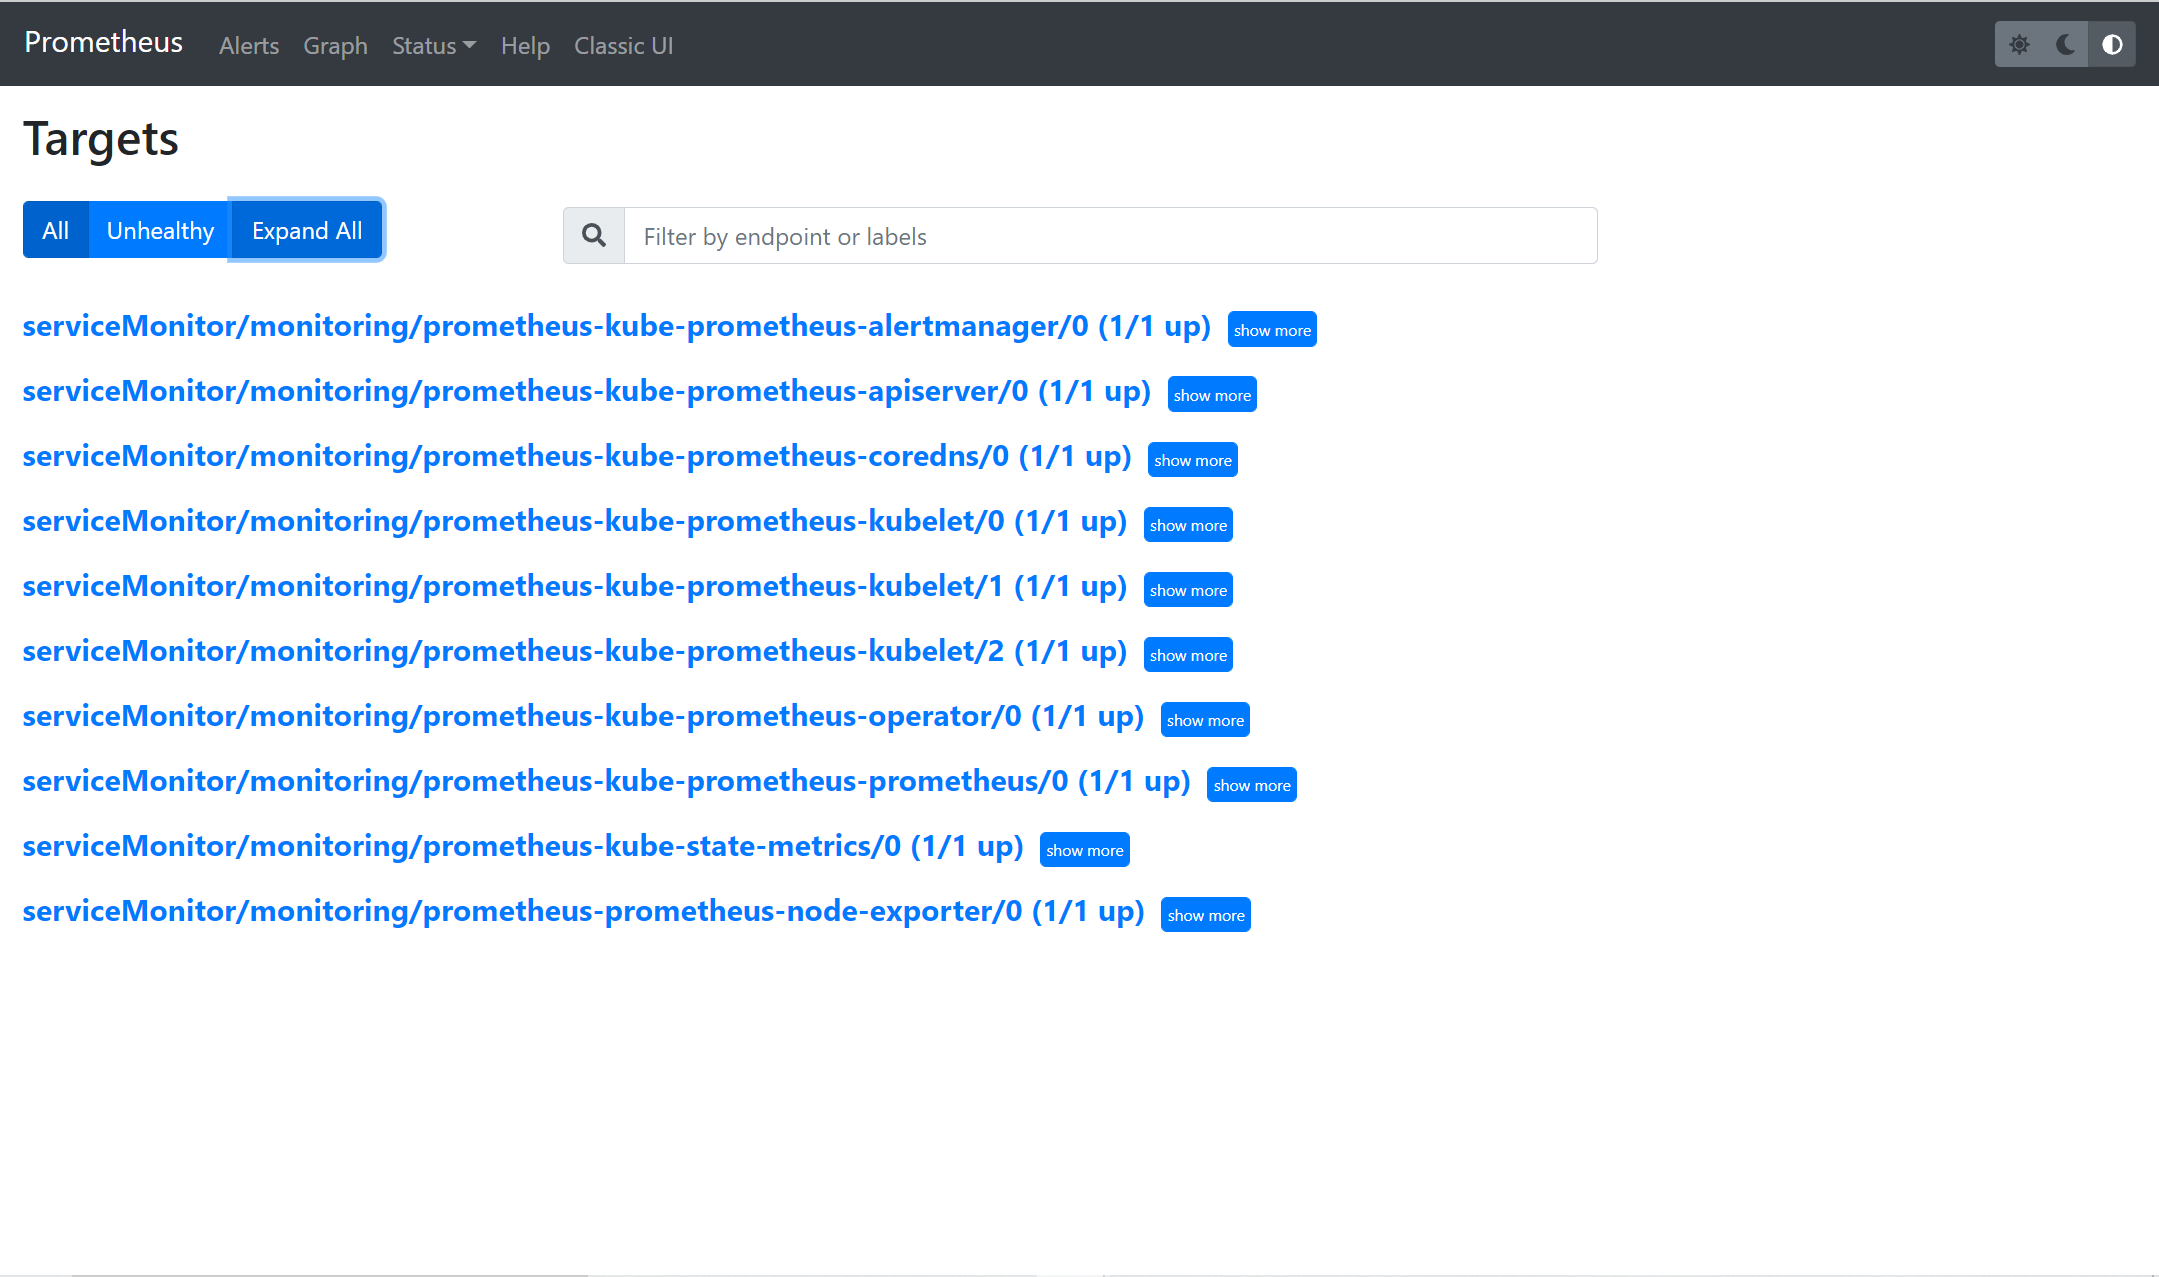
1. Navigate to either of the http://localhost:9090/targets or http://<YOUR_SERVER_IP:9090/targets endpoints on your web browser. Doing so lets you verify that these targets have been properly configured.
Accessing the endpoint also lets you verify Prometheus is scraping their metrics and storing the data in a Time-Series Database (TSDB),
Remember to port-forward Prometheus as shown in the “Accessing the Prometheus Instance” section in step two, before navigating to the endpoint. You can as well run it as a background process.
As you can see below, different Kubernetes internal components and monitoring components are configured as targets on Prometheus.
2. Click on the Graph menu to get to a page where you’ll run a PromQL (Prometheus Query Language) query.

3. Insert the sample PromQL (Prometheus Query Language) query below into the expression space provided, then click on Execute. The query returns the total amount of unused memory in your Cluster.
sum((container_memory_usage_bytes{container!="POD",container!=""} - on (namespace,pod,container) avg by (namespace,pod,container)(kube_pod_container_resource_requests{resource="memory"})) * -1 >0 ) / (1024*1024*1024)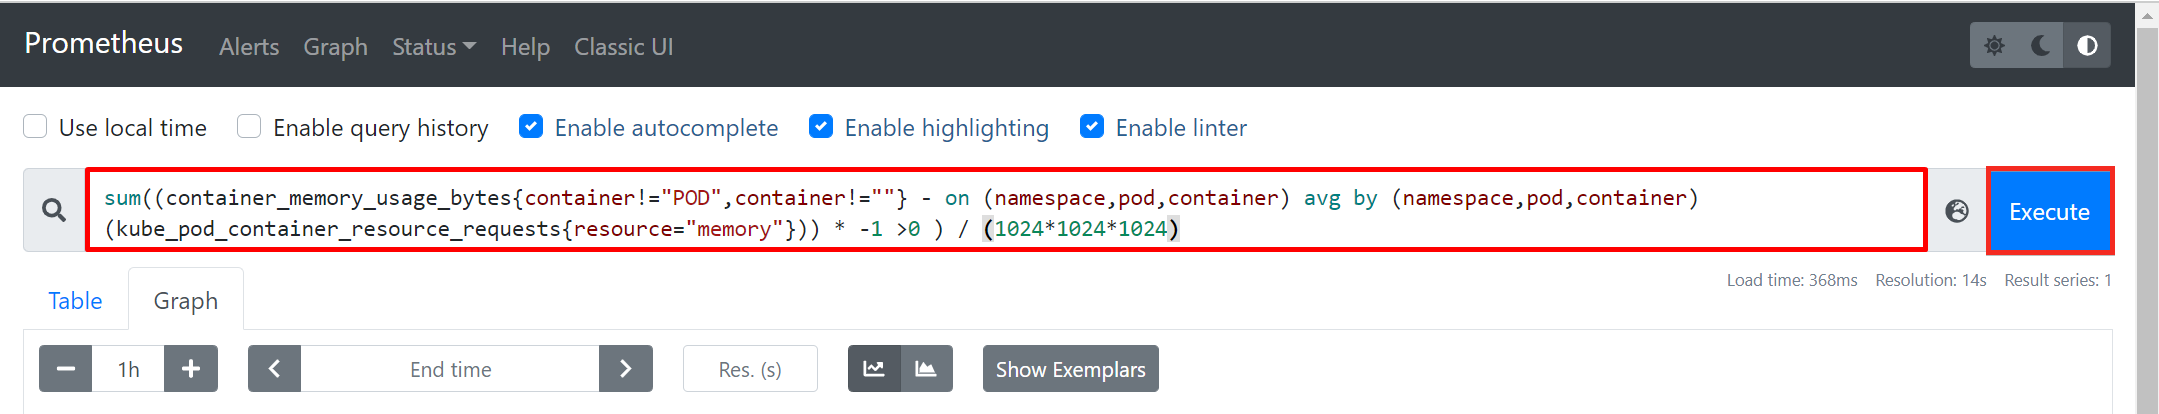
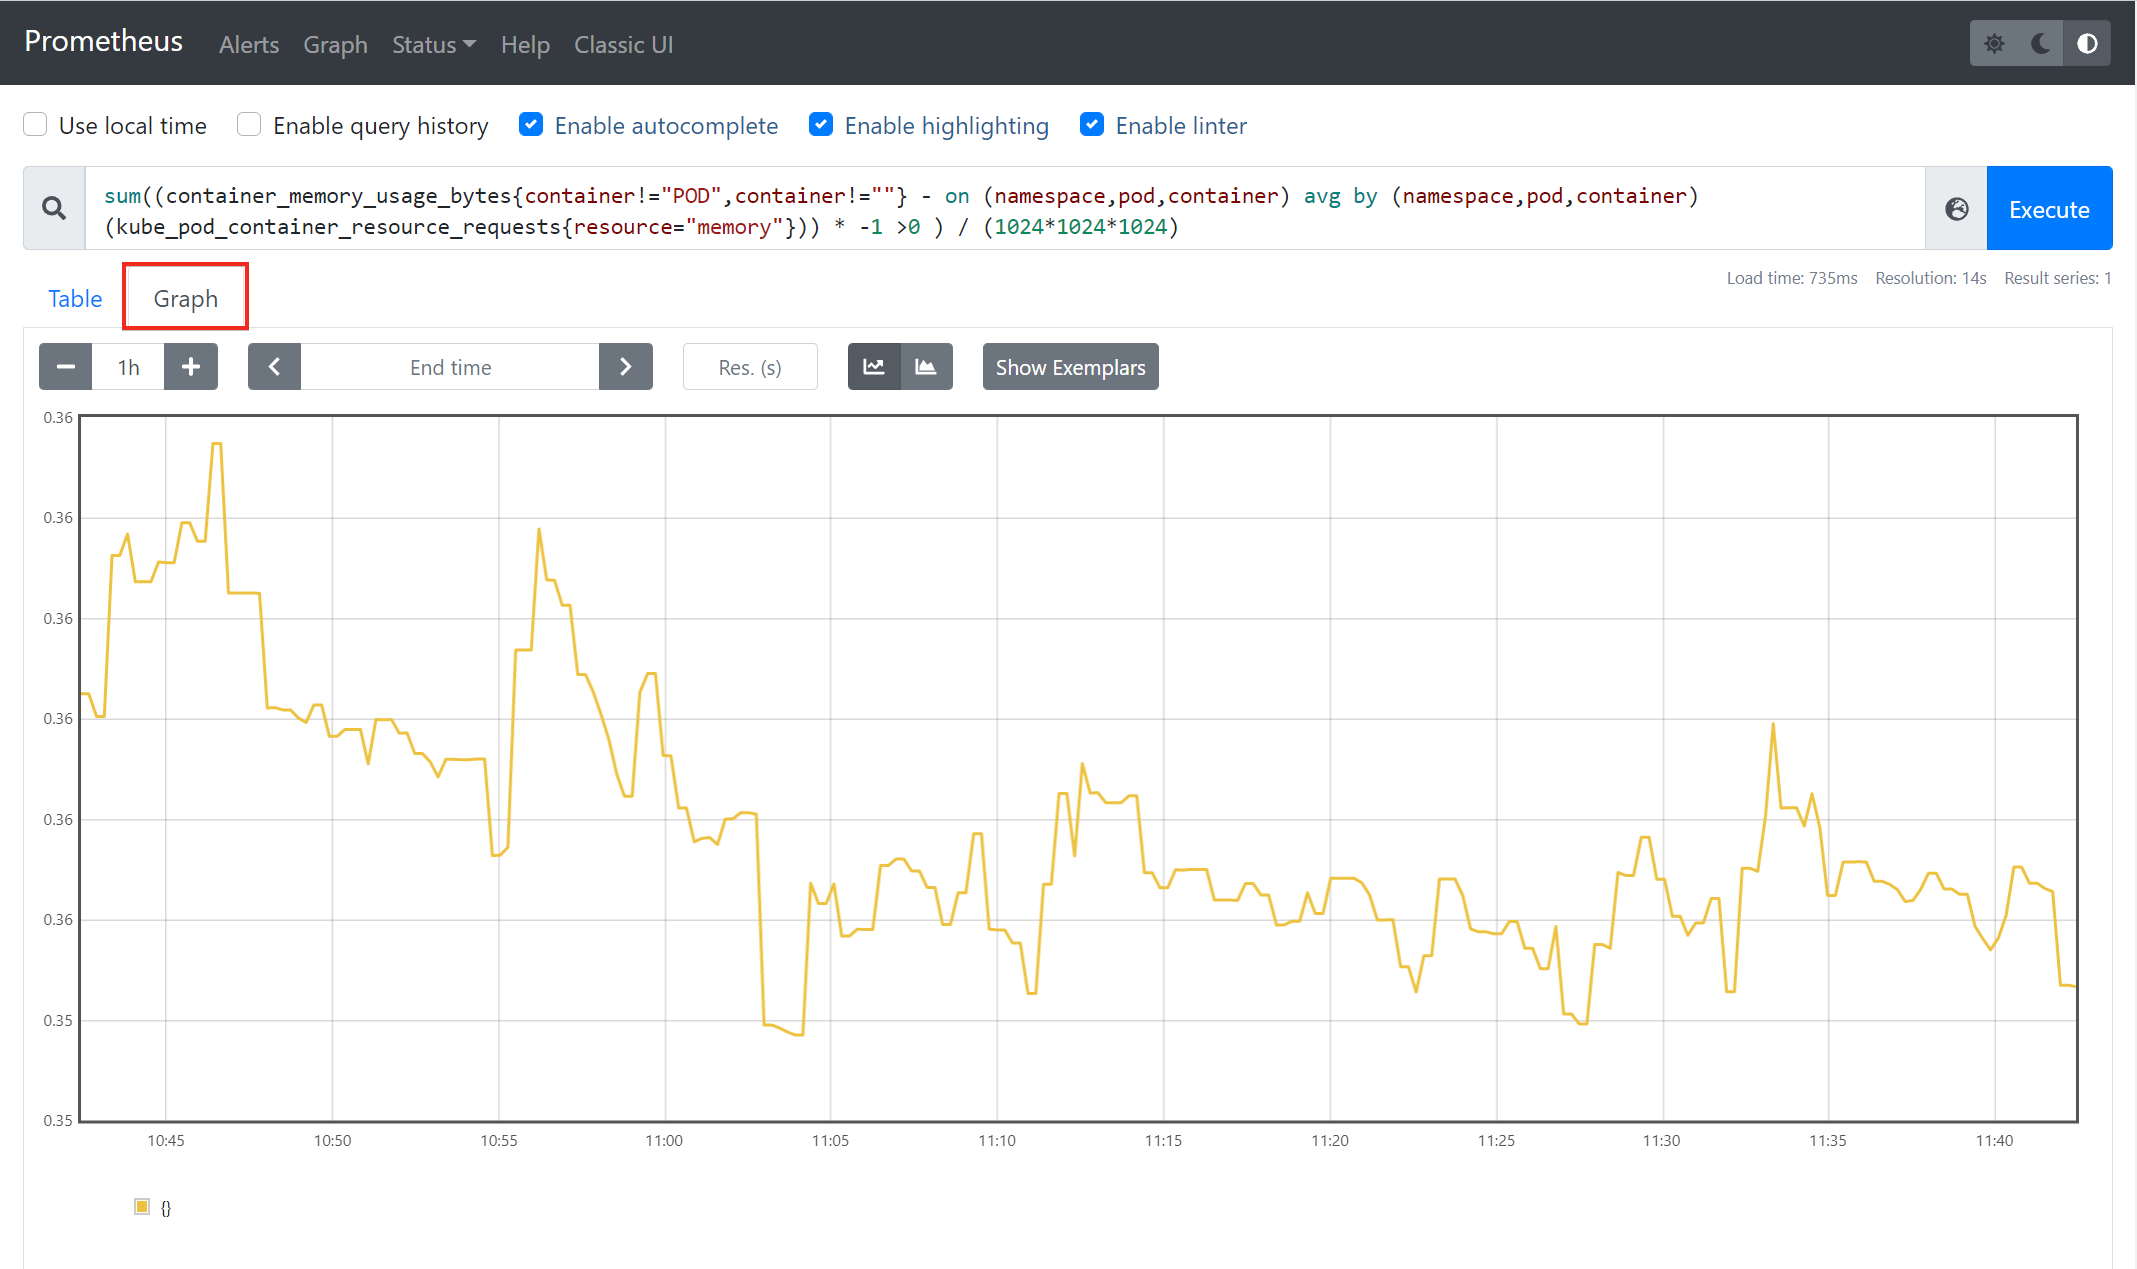
4. To view the results of the PromQL query executed in step 3 in a graphical format, click on Graph. This graph will display the total amount of unused memory in your cluster per given time.
With everything set up correctly, the sample cluster metric should look similar to the graph below.
Accessing then Grafana Dashboard
You may have noticed that the visualization capabilities of Prometheus are limited, as you are stuck with only a Graph option. Prometheus is great for scraping metrics from targets configured as jobs, aggregating those metrics, and storing them in a TSDB locally in the Ubuntu machine. But when it comes to standard resource monitoring, Prometheus and Grafana are a great duo.
Prometheus aggregates the metrics exported by the server components such as node exporter, CoreDNS, etc. While Grafana, with visualization being its strong suit, receives these metrics from Prometheus and displays them through numerous visualization options.
During the kube-prometheus stack helm deployment, Grafana had been automatically installed and configured, so you can configure access to Grafana on your Cluster.
To access your Grafana dashboard, you will first need to fetch your username and password stored as secretes automatically created by default in your Kubernetes cluster.
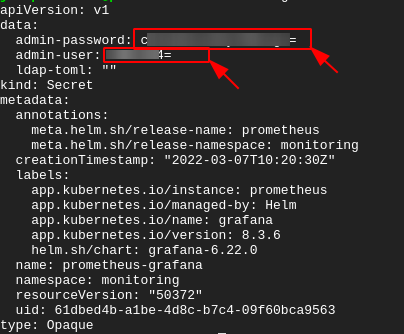
1. Run the following kubectl command to view data stored as secret in your Kubernetes cluster (prometheus-grafana) in YAML format (-o yaml).
kubectl get secret -n monitoring prometheus-grafana -o yamlAs you see below, the username and password for accessing your Grafana dashboard are encoded in base64. Note down the values of the admin-password and admin-user secrets as you’ll need to decode them in the next step.
2. Next, run each command below to --decode both secrets (admin-password and admin-user). Replace YOUR_USERNAME, and YOUR_PASSWORD with the admin-password and admin-user secret values you noted in step one.
This tutorial doesn’t have an output for each command due to security reasons.
# Decode and print the username
echo YOUR_USERNAME | base64 --decode
# Decode and print the password
echo YOUR_PASSWORD | base64 --decode
3. Run the kubectl command below to port-forward to a local port at 3000 by binding the Grafana port 80 to port 3000. Doing so provides you access to Grafana’s web UI on your browser.
kubectl port-forward svc/prometheus-grafana -n monitoring 3000:80Add the –address 0.0.0.0 flag if you are following along using an Ubuntu 20.04 machine hosted by a cloud provider.
4. Finally, on your browser, navigate to any of the endpoints below depending on your machine setup:
- or http://<YOUR_SERVER_IP>:3000 (cloud)
Enter your decoded secret value for admin-user and admin-password in the username and password in the space provided.
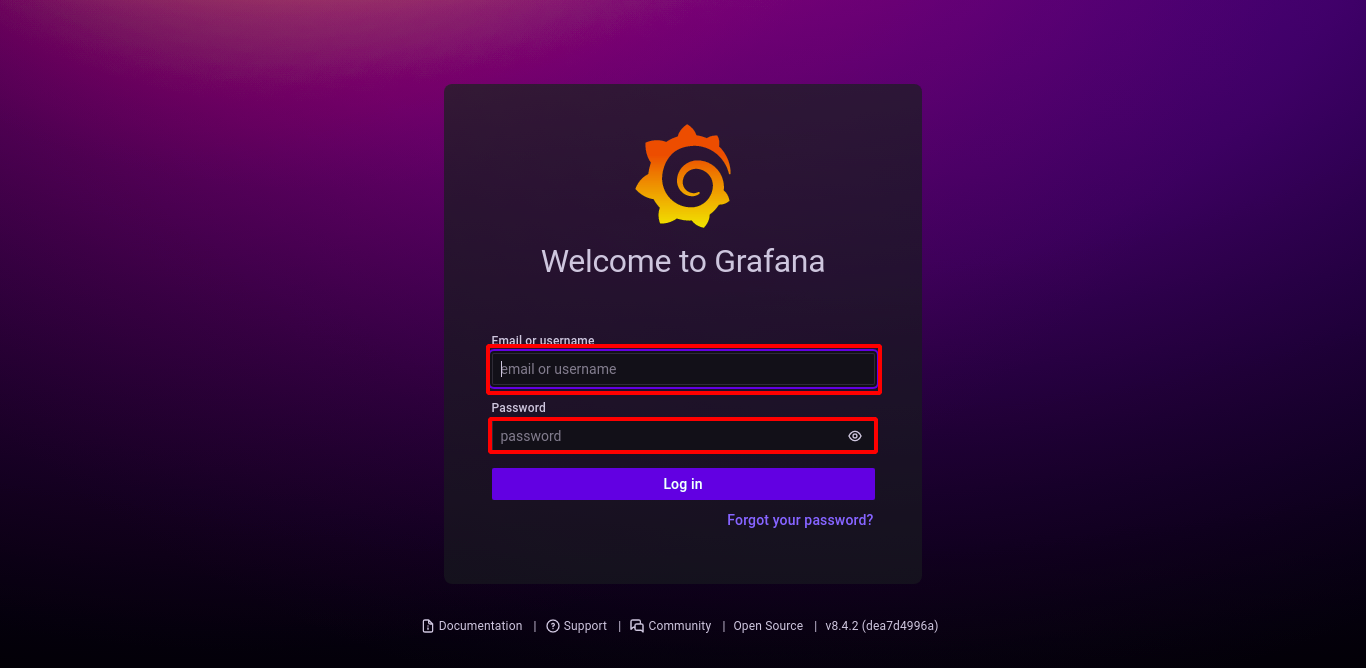
Once you are logged in, you’ll get the Grafana dashboard, as shown below.
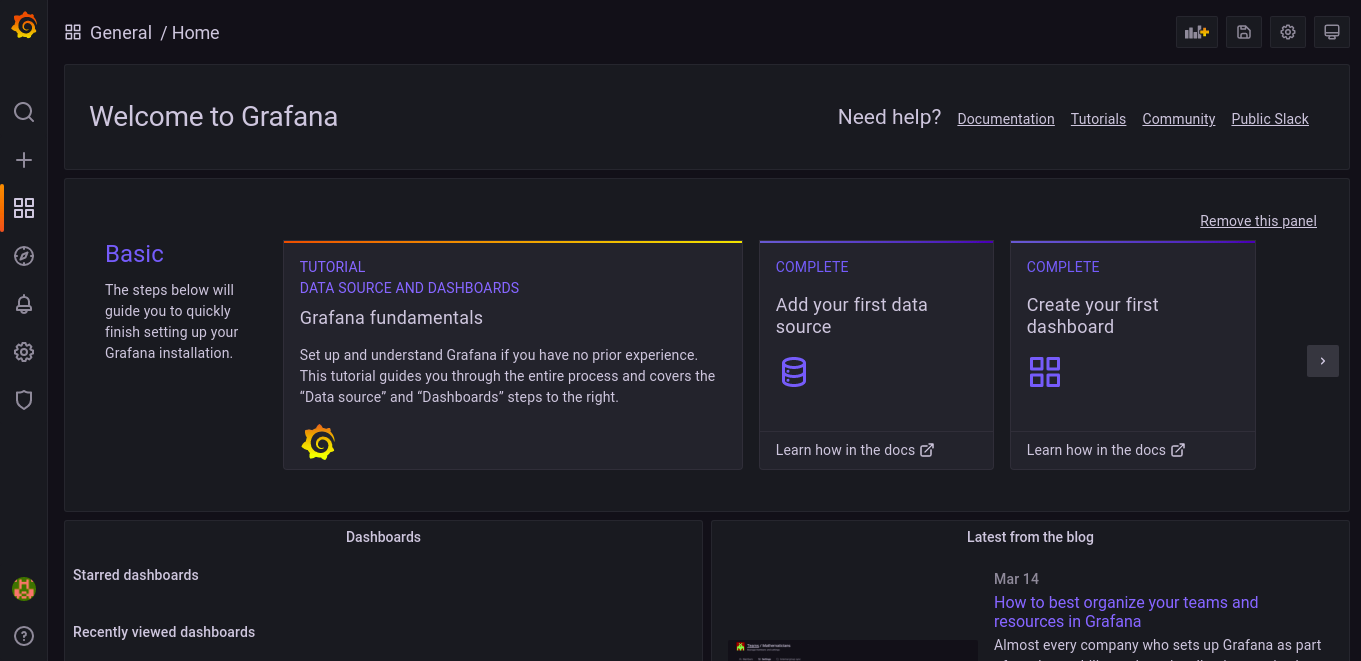
Interacting with Grafana
By default, the Kube-Prometheus stack deploys Grafana with some pre-configured dashboards for each target configured in Prometheus. With these pre-configured dashboards, you will not need to manually set up a dashboard to visualize each metric aggregated by Prometheus.
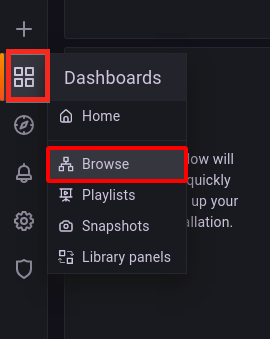
Click on the dashboard icon —> Browse and your browser redirects to a page where you’ll see a list of dashboards (step two).
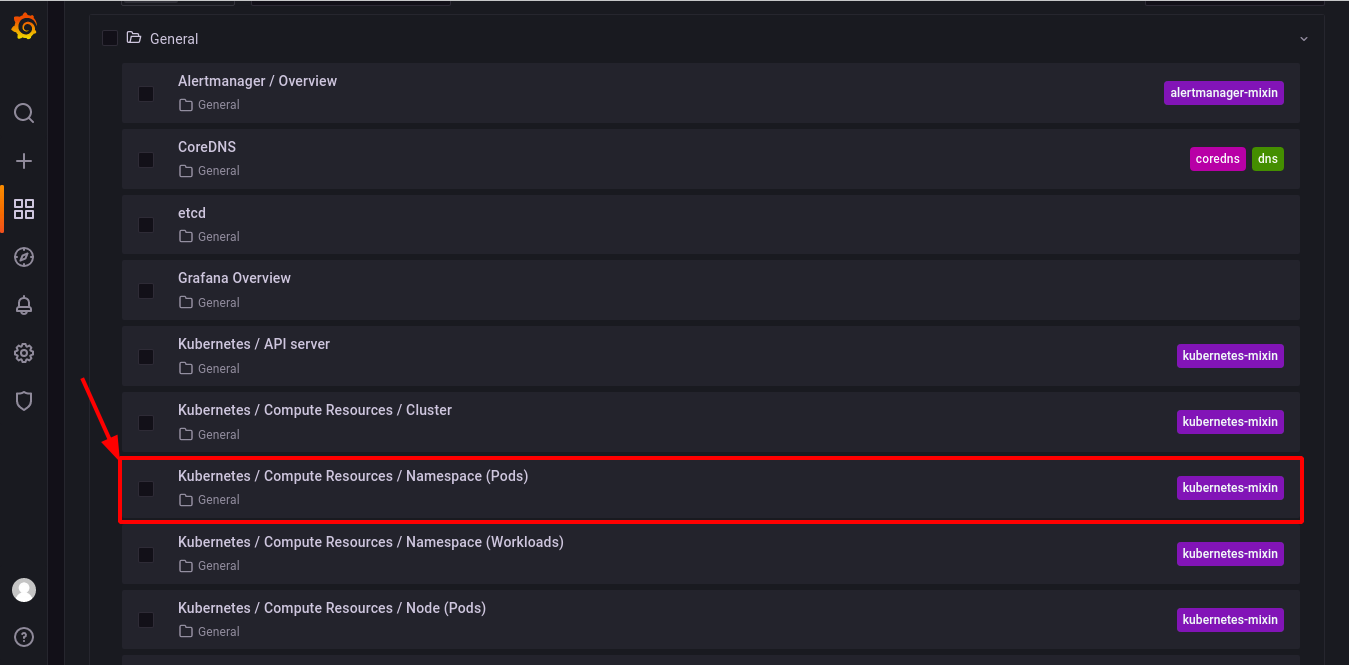
Click on any of the pre-configured dashboards below to view its visual compute resource. But for this tutorial, click on the Kubernetes / Compute Resources / Namespace (Pods) dashboard.
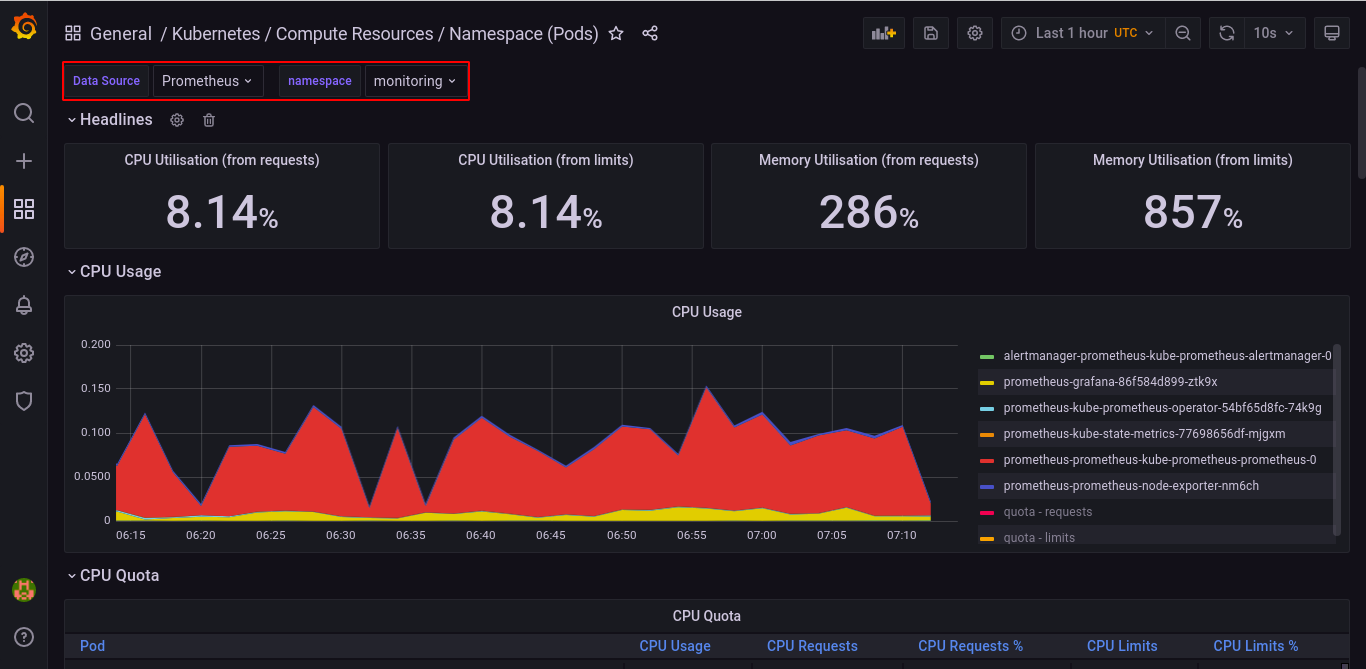
Below is a sample pre-configured dashboard for visualizing compute resource usage by Pods in any of the available namespaces.
For this tutorial, the Data source has been set to Prometheus and the namespace for visualization is set to monitoring.
Conclusion
In this tutorial, you’ve learned how to deploy the Prometheus operator using Helm and viewed your Cluster internal state metrics to monitor your Kubernetes cluster. You’ve also configured Grafana and viewed your Cluster metrics by configuring your Grafana dashboard.
At this point, you already have fully functional Kubernetes cluster monitoring. But you can personally improve on this newfound knowledge, like configuring Alertmanager with Slack to receive real-time alerts.


