


Monitoring systems that allow you to monitor both networking devices and servers are essential in keeping your servers in tip-top shape. And if you do not have a monitoring system yet, why not consider Pandora FMS?
The Pandora FMS is an open-source monitoring tool that can be used to monitor networking devices, servers, and various applications. And in this tutorial, you will learn how to proactively monitor your server.
Ready? Stay tuned and keep tabs of your server activities real-time!
Prerequisites
This tutorial will be a hands-on demonstration. To follow along, ensure you have the following:
- Two Rocky Linux Servers – This tutorial uses Rocky Linux 8.4 (Green Obsidian). Below are the details of the Rocky Linux servers:
| Hostname | IP Address | Used as |
| pfms-rocky | 192.168.5.50 | Pandora FMS Server |
| machine1 | 192.168.5.20 | Target Monitoring |
- A non-root user with sudo privileges on both servers.
Installing Pandora FMS via the Installer Script
Pandora FMS supports high-availability monitoring for large datacenter and infrastructure. But before taking advantage of this monitoring tool, you must first install it on your server.
Pandora FMS can be installed in two ways:
- Manual – This option takes time since you will install Pandora FMS for each component, but gives you an insightful installation process.
- Automatic – This option lets you run an installer script, which is recommended by the official Pandora FMS Documentation.
But in this tutorial, you will install Pandora FMS via the installer script as follows:
1. Log in to your Pandora FMS server via SSH.
2. Next, run the below su command to grab the root privileges. This command does not produce output but changes your prompt to root.
sudo su3. Once you are on the root, run the below env command to install the Pandora FMS monitoring Tool.
This command downloads the Pandora FMS installer script and runs it on your system. Be sure to adjust the following environment variables with your current environment.
env TZ='Europe/Stockholm' \
 DBHOST='127.0.0.1' \
 DBNAME='pandora' \
 DBUSER='pandora' \
 DBPASS='pandora' \
 DBPORT='3306' \
 DBROOTPASS='pandora' \
 MYVER=57 \
 PHPVER=8 \
 SKIP_PRECHECK=0 \
 SKIP_DATABASE_INSTALL=0 \
 SKIP_KERNEL_OPTIMIZATIONS=0 \
 PANDORA_SERVER_PACKAGE="https://firefly.artica.es/centos8/pandorafms_server-7.0NG.760.noarch.rpm" \
 PANDORA_CONSOLE_PACKAGE="https://firefly.artica.es/centos8/pandorafms_console-7.0NG.760.noarch.rpm" \
 PANDORA_AGENT_PACKAGE="https://firefly.artica.es/centos8/pandorafms_agent_unix-7.0NG.760_x86_64.rpm" \
 PANDORA_BETA=0 \
 sh -c "$(curl -fsSL <https://pfms.me/deploy-pandora-el8>)"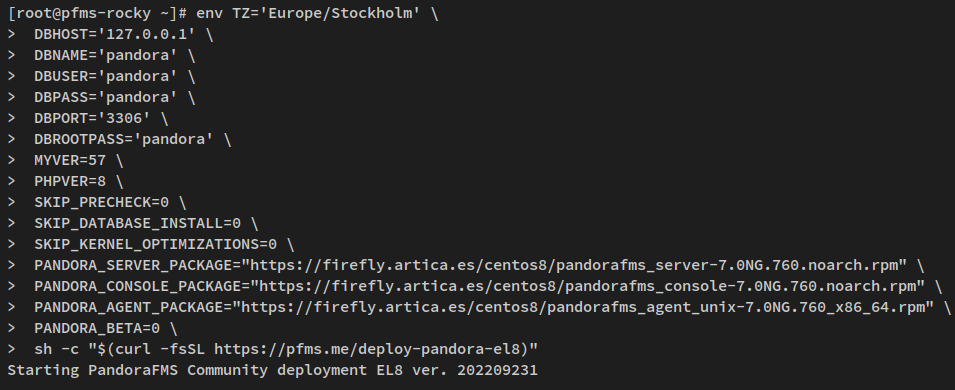
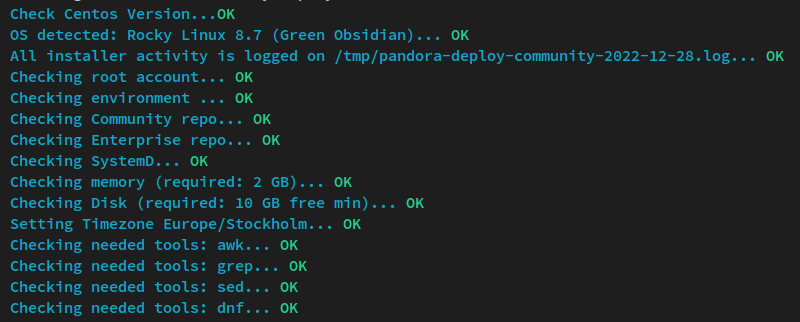
At first, the installer automatically detects your operating system (OS) and checks some basic tools for the Pandora FMS installation. Ensure the status for each process is OK, as shown below.
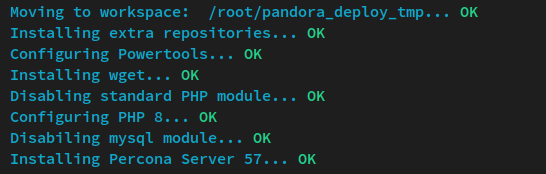
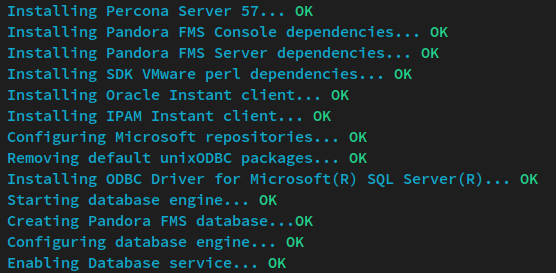
The installer then sets up additional repositories and installs dependencies for Pandora FMS.
Once dependencies are installed, the installer script downloads and installs Pandora FMS packages. The installer script starts services, such as httpd, php-fpm, mariadb, and pandora_server.
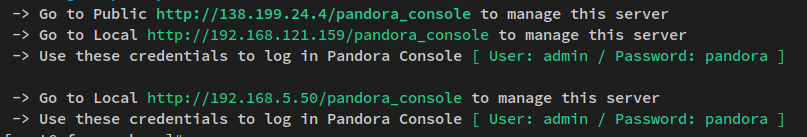
After Pandora FMS is installed, you will see the default Pandora FSM administrator user admin with the password pandora.
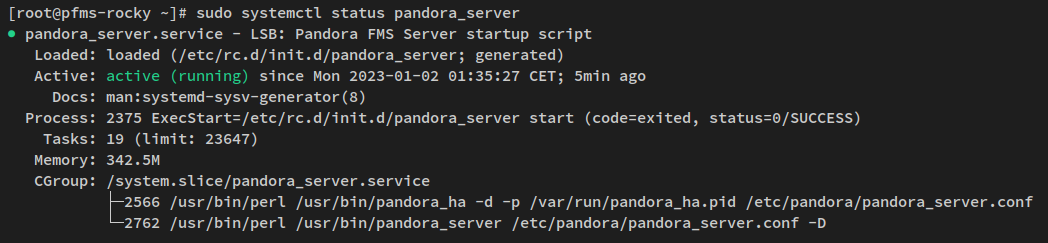
4. Now, run the systemctl status command below to verify the Pandora FMS service (pandora_server) and ensure that the service is running.
sudo systemctl status pandora_serverIf the pandora_service runs, you will see an output like the one below.
Logging in to Pandora FMS Administration Dashboard
With the Pandora FMS installed, you will then visit and log in to your Pandora FMS to ensure the installation is successful. Moreover, you must change the default password of the Pandora FMS admin user to strengthen your Pandora FMS security.
To access your Pandora FMS administration dashboard:
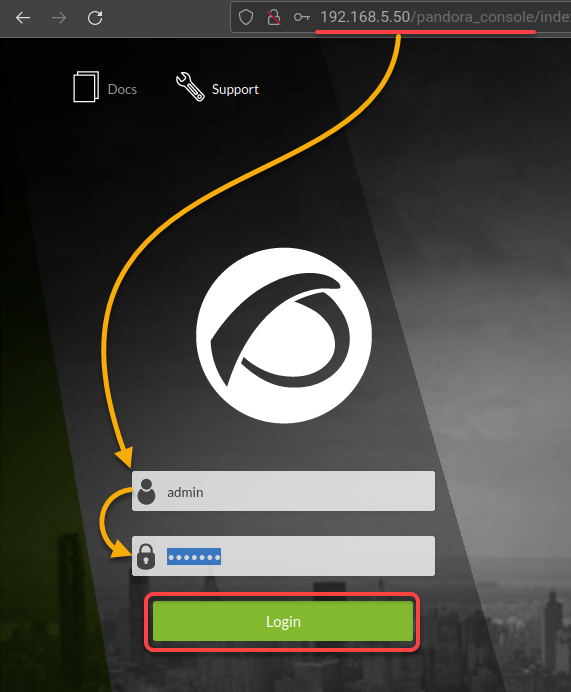
1. Open your favorite web browser and visit your Pandora FMS Server IP address followed by the URL path /pandora_console (i.e., http://192.168.5.50/pandora_console/).
Input the default user admin with the password pandora, and click Login to log in to the Pandora FMS dashboard.
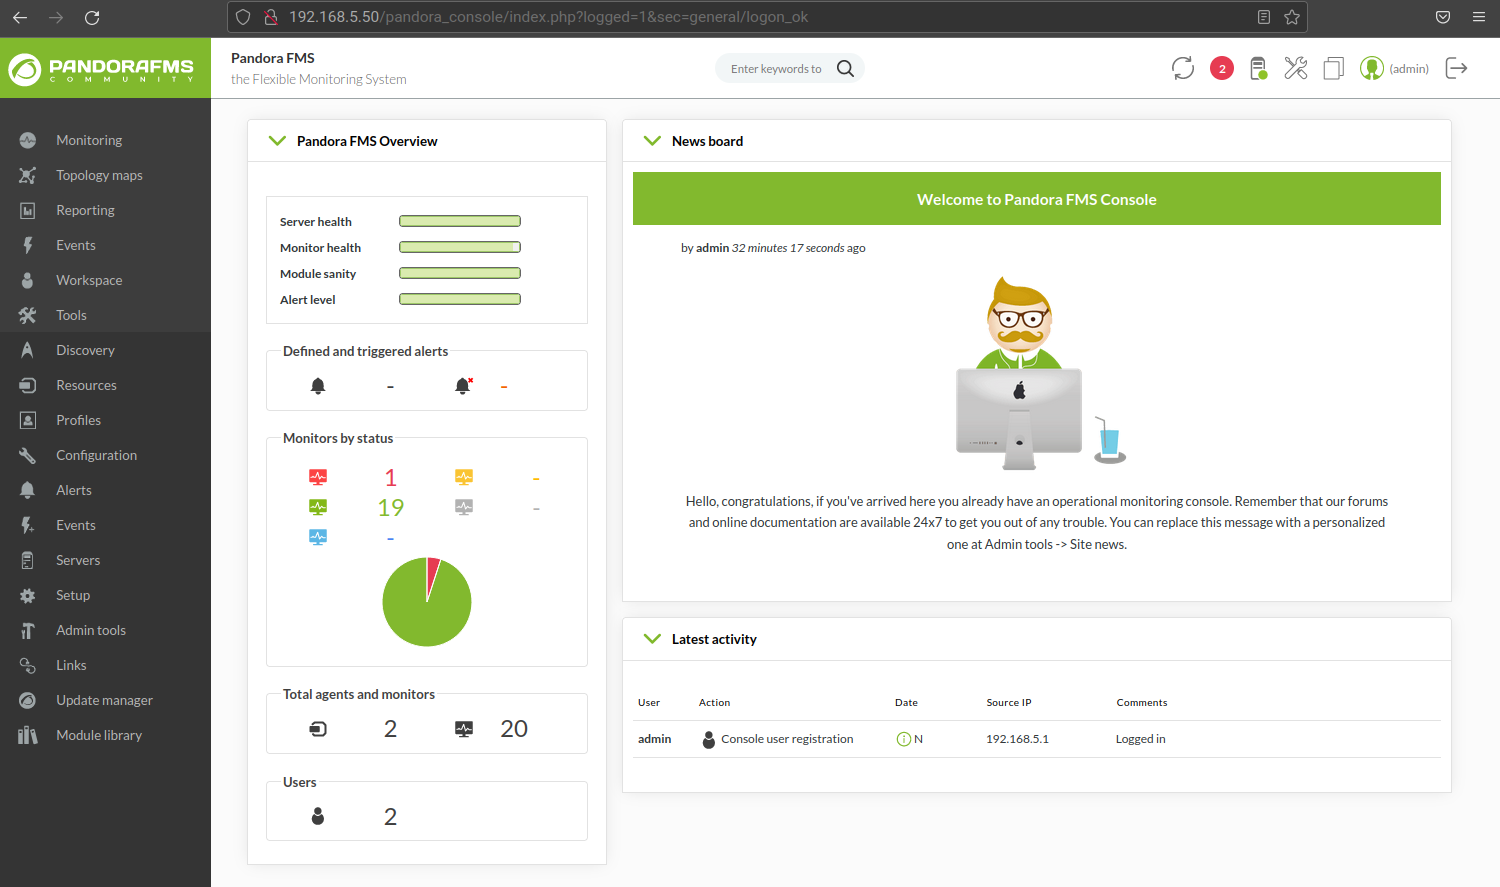
Once logged in, you will see the following page, the Pandora FMS administration dashboard.
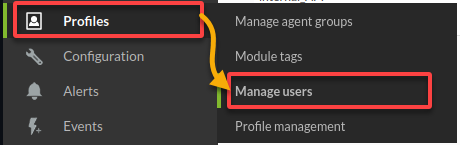
2. Next, click Profiles (left pane) → Manage users, redirecting your browser to the USER MANAGEMENT page where you can modify user information.
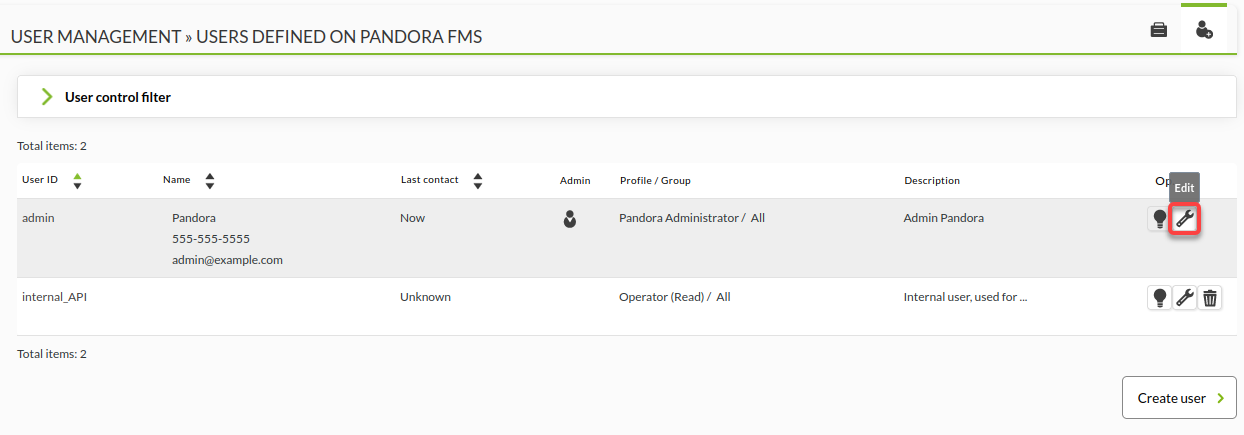
3. Click the edit/setting button to modify the default admin user. You must change the default Pandora FMS admin password to secure your deployment.
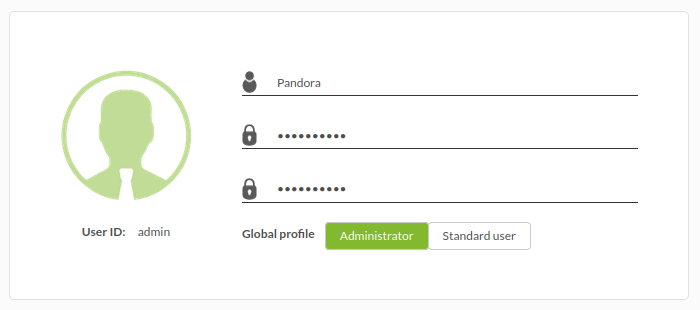
4. Now, input and confirm the new password for your Pandora FMS server. Remember that setting a strong password is always the golden rule when providing credentials.
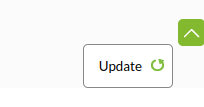
5. Lastly, scroll to the bottom of the page and click Update (bottom-right) to confirm changing the password.
When the update is successful, you will see a message confirmation like the one below.
Monitoring Servers via the Pandora FMS Agent
Without visibility into your servers’ activity can lead to everything going haywire. With this demand, server monitoring is crucial in keeping your business systems running. Luckily, Pandora FMS addresses both immediate and unforeseen operational issues.
The Pandora FMS supports two types of monitoring:
- Agent-based monitoring – executed locally and sends the result to the Pandora FMS server via software agent.
- Remote – executes processes through network checks.
But in this example, you will monitor a Rocky Linux host (machine1) via the former, the Pandora FMS agent, as follows:
1. Log in to the machine1 server, and run the below dnf install command to install package dependencies for the Pandora FMS agent.
sudo dnf install -y unzip perl-Sys-Syslog perl-Archive-Zip perl-IO-Compress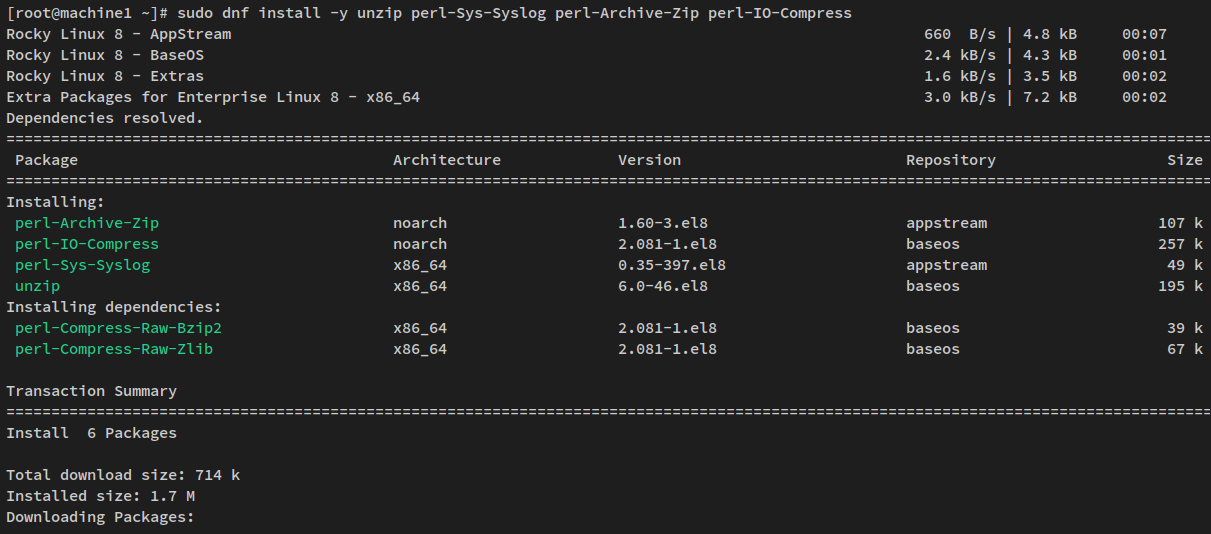
2. Next, run the following rpm command to install the Pandora FMS agent.
sudo rpm -Uvh http://firefly.artica.es/pandorafms/latest/RHEL_CentOS/pandorafms_agent_unix-7.0NG.noarch.rpm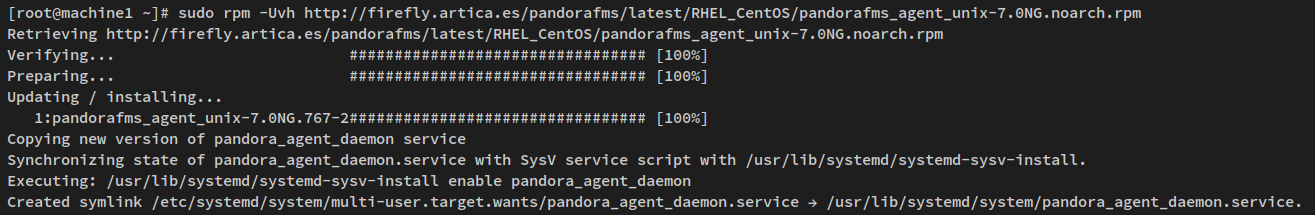
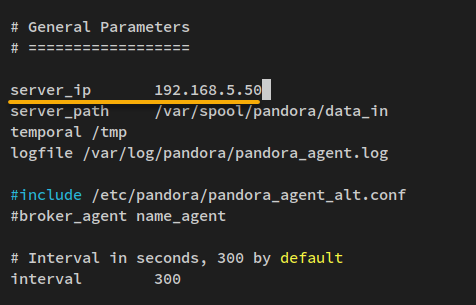
3. Once installed, open the Pandora FMS agent config file /etc/pandora/pandora_agent.conf using your preferred editor.
On the top of the line, change the server_ip value with your Pandora FMS server’s IP address, as shown below, save the changes and close the file.
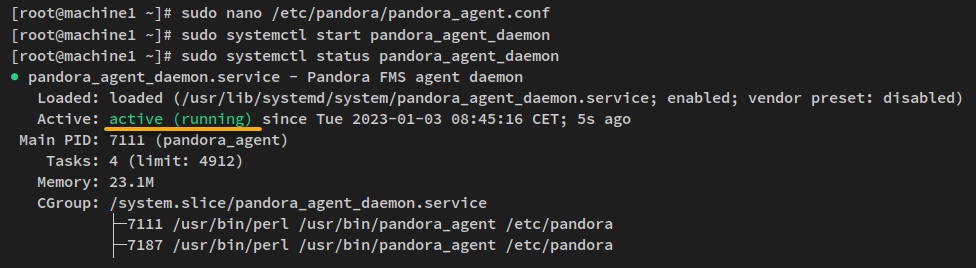
4. Now, run the below systemctl commands to start and verify the pandora_agent_daemon service is running.
sudo systemctl start pandora_agent_daemon
sudo systemctl status pandora_agent_daemon
The output below confirms the pandora_agent_daemon is running.
Checking the Target Monitoring via the Pandora FMS Dashboard
You have just added a Rocky Linux (machine1) to the Pandora FMS server via agent-based monitoring. But what comes next? You will have to verify the list of agents on the Pandora FMS server and ensure that the monitoring is successful.
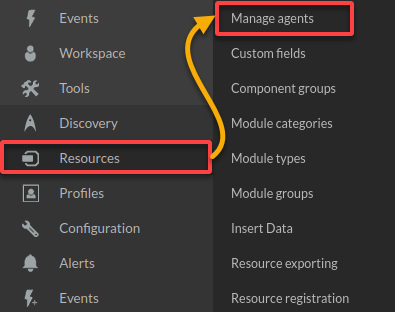
1. Click the Resource menu on the Pandora FMS administration dashboard and select Manage Agents. Your browser redirects to a page where you can see the list of available agents (step two).
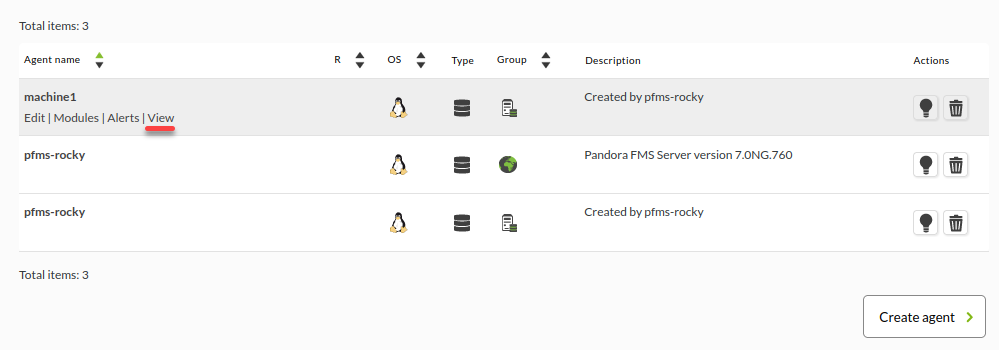
2. Next, click View under the machine1 node, as shown below, to access the node.
Seeing the machine1 node available on the list of agents indicates you have successfully monitored the machine1 node via the Pandora FMS Agent.
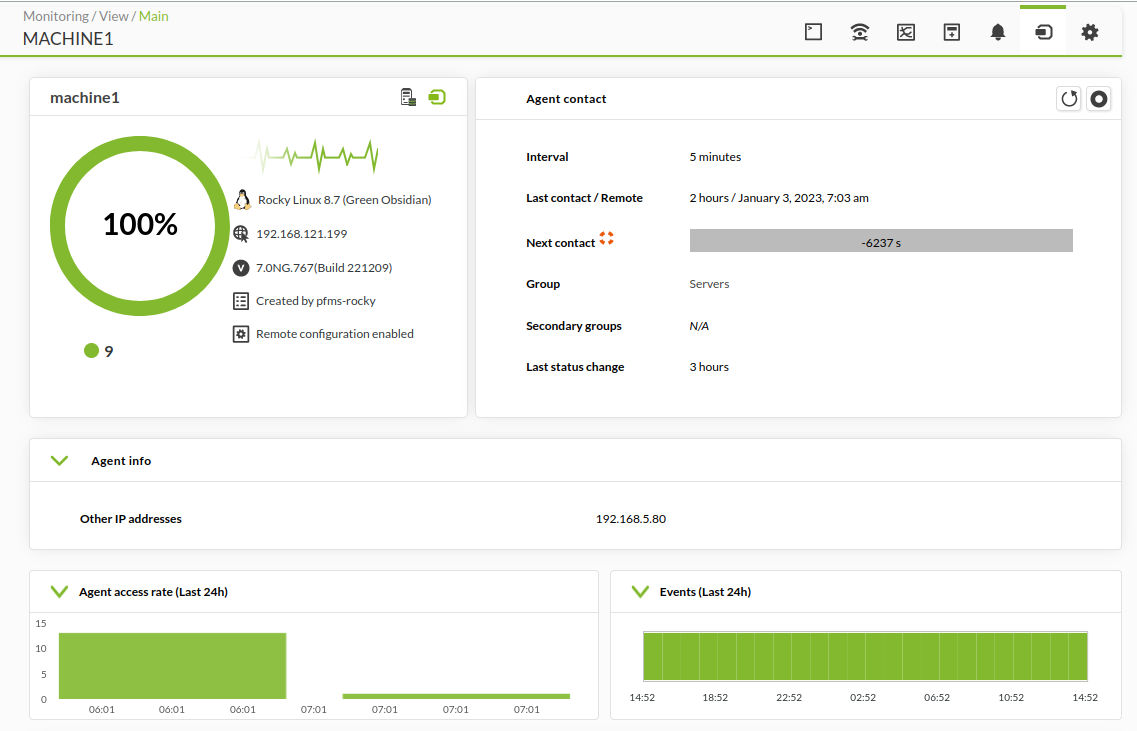
At the top of the page, you will see information about the machine1 node, like in the image below.
3. Lastly, scroll to the bottom page to get a list of enabled modules for monitoring the machine1 node.
Below, you can see enabled modules for monitoring CPU, memory, disk usage, system load, and swap usage.

Conclusion
Secure server monitoring undoubtedly is a top priority, which Pandora FMS provides. And in this tutorial, you have seen how the Pandora FMS dashboard helps you monitor and assess your servers in one place and in real time.
With this newfound knowledge, why not add target monitoring via SNMP protocol for networking devices? At the same time, you can secure Pandora FMS with SSL/TLS certificates and set up notifications or alerting systems for any events via email or SMS.


