


The Kubernetes dashboard is an effective way of monitoring a Minikube cluster. Did you know that you can manage the cluster and its resources from the dashboard, apart from viewing utilization and cluster-specific parameters? Minikube Dashboard is the thing!
Read on as you create and destroy pods, services, and many more resources via the dashboard – tasks you would otherwise have performed with the command line.
Prerequisites
This tutorial will be a hands-on demonstration. If you’d like to follow along, be sure you have the following:
- A container or a virtual machine manager, such as Docker, KVM, Hyper-V, Podman, or VirtualBox – This tutorial uses Docker v20.10.12. Install Docker with this tutorial if you do not already have any of the alternatives installed.
- Minikube – This article uses version v1.25.2 which comes with Kubectl automatically.
- Install MiniKube and Kubectl by following the related article link below if you do not already have them.
Creating a MiniKube Cluster
With the prerequisites successfully installed, you can now start playing with MiniKube. To begin, you’ll start by creating a Kubernetes cluster.
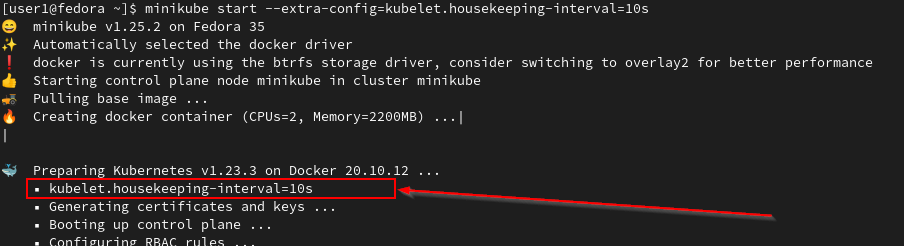
Open a terminal session and run the below command. This command creates a Kubernetes cluster.
The -extra-config=kubelet.housekeeping-interval=10s switch enables showing the CPU utilization metrics in the dashboard.
minikube start --extra-config=kubelet.housekeeping-interval=10s
Changing the housekeeping interval of a cluster is an optimization decision by the developers of Minikube. You can read more about it from Minikube’s issue tracker. A fix for this side effect has been tested and should be included in later versions.
The command will automatically set up a single node cluster running inside a Docker container, as shown below.
Enabling the Dashboard and Metrics-Server Addons
Minikube comes with several Kubernetes tools installed as add-ons to simplify the development process.
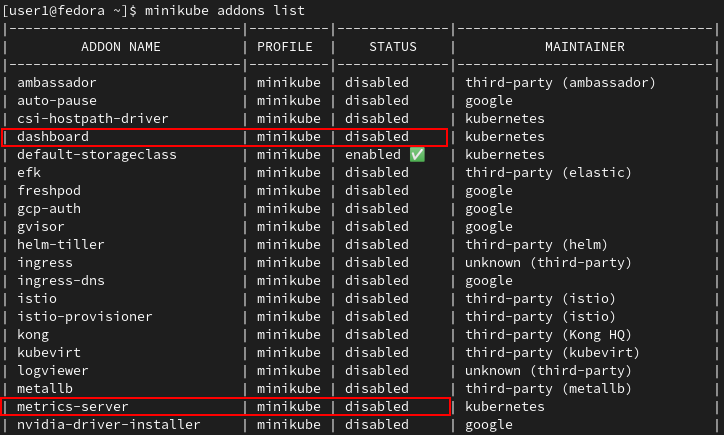
1. Run the minikube addons command below to list all installed add-ons. minikube addons list
minikube addons listYou should see an output similar to the one in the image below. The dashboard and metrics-server addon’s status are disabled by default on a new Minikube cluster.
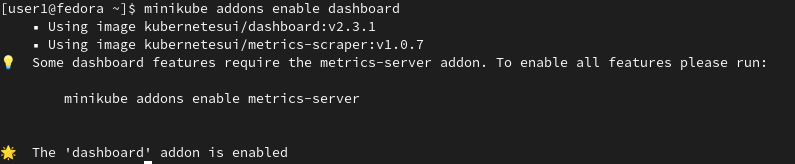
2. Enable the dashboard using the minikube addons command below.
minikube addons enable dashboardThe feedback should be similar to the shot below.
3. Enable the metrics-server add-on by using the following minikube addons command. Metrics-server enriches the dashboard by aggregating and providing access to more data about the node and running pods.
minikube addons enable metrics-serverAs shown below, you will see a notification once the metrics-server addon becomes enabled.

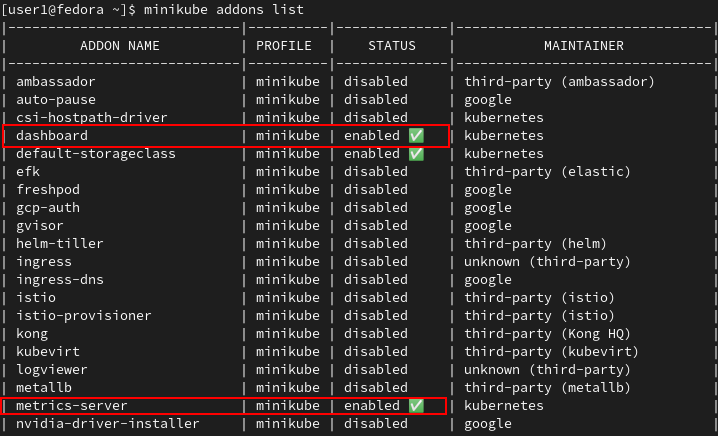
4. Rerun the minikube addons list command to confirm both addons are now enabled, as shown below.
Launching the Kubernetes MiniKube Dashboard
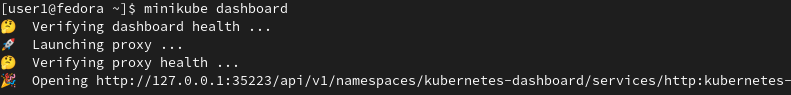
Execute the minikube dashboard command shown below to automatically launch the dashboard in your default web browser.
minikube dashboard
After waiting a few minutes, you should have feedback in the terminal window showing the dashboard has started.
Your browser should also open to the dashboard, as shown below.
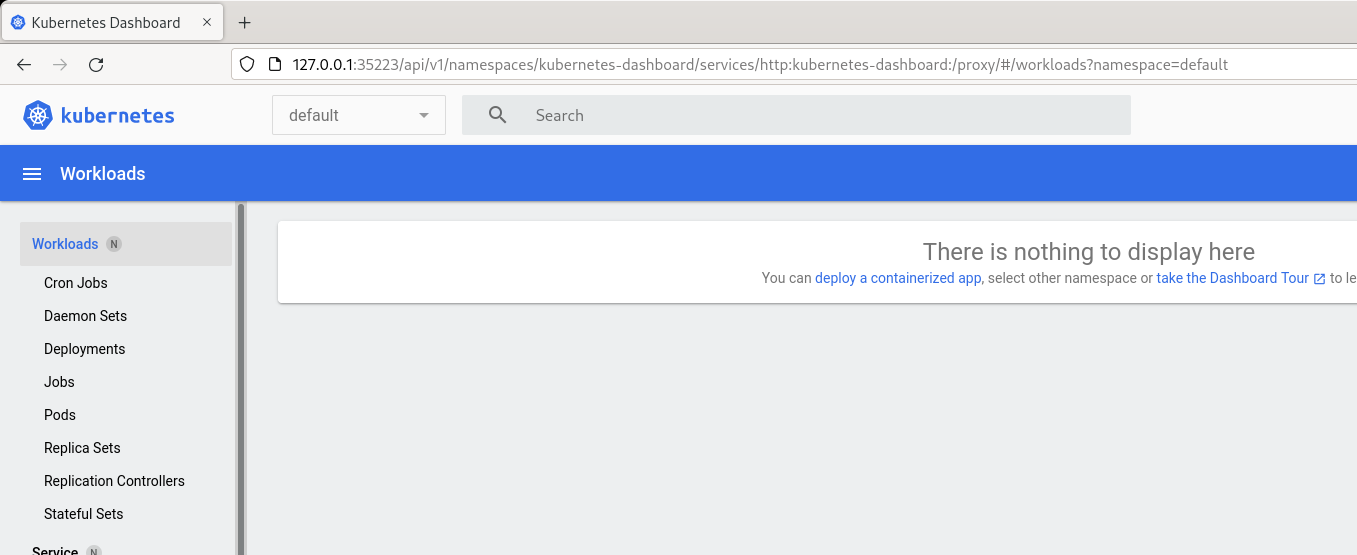
Usually, the browser window should open automatically. If it does not, for whatever reason, you can copy the dashboard’s address from the terminal and manually open it in a browser.
Creating a Deployment in the Minikube Dashboard
In addition to getting performance data on your cluster, you will, in this section, create and manage a web service deployment via the dashboard.
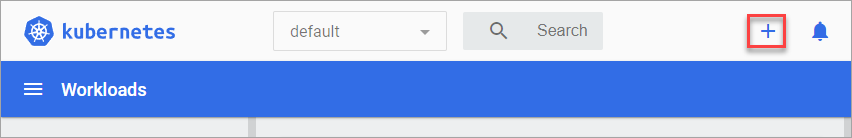
1. Click the Create New Resource button to create a new deployment, as shown below.
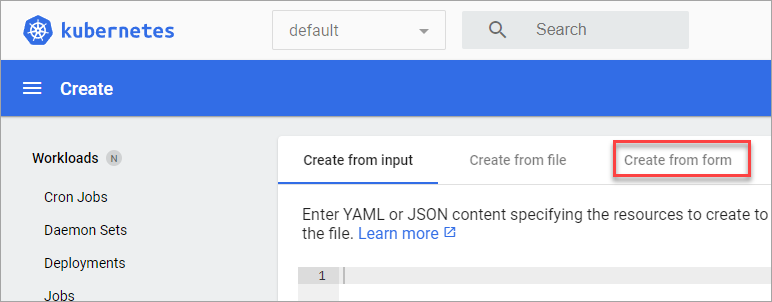
2. Click the Create from form tab to create the deployment by filling out a form instead of declaratively via YAML or JSON files.
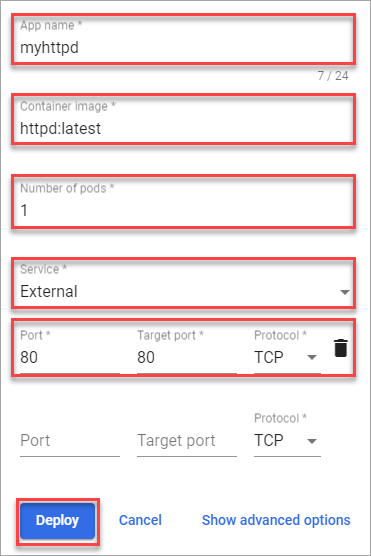
3. Type in the corresponding parameters for the deployment as shown below
- App name: The name of the deployment. This tutorial uses
myhttpd. - Container Image: Defines the base image for the deployment. For this tutorial, enter
httpd:latest. - Number of pods: Specifies how many pods to include in the deployment. Leave the value to
1for now. - Service: Select show to expose the deployment. Select
Externalto expose the web service outside the cluster using a Loadbalancer service. Doing so allows accessing the service via the web browser. - Set both the Port and Target ports values to
80.
Your form’s final entries screen should look like the shot below. Now, click Deploy to initiate the deployment.
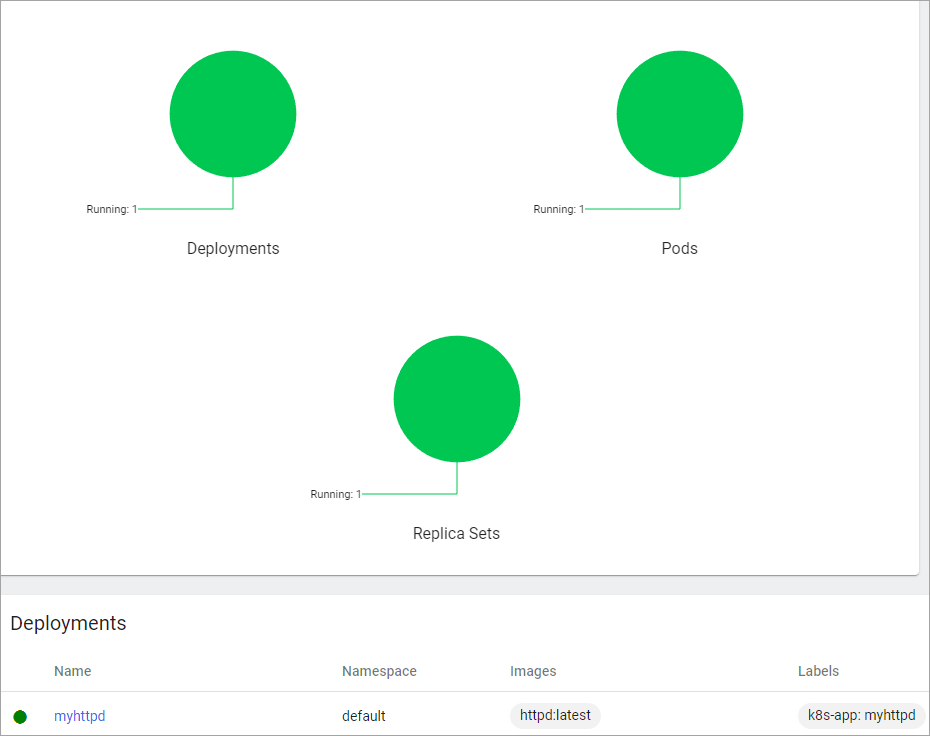
Monitor the progress of the deployment on the Workloads dashboard. After a few minutes, the status should transition from an immediate amber to a lively green.  Monitoring a successful deployment
Scaling and Managing Containers in the MiniKube Dashboard
With the deployment now complete, it is time to perform some of the cluster management tasks you would have performed over the command line (if you didn’t have the Mnikube dashboard). First, scale the deployment out with the following steps.
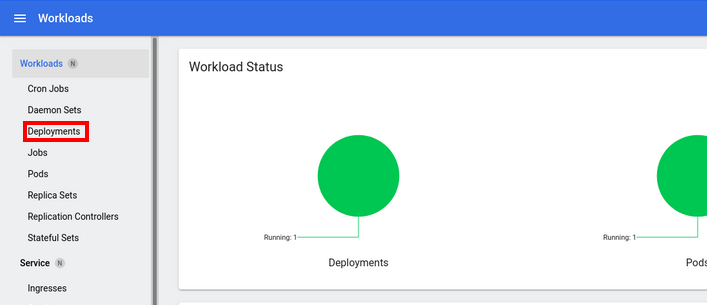
1. Click Deployments on the navigation bar on the left-hand side of the browser window.
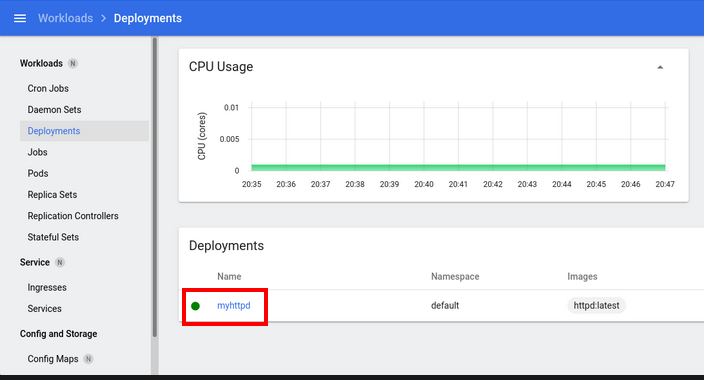
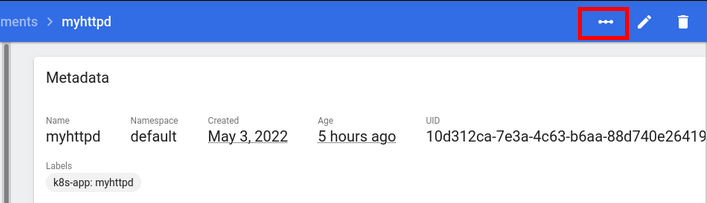
2. Click myhttpd under the Deployments section, which is the deployment you set up earlier.
3. Click the Scale Resource icon near the top-right corner, as shown in the following screenshot.
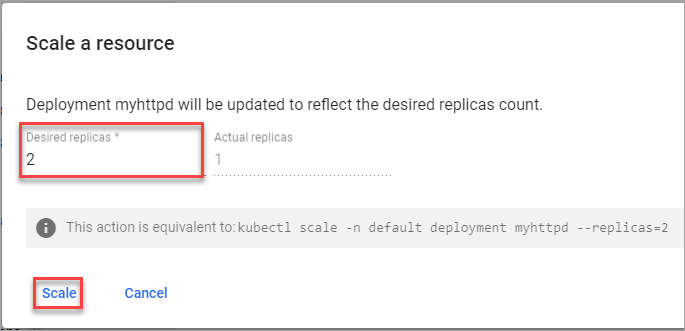
4. Set the Desired replicas value to 2 to scale out the deployment. Doing so increases the replica count from 1 (current) to 2. Click Scale to effect the changes.
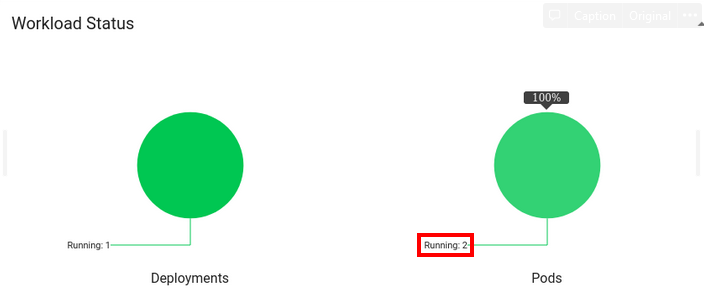
5. Click the Workload Status link on the navigation pane and confirm the dashboard reflects the changes. You should see two running pods in the deployment.
Obtaining the IP Address of the Node from the MiniKube Dashboard
The IP is one way of reaching the services within the cluster. Finding out a node’s IP address typically requires you to run commands. But now that you have the dashboard, you can conveniently view that information.
Follow the steps below to get the IP of your cluster.
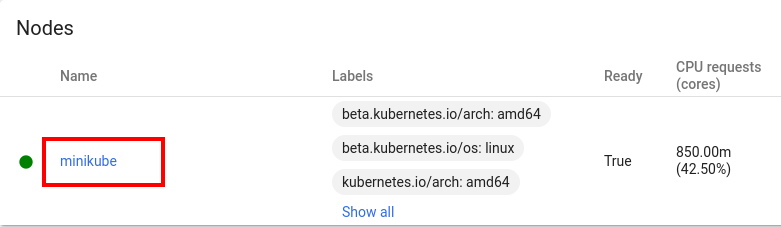
1. Click Nodes from the navigation bar on the right of the dashboard as below.
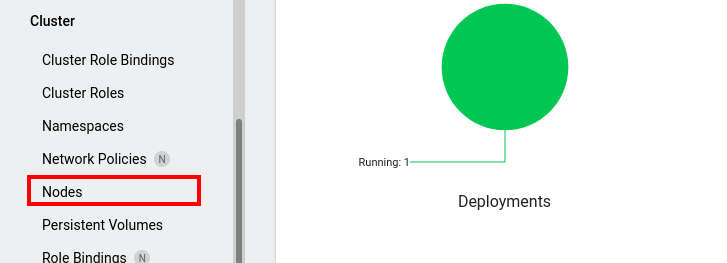
2. Click the minikube link under the Nodes card.
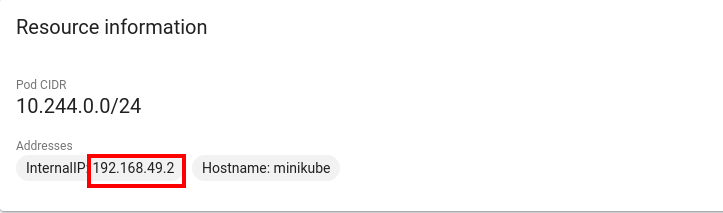
3. Scroll down to the Resource information card and find the node’s IP address.
Listing Existing Services
You attached a LoadBalancer service to the deployment by selecting External while creating the deployment. You can see the list of services for your deployment by following the steps below.
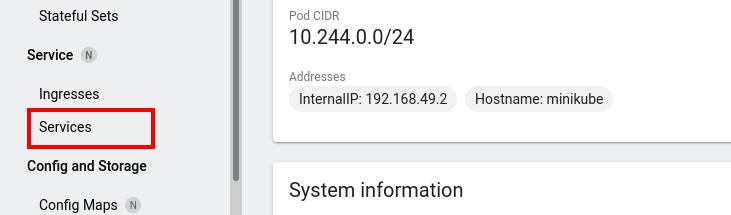
1. Click Services on the navigation bar.
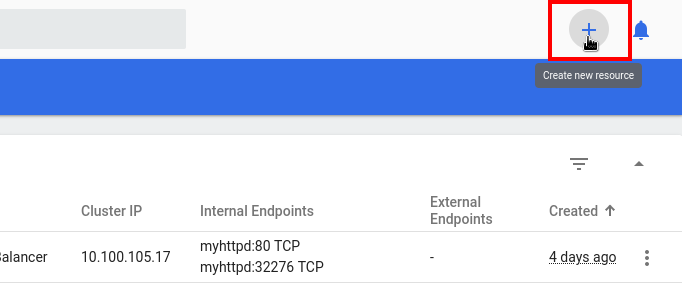
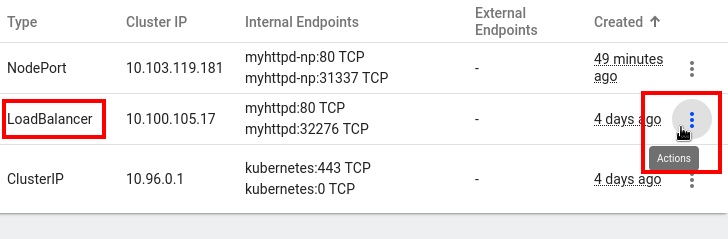
2. You should see a list similar to the image below confirming the service type for myhttpd is LoadBalancer. Take note of the port number that maps the service externally. In this example, the port number is 32276.
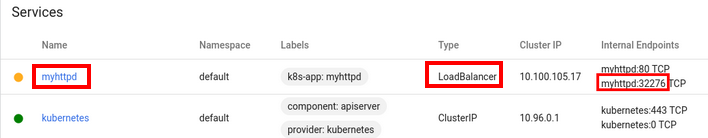
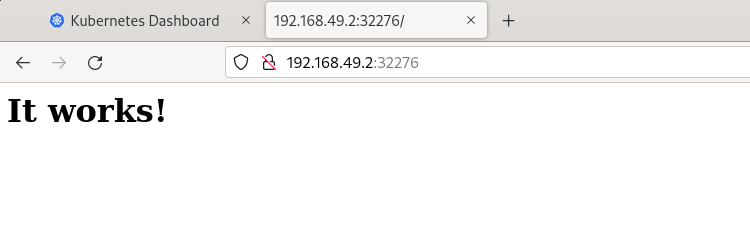
Now, open a new browser window or tab and navigate to HTTP://<node_internal_ip>:external_port. In this example, the URL is http://192.168.49.2:32276.
Editing Pod Resources
LoadBalancer services usually are for production use in cloud environments where you can find an actual load balancer serving the cluster. But, in development environments, the more common way to expose deployments quickly is through the NodePort service. Create a Nodeport service by following the steps below.
1. Click the Create New Resource button as shown below.
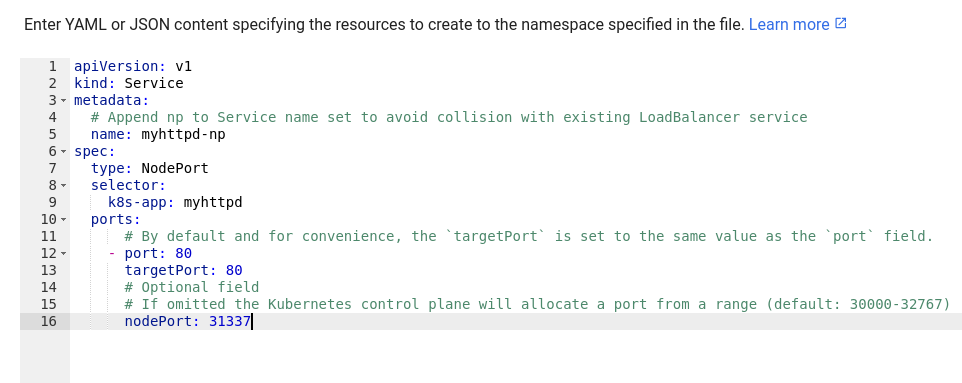
2. Copy the YAML code below and paste it into the embedded editor. This YAML code declares a NodePort Service. The NodePort will make the web service, which is listening on TargetPort 80, available externally on port 31337
apiVersion: v1
kind: Service
metadata:
# Append np to Service name set to avoid collision with existing LoadBalancer service
name: myhttpd-np
spec:
type: NodePort
selector:
k8s-app: myhttpd
ports:
# By default and for convenience, the `targetPort` is set to the same value as the `port` field.
- port: 80
targetPort: 80
# Optional field
# If omitted the Kubernetes control plane will allocate a port from a range (default: 30000-32767)
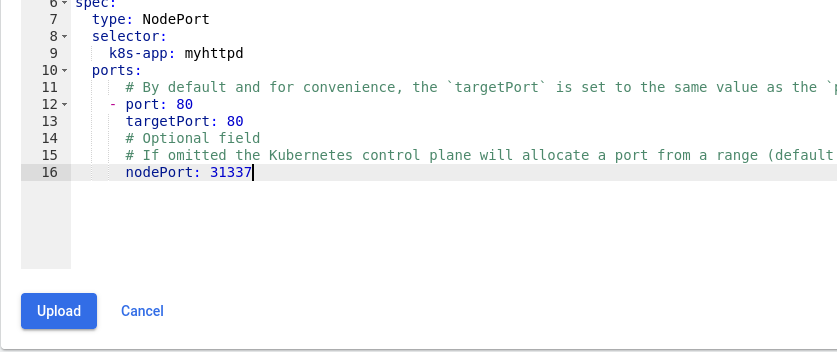
nodePort: 31337Your screen should look similar to the screenshot below.
3. After editing, click the Upload button to apply the definition and create the service.
4. Scroll to the Services section of the Workloads dashboard to see the status of the NodePort. The service status should turn green to signify success.
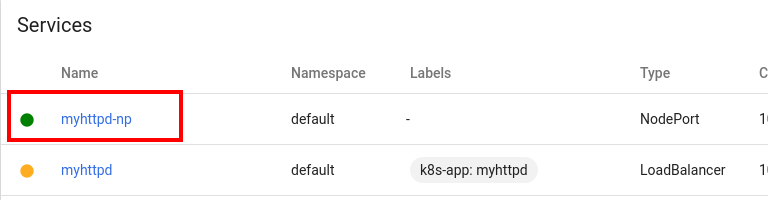
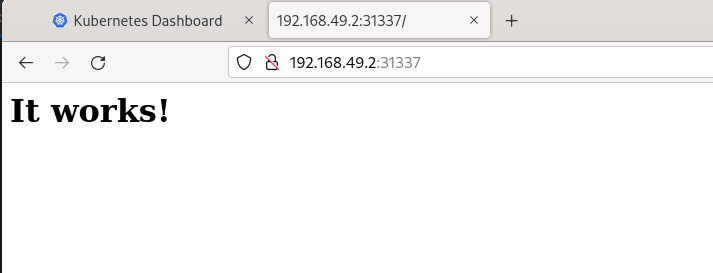
5. In your browser, open the external URL, http://192.168.49.2:31337, to confirm the web service is available.
Deleting a Resource
With the NodePort correctly set up for external access, you can now delete the LoadBalancer service.
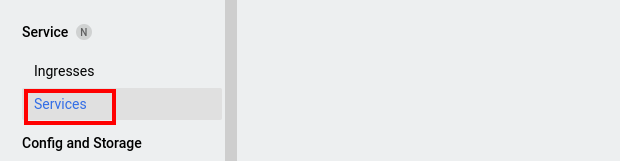
First, click the Services link in the navigation menu of the Dashboard.
Next, click the Actions menu on the right-most of the myhttpd LoadBalancer service and click Delete.
Monitoring Pod Resource Utilization
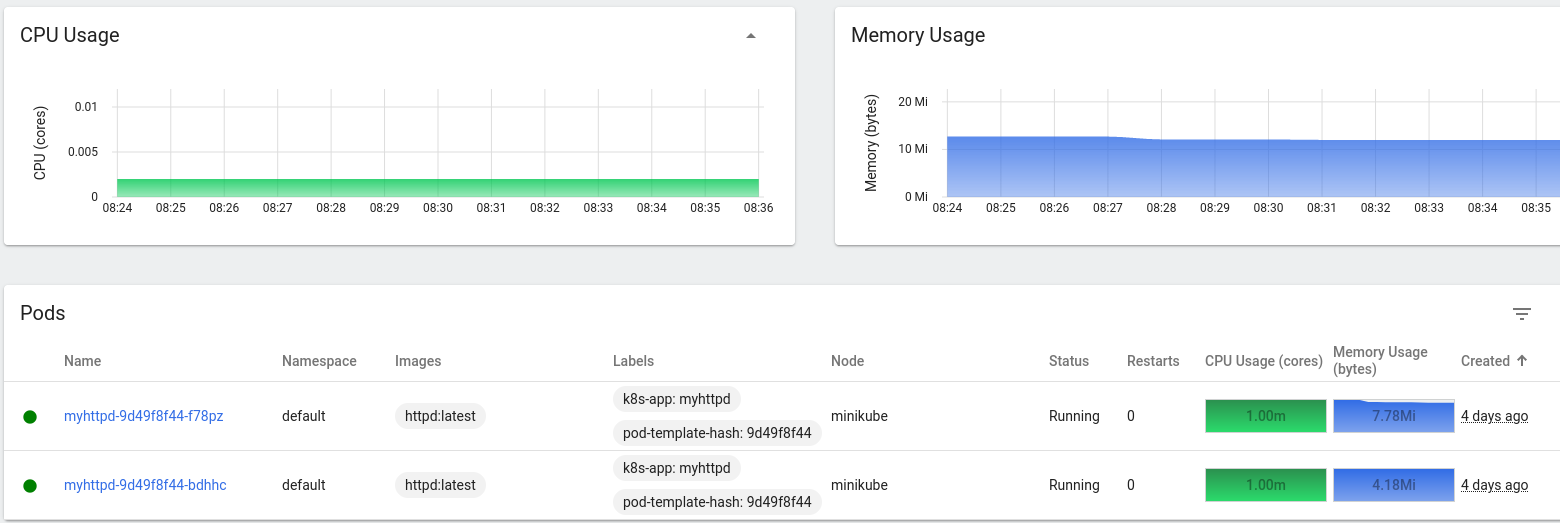
A vital part of managing Pods is monitoring resource utilization. Luckily, the dashboard allows you to view these resources with statistical graphs.
Click Pods on the navigation menu. You should see the charts for the CPU and Memory usage.
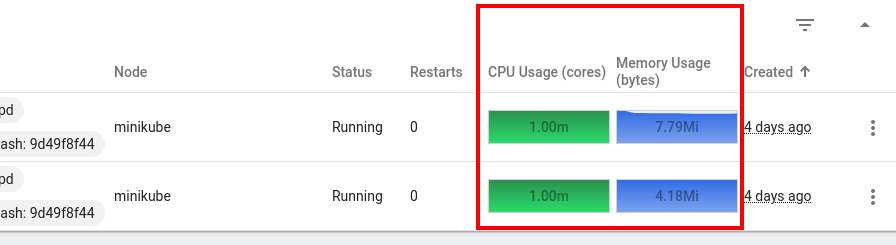
Zoom in to the Pods Card to see metrics per pod.
Reading Container Logs From the Dashboard
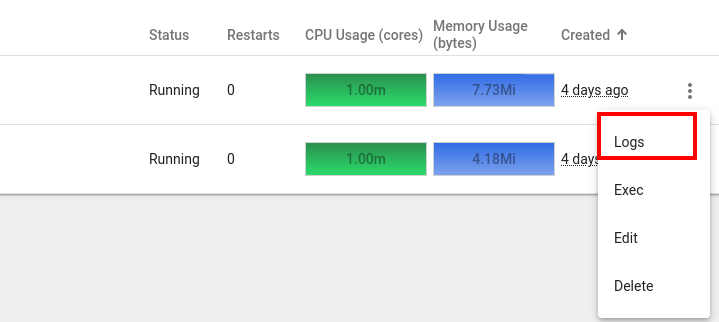
Logs are an excellent troubleshooting reference and could help to investigate events quickly. And in such a situation, you can read the logs for a specific container from the Pods cards.
1. Click the Actions menu for the pod whose logs you want to see and click Logs.
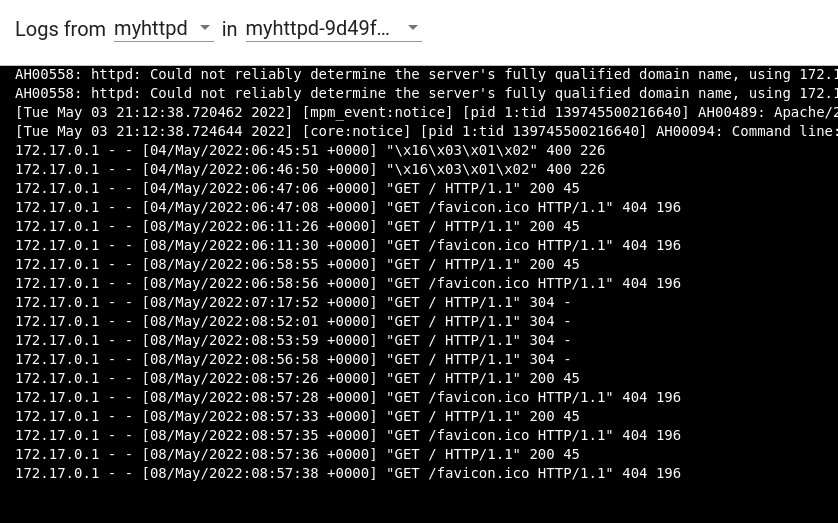
2. Explore logs from the viewport as shown below.  Viewing the Pod’s logs
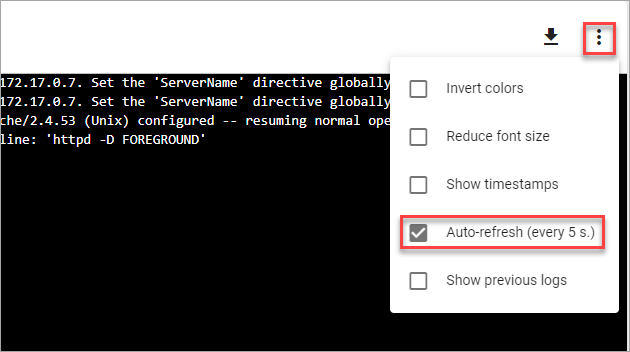
3. Click the options menu at the top-right and check the Auto-refresh box to enable refreshing the logs every 5 seconds.
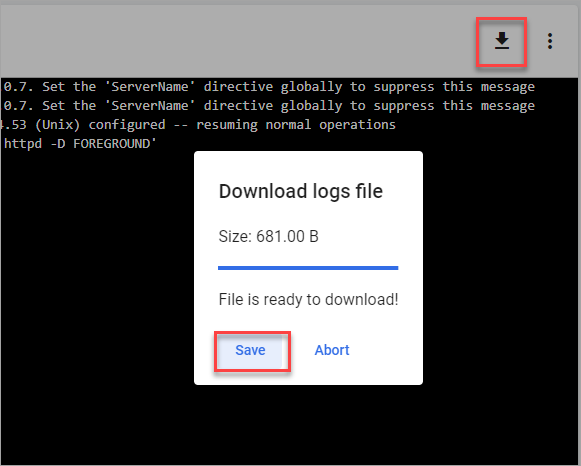
4. Lastly, click the Download button at the top and click Save to download or export the logs. You now have a copy of the logs that you could share, analyze, parse, or archive.
Conclusion
You have learned to effectively create, scale, and edit deployments with the Kubernetes MiniKube dashboard by coming to the end of this tutorial. Play around with it. You will find it even more helpful for taming a cluster as the number of pods increases.


