

Monitoring is one of the most critical aspects of infrastructure, and the Icinga monitoring tool has a variety of options to choose from. Icinga lets you flexibly monitor your entire infrastructure based on configurations.
In this article, you’ll learn how to monitor your servers with the Icinga 2 monitoring stack; you’ll install the stack and set up distributed monitoring.
Ready? Jump right in!
Prerequisites
This tutorial will be a hands-on demonstration. To follow along, ensure you have the following:
- Two Linux machines – This tutorial uses the Ubuntu 20.04 server on master (master) and client (client01) servers.
- A user with root privileges on both devices.
- MariaDB is installed and running on the master server.
Setting Up FQDN on All Servers
Icinga 2 is an enterprise-ready monitoring solution that allows you to monitor server infrastructures and applications in many locations.
You’ll set up fully qualified domain names (FQDN) for all your servers, which eases server management in large environments. The domain in this tutorial is named example.lan, but you can use an existing local domain.
Note that you need to run the following commands on both servers. Change the values accordingly.
1. Open your terminal and connect to the server.
2. Next, run each command below to set up the FQDN on the master and client machines. FQDN for the servers are master.example.lan (master) and client01.example.lan (client01).
# Set FQDN on master server
sudo hostnamectl set-hostname master.example.lan

# Set FQDN on client01 server
sudo hostnamectl set-hostname client01.example.lan
3. Edit the /etc/hosts file with your preferred text editor and populate the entry below. Replace the IP addresses with the actual server addresses.
# /etc/hosts for master
172.16.1.10   master.example.lan   master

# /etc/hosts for client01
172.16.1.30   client01.example.lan   client01
4. Finally, run the below command to verify the FQDN.
hostname --fqdn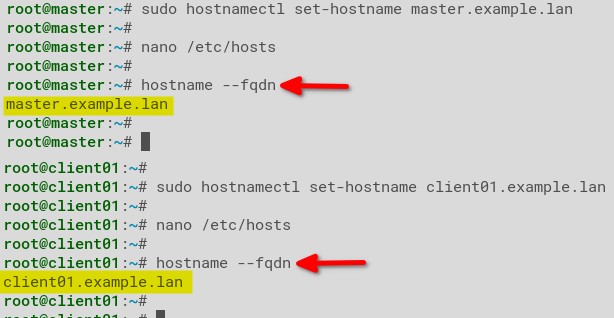
Installing Icinga 2 and Monitoring Plugins
With the FQDN configured, it’s time to install Icinga 2. You’ll install the apt packages for both Icinga 2 and monitoring plugins. These packages are the main component of Icinga 2 and the plugin that provides scripts for system monitoring.
Installing Icinga 2 and Monitoring Plugins should be done in the master and client01 servers.
1. Run the below apt install command to install package dependencies securely through HTTPS (apt-transport-https) and verify the GPG key.
sudo apt install -y apt-transport-https wget gnupg2. Next, run the wget command to download Icinga 2’s GPG key. The piped apt-key command adds the GPG key to verify the Icinga 2 packages’ integrity.
wget -O - https://packages.icinga.com/icinga.key | apt-key add -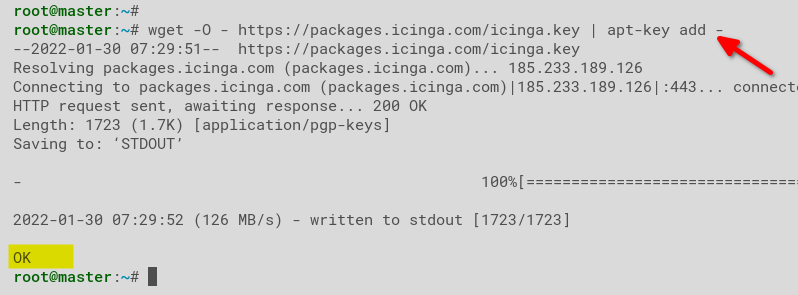
3. Run each command below to add the Icinga 2 apt repository on your machine.
# Adding repository for Icinga 2
. /etc/os-release; if [ ! -z ${UBUNTU_CODENAME+x} ]; then DIST="${UBUNTU_CODENAME}"; else DIST="$(lsb_release -c| awk '{print $2}')"; fi; \
echo "deb https://packages.icinga.com/ubuntu icinga-${DIST} main" > \
/etc/apt/sources.list.d/${DIST}-icinga.list
echo "deb-src https://packages.icinga.com/ubuntu icinga-${DIST} main" >> \
/etc/apt/sources.list.d/${DIST}-icinga.list

# Verify the Icinga 2 apt repository is added
cat /etc/apt/sources.list.d/focal-icinga.list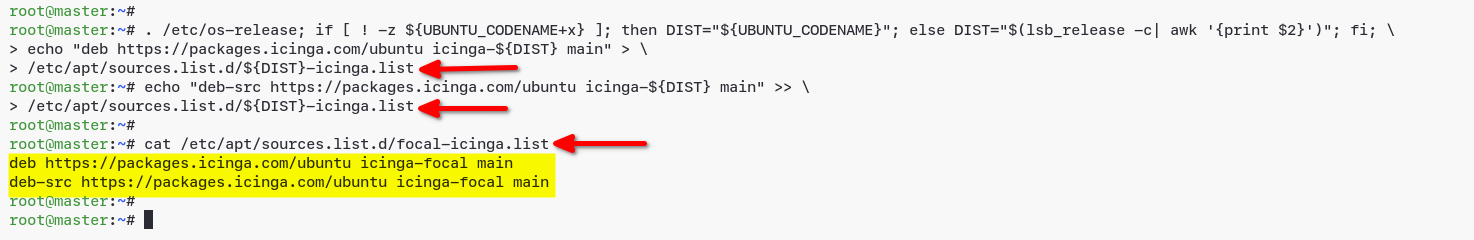
4. Lastly, run the apt commands below to refresh the package index and install the packages.
# Refresh package index
sudo apt update

# Installing package
sudo apt install icinga2 monitoring-plugins -y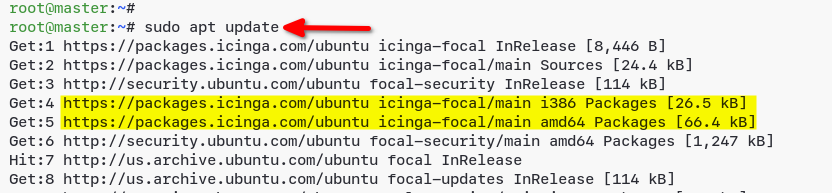
Installing IDO MySQL Driver on the master Server
Icinga 2 is installed and almost ready to work. But for Icinga 2 to properly work, it needs a database. So, you’ll install the IDO MySQL Driver and set up the database connection on your master server.
The Icinga 2 repository provides the
icinga2-ido-mysqlpackage. The package is a database driver that works for MySQL and MariaDB servers.
1. Run the command below to install the icinga2-ido-mysql package.
sudo apt install -y icinga2-ido-mysql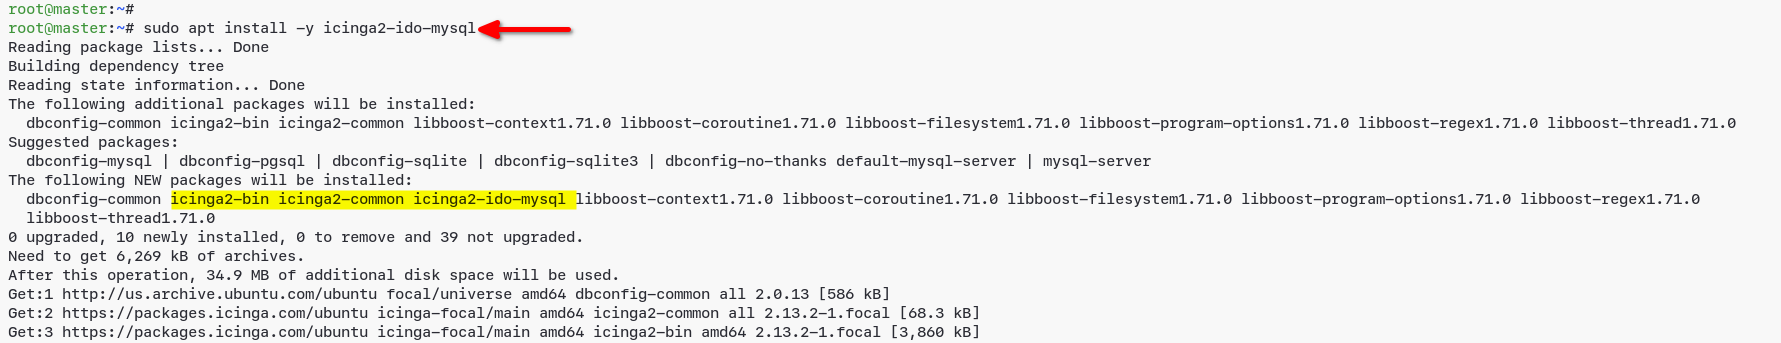
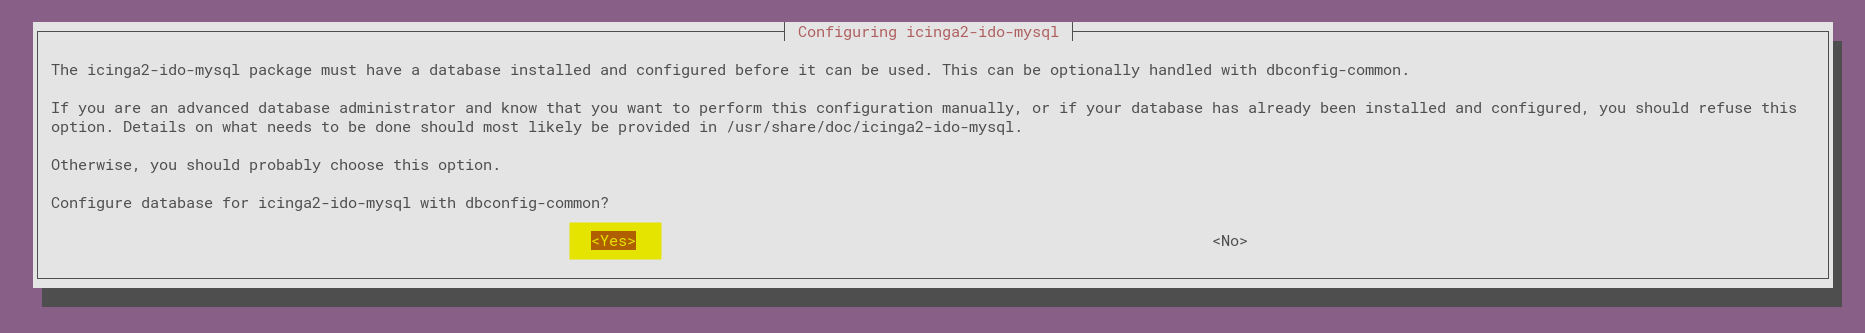
2. Select Yes when prompted to set up the driver and create a database, as shown below. The configuration sets Icinga 2 as the database user and generates a new file, /etc/icinga2/features-available/ido-mysql.conf.
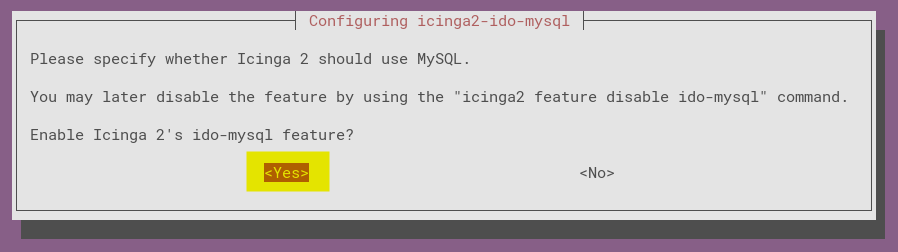
3. Now, select Yes to enable the ido-mysql feature on Icinga 2, which automatically creates a new database and user for Icinga 2.
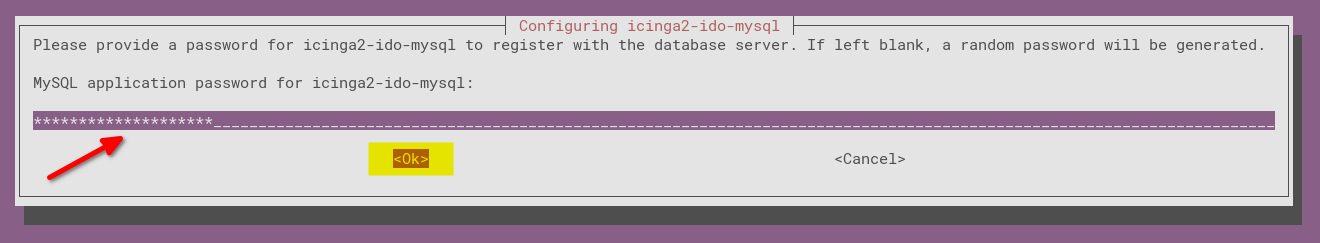
4. Provide a password for MariaDB user icinga2, and select OK to complete the icinga2-ido-mysql installation.
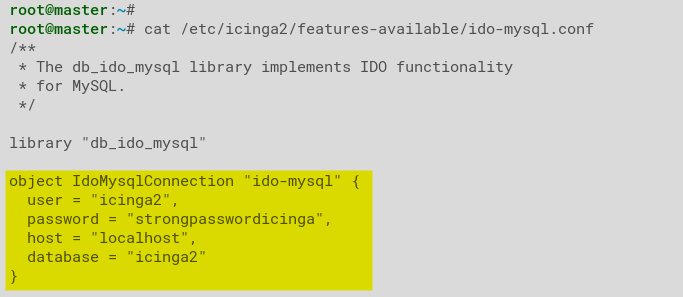
5. Next, run the cat command below to check the contents of the /etc/icinga2/features-available/ido-mysql.conf file.
cat /etc/icinga2/features-available/ido-mysql.confYou’ll see the details below for the MariaDB database matching what you provided.
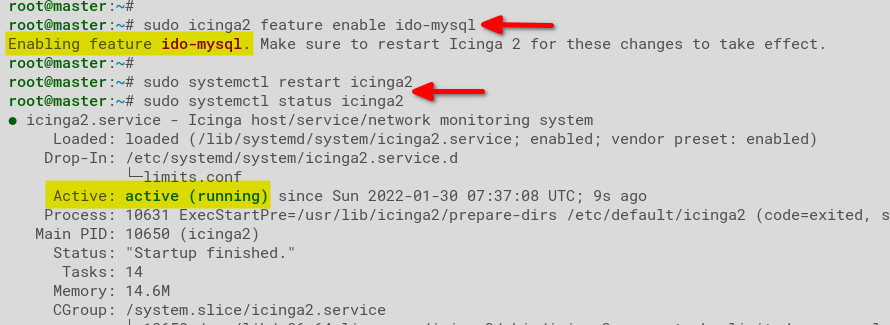
6. Run the icinga2 command below to enable the ido-mysql feature.
sudo icinga2 feature enable ido-mysql7. Lastly, run the following commands to restart and verify the icinga2 service status.
# restart service
sudo systemctl restart icinga2

# verifying service
sudo systemctl status icinga2
Similarly below, you’ll see the ido-mysql feature is enabled, and the icinga2 service is active (running).
Configuring the Icinga 2 API
You’ve just installed the Icinga 2 IDO MySQL driver and configured the database connection. But to manage and configure the Icinga 2 monitoring stack through HTTP requests, you’ll configure the Icinga 2 API.
The Icinga 2 monitoring stack is also a distributed monitoring system.
1. Run the command below on your master server to enable the Icinga 2 API, generate TLS certificates for Icinga 2, and update Icinga 2 configurations.
sudo icinga2 api setup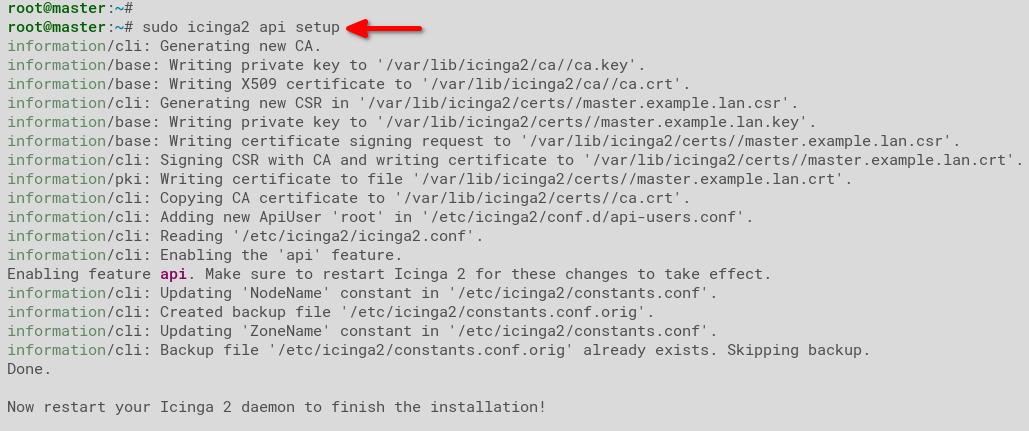
2. Now, edit the /etc/icinga2/conf.d/api-users.conf file in your text editor and populate the following configuration. Take note of the API user credentials you’re providing as you’ll need them later.
Replace the password with an appropriately strong one as necessary.
/** api for icingaweb2 */
object ApiUser "icingaweb2" {
  password = "passwordapiicngaweb2"
  permissions = [ "status/query", "actions/*", "objects/modify/*", "objects/query/*" ]
}
3. Lastly, run the below command to restart the icinga2 service and apply the new configuration.
sudo systemctl restart icinga2Installing and Configuring icingaweb2 on the master Server
You’ll need a dashboard to better monitor your hosts after enabling the Icinga 2 API and configuring the new API user. How? You’ll install and configure the Icingaweb2 on the master server.
The Icingaweb2 is the web front-end for the Icinga 2 monitoring stack, written in PHP, and provides a responsive and extensible monitoring dashboard.
1. Run the command below to install icingaweb2 with components needed to handle the Icingaweb2 web application.
sudo apt install icingaweb2 libapache2-mod-php icingacli -y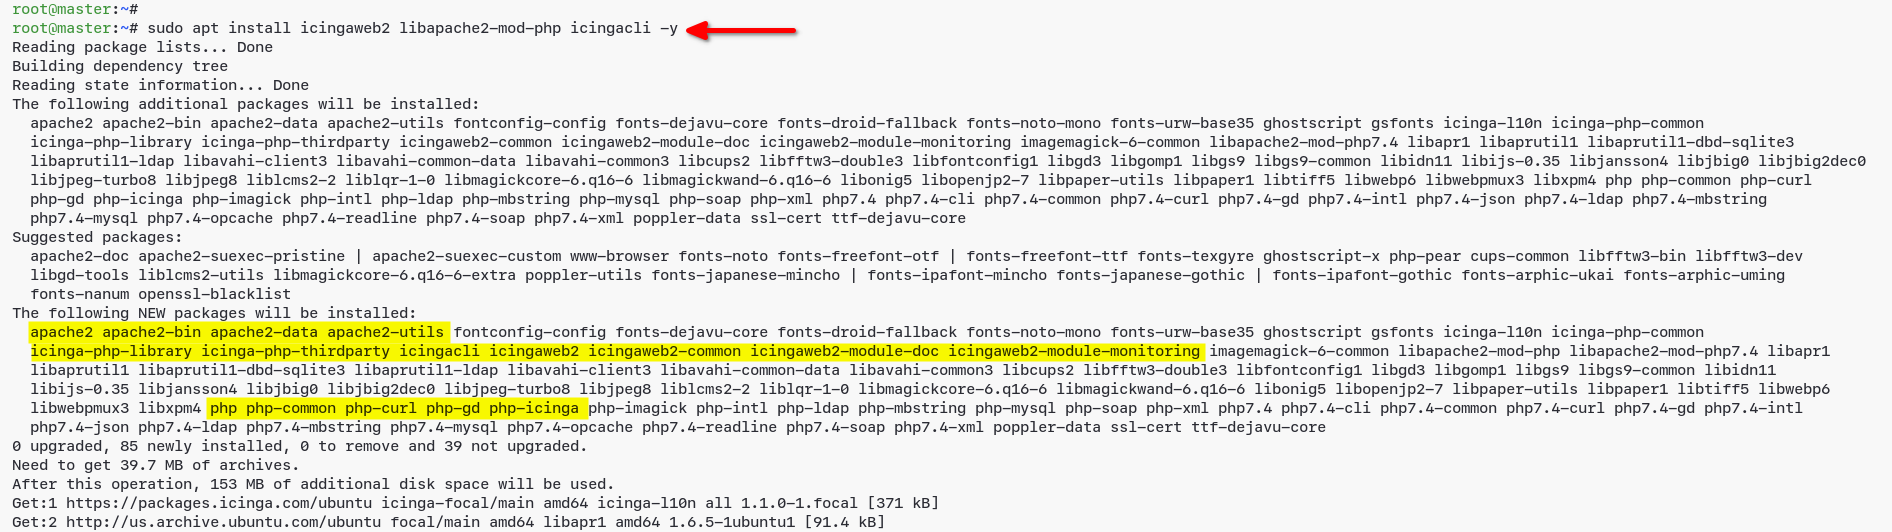
2. Next, run the icingacli command below to generate a token for setting up Icingaweb2. The Icingaweb2 installation will need this token later, so write it down.
sudo icingacli setup token create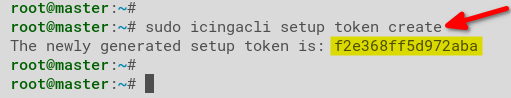
3. Execute the mysql command below to log in to the MySQL shell and create a new user (root) for Icingaweb2.
mysql -u root -p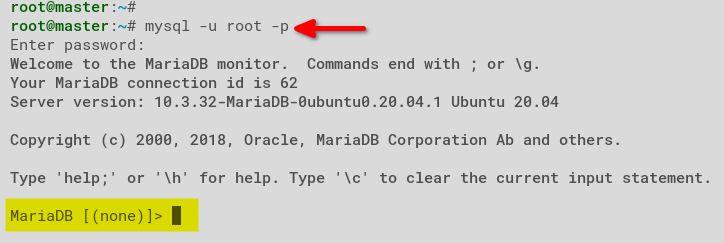
4. Now, run the following queries to create a new database and the user icingaweb2 with a password. You can set the username and password as you prefer.
CREATE DATABASE icingaweb2;
GRANT ALL ON icingaweb2.* TO icingaweb2@localhost IDENTIFIED BY 'strongpasswordicingaweb2';
FLUSH PRIVILEGES;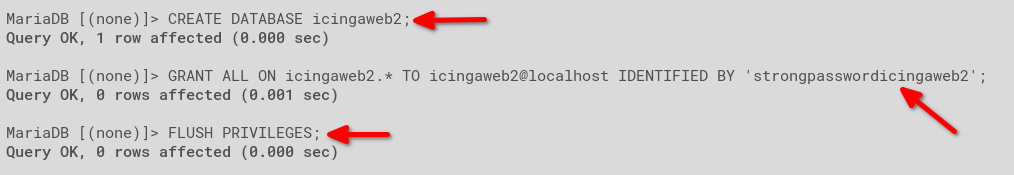
5. Lastly, run exit to log out from the MySQL shell.
exit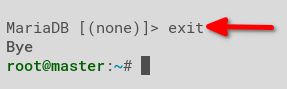
Setting up the Icingaweb2 Installation
You’ve installed Icingaweb2 on the master server and generated the setup token for a new user. But to access the icingaweb2 dashboard, you’ll set up your icingaweb2 installation via your web browser.
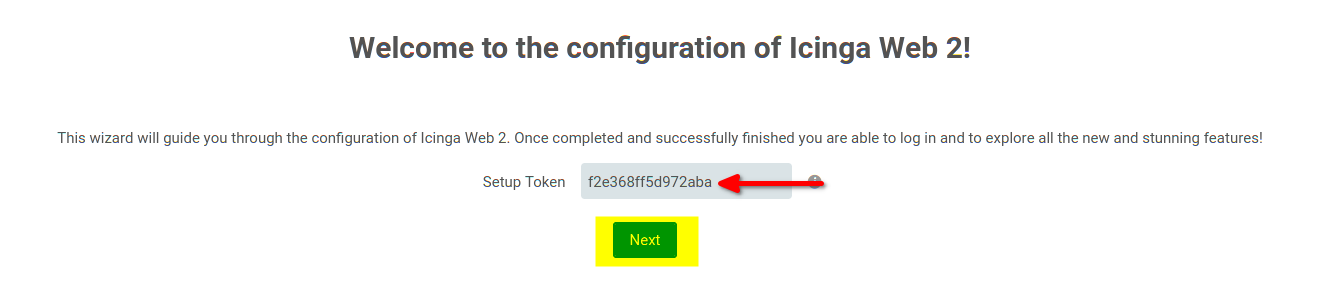
1. Open your web browser and navigate to the master server IP address, followed by the URL path /icingaweb2/setup (i.e., http://172.16.1.10/icingaweb2/setup).
2. Next, input the Icingaweb2 setup token you generated in the “Installing and Configuring icingaweb2 on the Master Server” section (step two), and click Next.
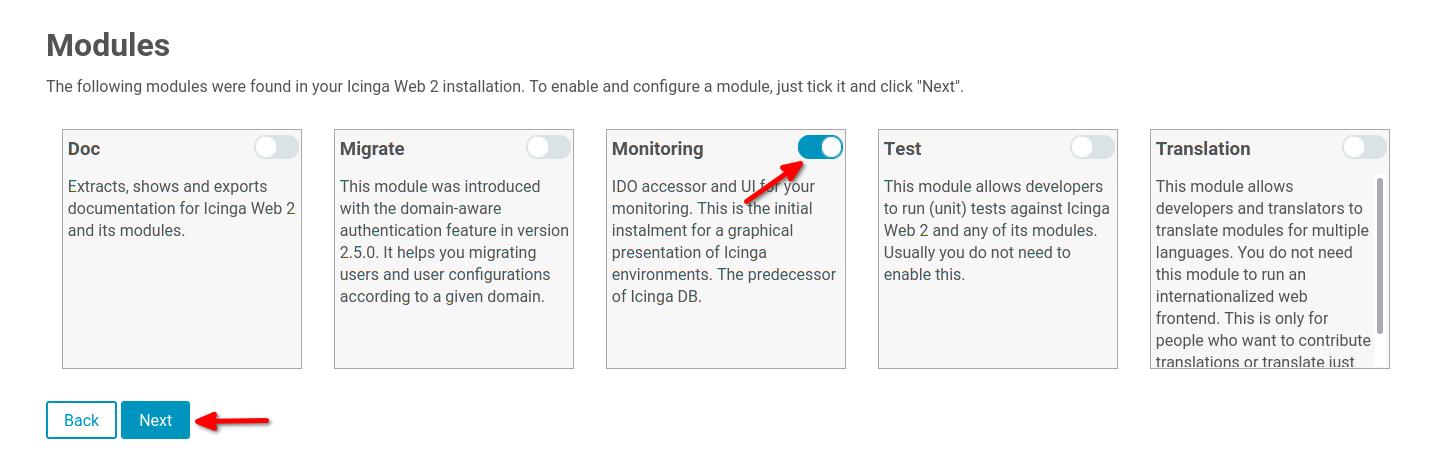
3. Accept the defaults (Monitoring) in the Modules page and click Next.
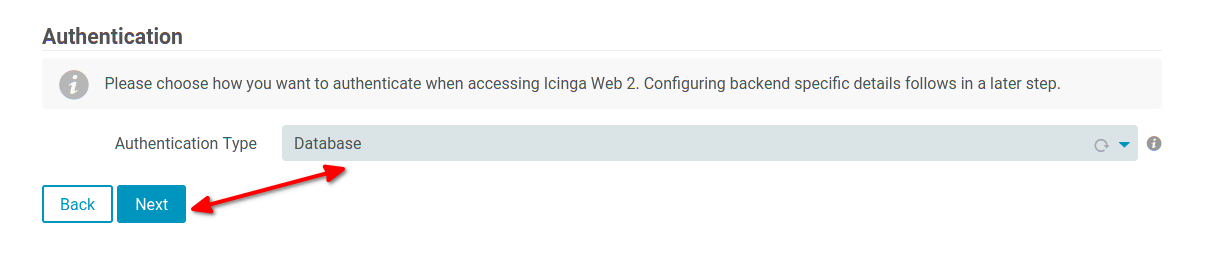
4. Select Database in the Authentication Type dropdown box, and click Next. This authentication type secures the Icingaweb2 administration dashboard.
At this point, the Icingaweb2 starts checking system requirements for the installation.
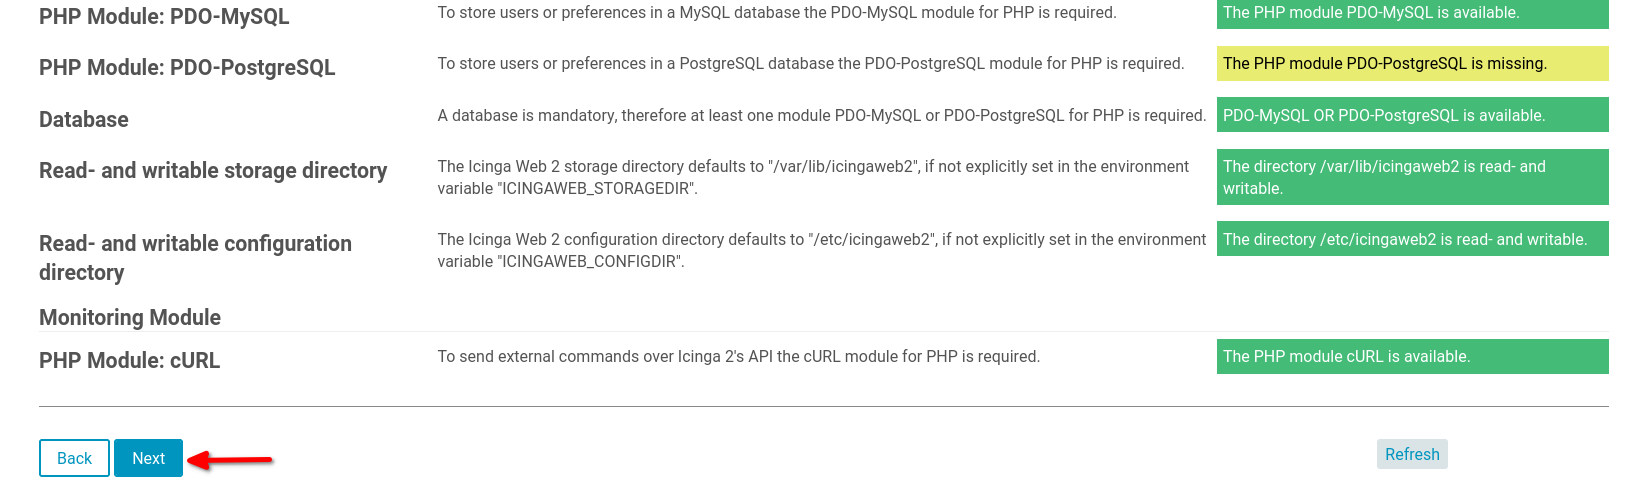
5. Ensure all status requirements are green, except the PostgreSQL one, and click Next.
Ignore the PostgreSQL error message. You’re using MariaDB as the database backend.
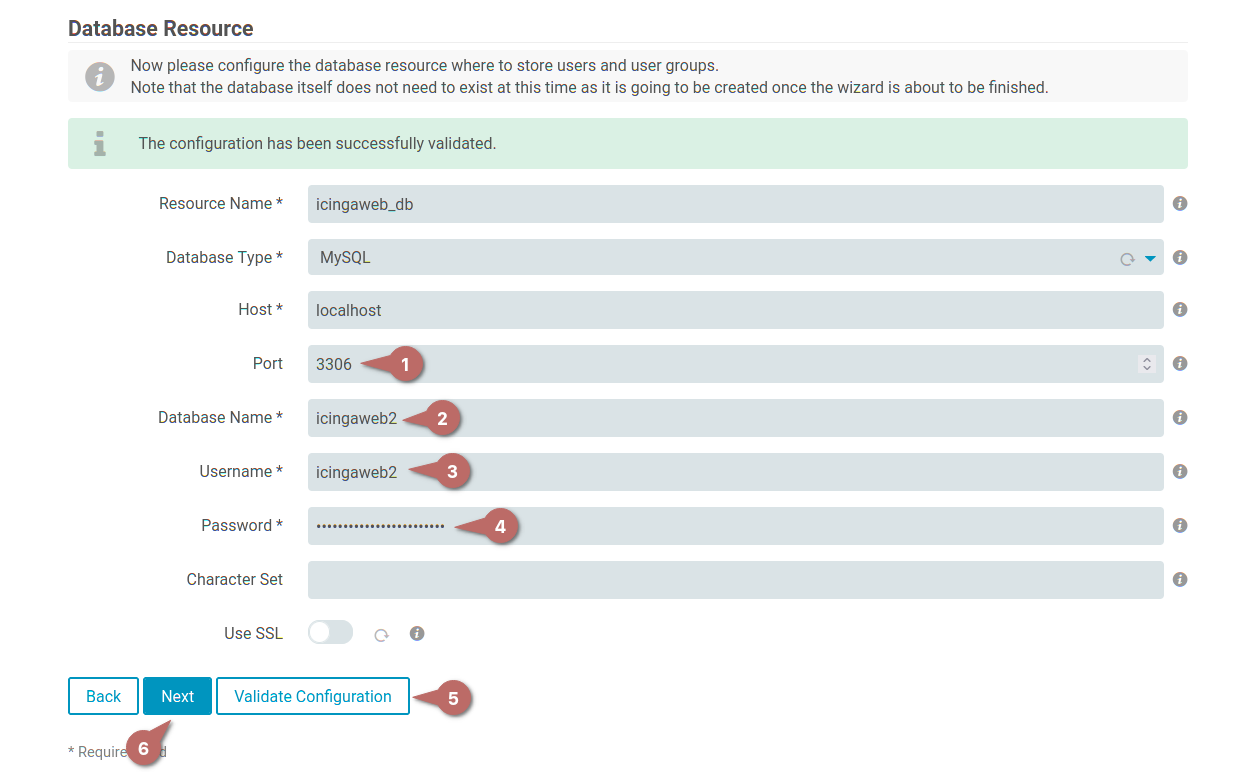
6. Now, provide the same values you set in the “Installing and Configuring icingaweb2 on the Master Server” section (step four) to the Database Resource form below.
Click the Validate Configuration to ensure the configuration works, then click Next after seeing The configuration has been successfully validated message.
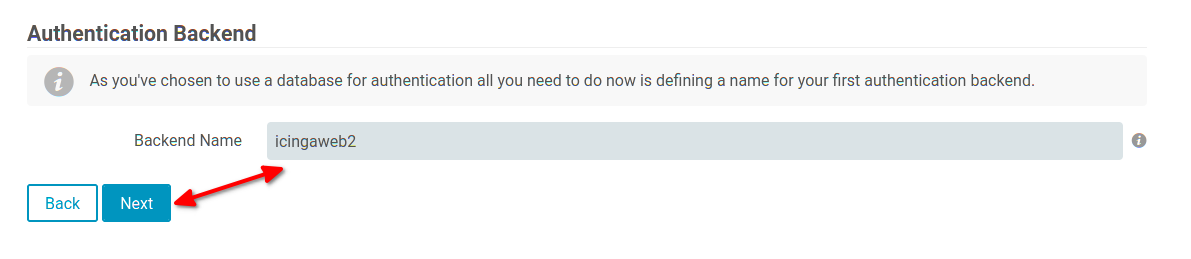
7. Leave the Authentication Backend with the default value (icingaweb2) as the backend name, and click Next.
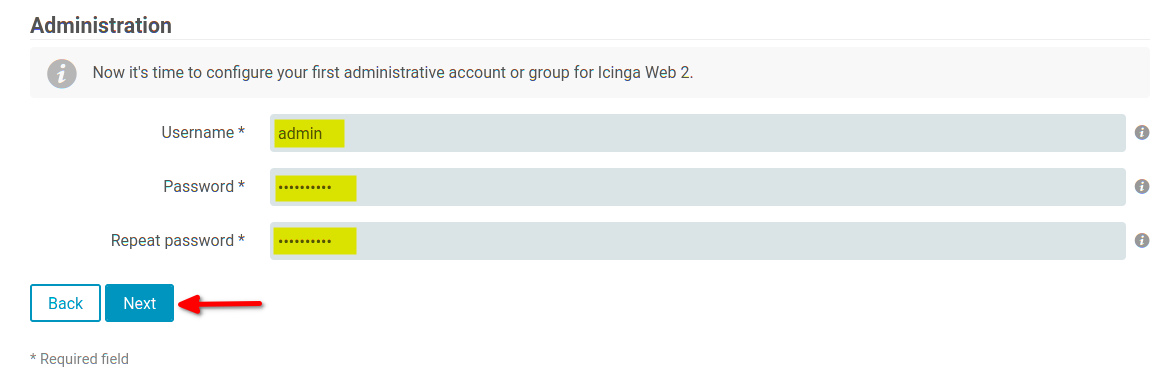
8. Provide credentials for Icingaweb2’s first administrative account and click Next. Take note of the credentials, as you’ll need them to log in to the Icingaweb2 dashboard later.
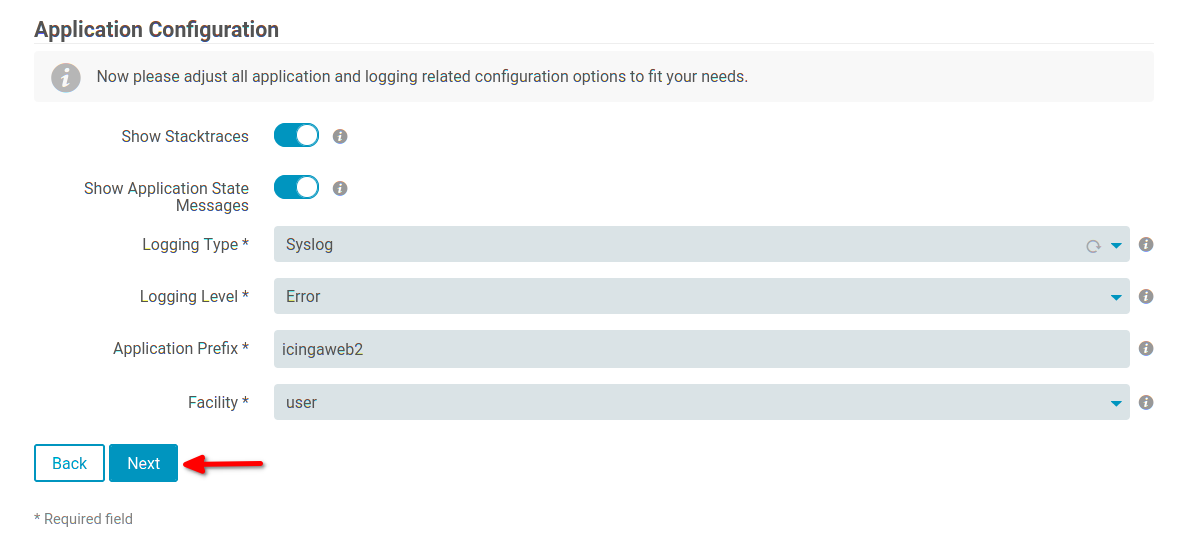
9. Leave the default logging values in the Application Configuration for Icingaweb2, and click Next.
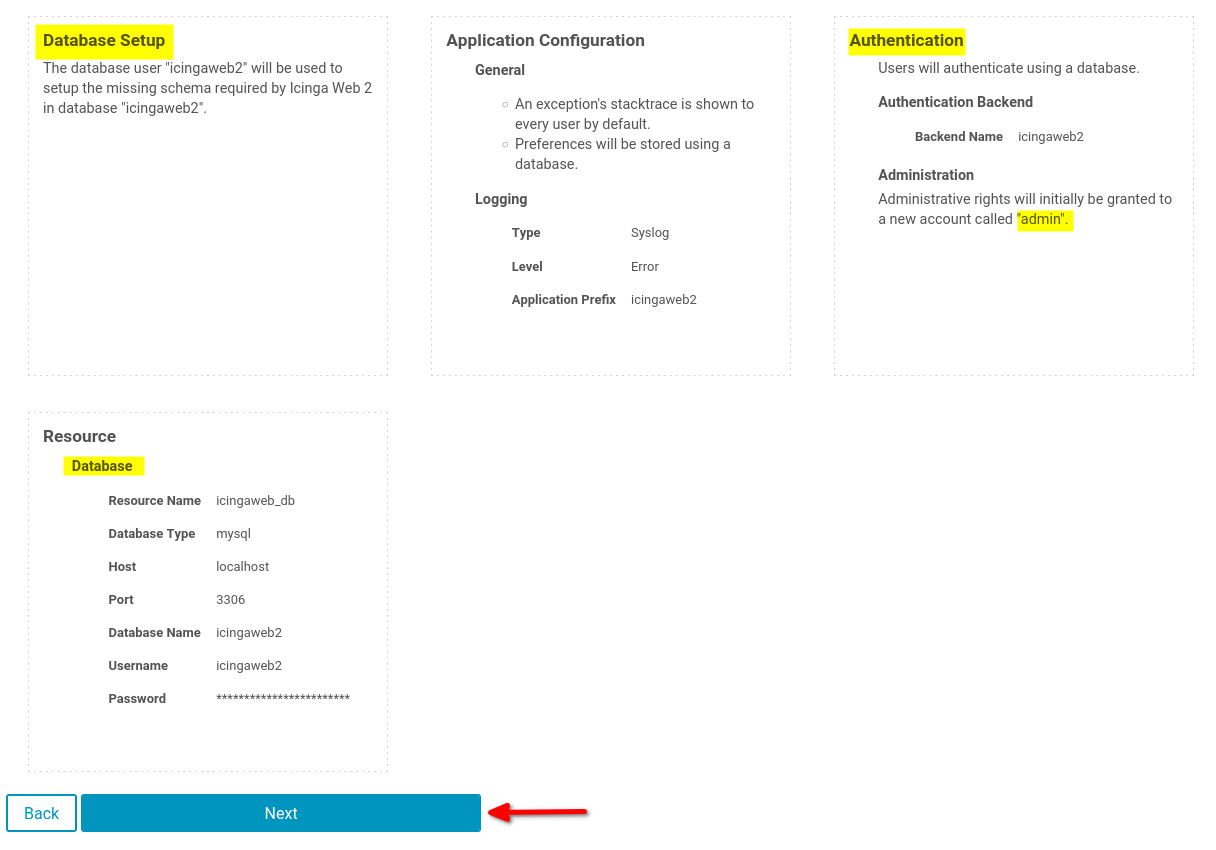
10. Next, review the configuration settings, and click Next to confirm the icingaweb2 installation.
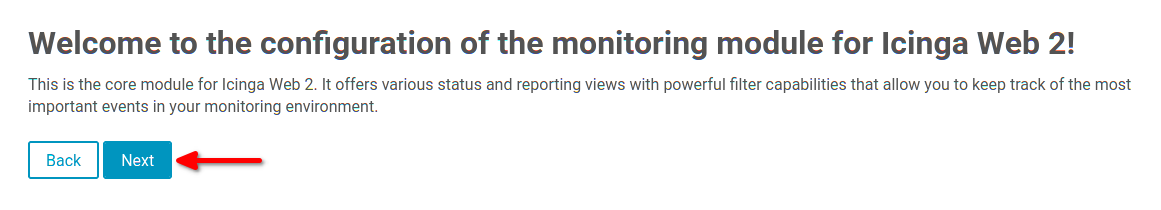
11. Now, click Next to continue setting up the monitoring module for Icingaweb2.
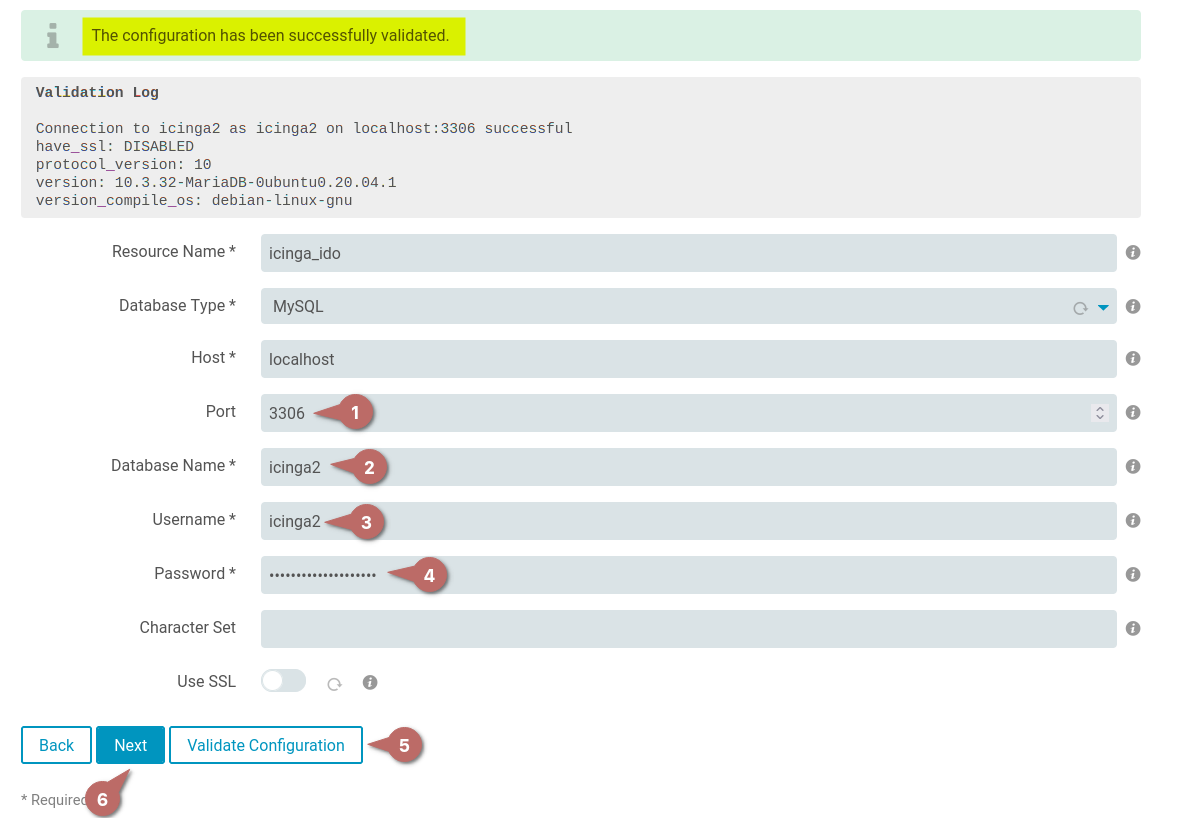
12. Provide the database name and user for Icinga 2 accordingly, as shown below. The database details for Icinga 2 are available in the /etc/icinga2/features-available/ido-mysql.conf file.
Click the Validate Configuration, ensure the database connection is successful, then click Next.
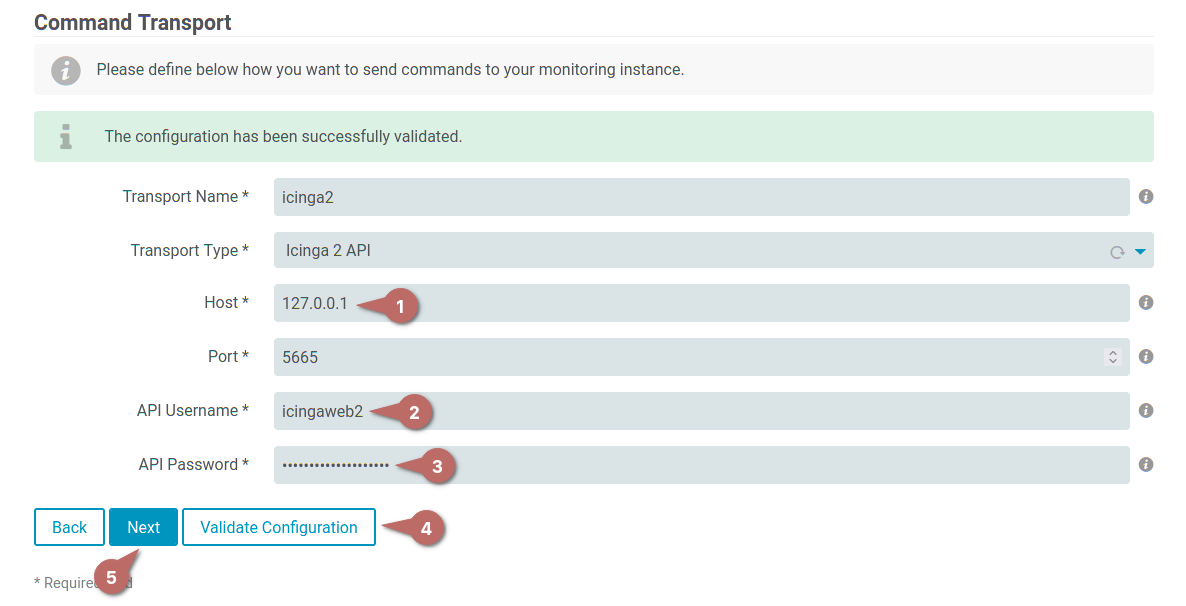
13. Enter the Icinga 2 API user and password stored in the /etc/icinga2/conf.d/api-users.conf file to the fields below.
Click the Validate Configuration button, ensure you get the message saying The configuration has been successfully validated, and click Next.
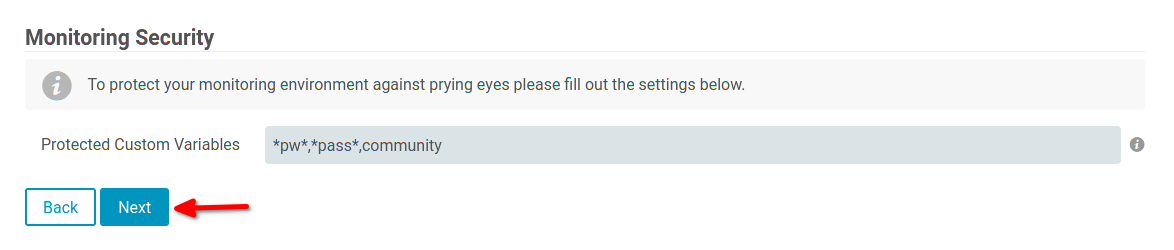
14. Accept the default custom variables on the Monitoring Security setting and click Next. These variables help secure your monitoring environment from prying eyes.
15. Inspect the monitoring module configuration, and click Finish to complete the installation.

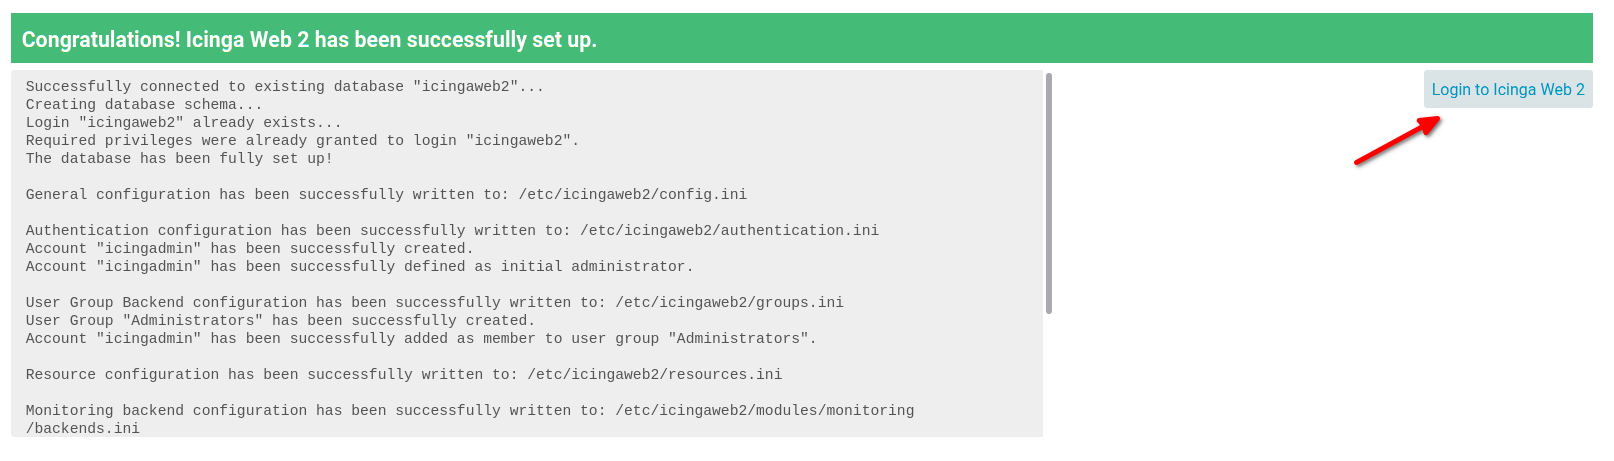
16. When the icingaweb2 installation completes, you’ll see the Congratulation! Icinga Web 2 has been successfully set up message, as shown below.
Click the Login to Icinga Web 2, and your browser redirects to the icingaweb2 login page (step 17).
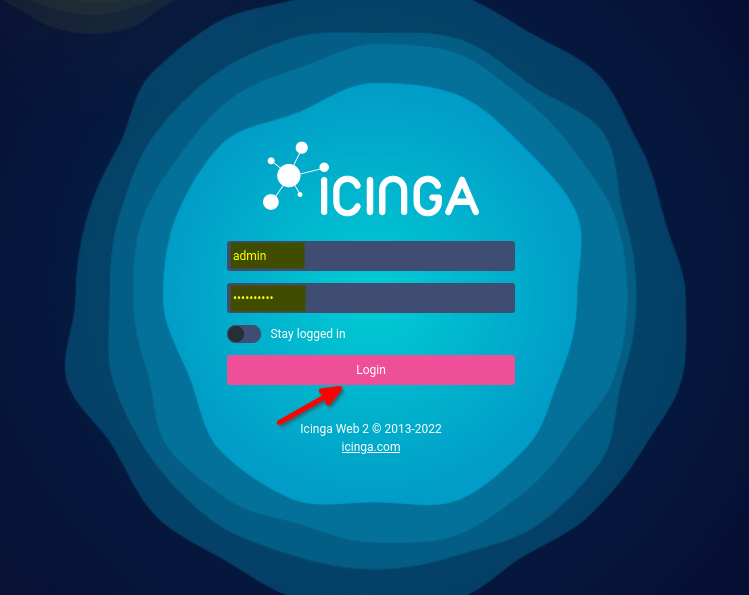
17. Input your admin user and password for icingaweb2 and click Login to access the Icinga dashboard.
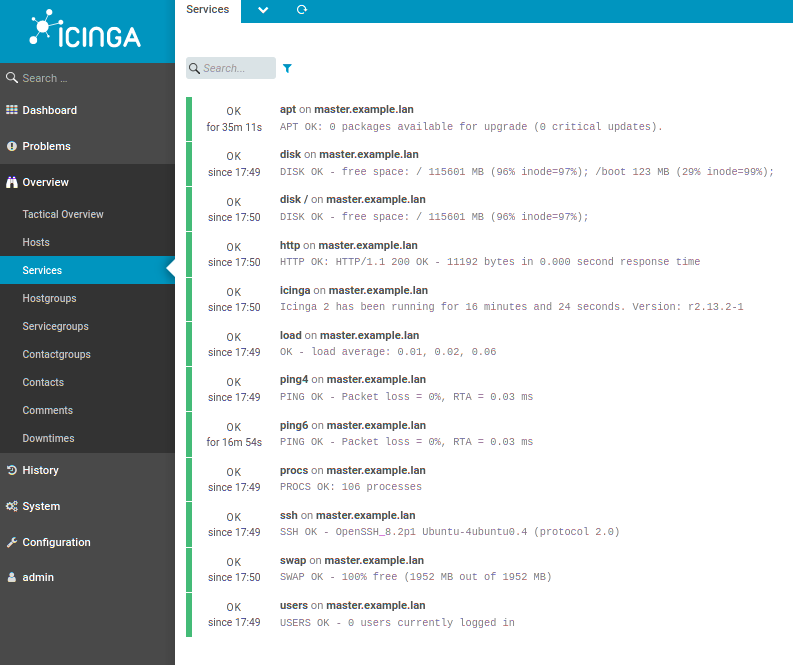
18. Finally, click Overview —> Services, and you’ll see the status of your master server similar to the one below.
Initializing the Icinga 2 Master Server
You’ve successfully installed the Icinga 2 monitoring stack to monitor your master server’s status. Now you’ll initialize the master server as the master node for the Icinga 2 monitoring stack. The master node is the main controller of the Icinga 2 distributed monitoring stack.
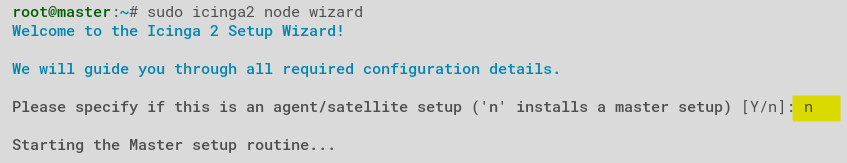
1. Run the command below on your master server’s terminal to initialize the icinga2 master node.
sudo icinga2 node wizard2. Press n to set up agent/satellite node (Icinga 2 master node).
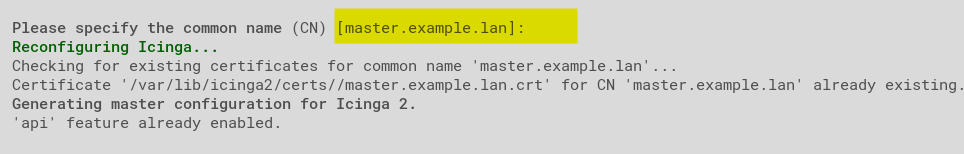
3. Press ENTER on the common name (CN) configuration. The Icinga 2 will automatically detect the FQDN of the server.
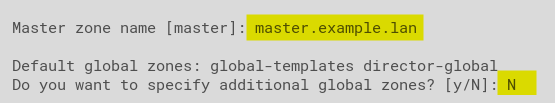
4. Next, specify the master zone name as master.example.lan, and press N to skip adding global zones. The default global zones sync all configuration objects in Icinga 2.
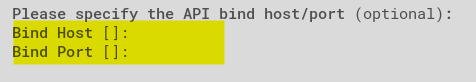
5. Leave the API bind host and port as default and press ENTER. The API will communicate between the Icinga2 node with TLS encrypted connections.
6. Type Y to disable all configurations inside the /etc/icinga2/conf.d/ directory since you’ll use the Icinga2 zones configuration that you’ll create later.
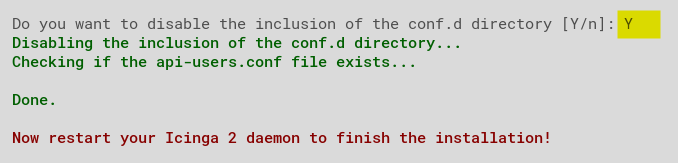
7. Now, run the systemctl command below to restart the icinga2 service and apply the configuration.
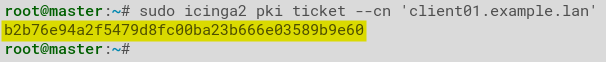
sudo systemctl restart icinga28. Lastly, run the below command to generate the ticket for registering client01 with Icinga 2.
sudo icinga2 pki ticket --cn 'client01.example.lan'Copy the generated ticket that you’ll use to enroll client01 as an Icinga 2 agent later.
Initializing Icinga 2 Agent on the Client Server
After you’ve initialized the master server as the master node, you’ll also set up the Icinga 2 agent on client01 to monitor the client01 machine using Icinga 2.
1. Log in to client01, and follow the steps you did in the “Initializing the Icinga 2 Master Server” section (steps one to three) to initialize the Icinga 2 agent.
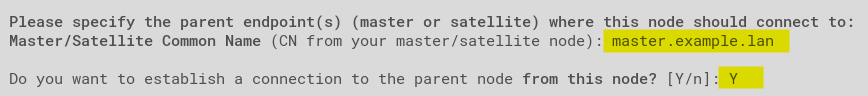
2. Next, specify the parent endpoint as master.example.lan, and enter Y to establish the connection with the parent/master node.
3. Input the IP address of the master server (172.16.1.10), and leave the endpoint port as default.
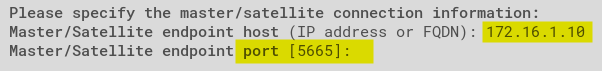
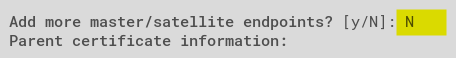
4. Now, type N when asked to add more endpoints.
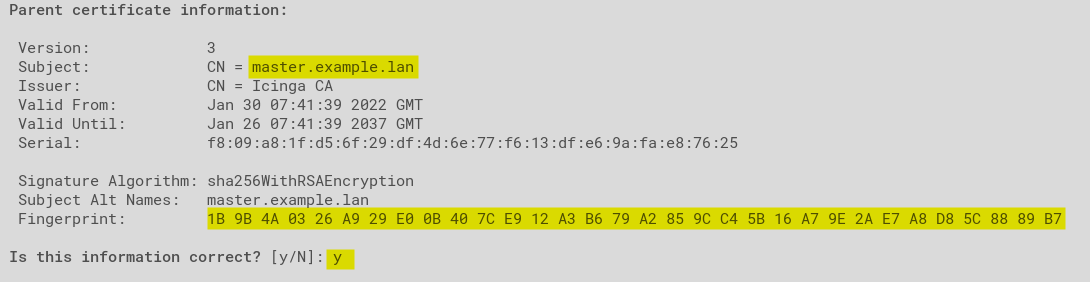
5. Type Y to confirm the information and add the certificate for the Icinga 2 master server.
6. Input the ticket you generated in the last step of the “Initializing the Icinga 2 Master Server” section to register the agent node (client01.example.lan).

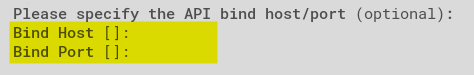
7. Press ENTER to accept the default values for the API bind host and port.
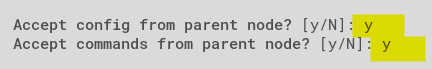
8. Next, enter Y twice to accept config and commands from the parent/master node.
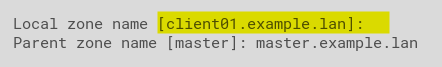
9. Press ENTER to accept the default for the local zone name, but enter the parent zone name, which should match the zone name (master.example.lan) on the master server.
10. Now, type N to skip adding global zones, and type Y to disable configurations on the /etc/icinga2/conf.d directory.
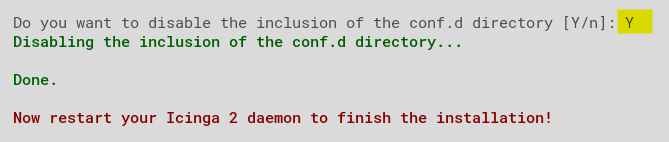
11. Lastly, run the following command to restart the Icinga 2 service and apply the configuration changes. sudo systemctl restart icinga2
sudo systemctl restart icinga2Creating Zones Configuration on master Server
With the distributed monitoring out of the way, you’ll create a new zone directory and define the monitoring configuration for the client agent.
1. Run the mkdir command below to create a new directory as default zone (master.example.lan) on Icinga 2.
sudo mkdir -p /etc/icinga2/zones.d/master.example.lan/2. Next, create a configuration file (client01.example.lan.conf) in the /etc/icinga2/zones.d/master.example.lan/ directory. Populate the file with the following configuration.
The code below defines the endpoints, zones, and the host object to monitor the servers.
// Endpoints
object Endpoint "client01.example.lan" {
}
// Zones
object Zone "client01.example.lan" {
    endpoints = [ "client01.example.lan" ]
    parent = "master.example.lan"
}
// Host Objects
object Host "client01.example.lan" {
    check_command = "hostalive"
    address = "172.16.1.30"
    vars.client_endpoint = name
}
3. Create another configuration file, copy/paste the code below to the file, and save it as /etc/icinga2/zones.d/master.example.lan/services.conf.
This configuration below monitors some basic services on the client01 machine.
// Ping
apply Service "Ping" {
check_command = "ping4"
assign where host.address // check executed on master
}
// System Load
apply Service "System Load" {
check_command = "load"
command_endpoint = host.vars.client_endpoint // Check executed on client01
assign where host.vars.client_endpoint
}
// SSH Service
apply Service "SSH Service" {
check_command = "ssh"
command_endpoint = host.vars.client_endpoint
assign where host.vars.client_endpoint
}
// Icinga 2 Service
apply Service "Icinga2 Service" {
check_command = "icinga"
command_endpoint = host.vars.client_endpoint
assign where host.vars.client_endpoint
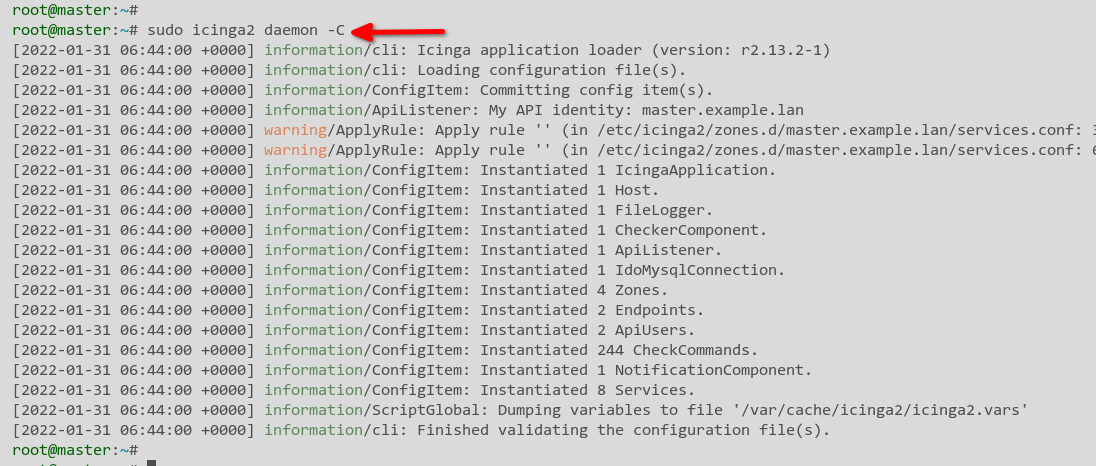
}4. Now run the icinga2 command below to verify the Icinga 2 configuration.
sudo icinga2 daemon -CIf all goes well, you’ll see an output similar to the one below.
5. Lastly, run the below command to restart the icinga2 service and apply the configuration changes.
sudo systemctl restart icinga2Verifying on Icinga 2 Dashboard
You’ve configured all resources, but you still need to test if they all work. You’ll verify the results of your work by checking the Icinga 2 dashboard.
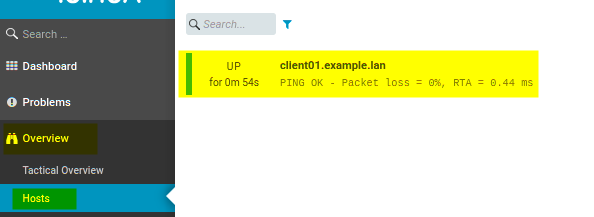
Go back to the Icinga 2 dashboard and click on the Overview —> Hosts, as shown below, and you’ll see that the client01 is UP.
Now, click the Services menu to see all monitored services with the Icinga 2 monitoring stack on client01.
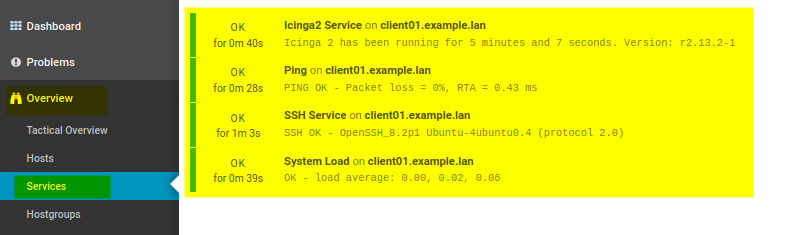
Conclusion
This tutorial aims to help you through the process of setting up the Icinga 2 monitoring stack on the Ubuntu server. You’ve also learned how to set up Distributed Monitoring using an Icinga 2 agent to monitor an extensive infrastructure.
Now, what’s next? Perhaps learn to set up the Icinga Director to simplify your monitoring?


