


Azure Monitoring Log Analytics is a powerful tool in the Azure platform that provides near real-time analysis of log data collected from different sources.
Not a reader? Watch this related video tutorial!As an Azure Administrator, knowing how to use Log Analytics is critical to troubleshooting issues, monitoring activities, and automating actions.
This tutorial will teach you how to use Azure Log Analytics to monitor Azure VMs effectively. By the end of this tutorial, you will have a solid understanding of using Azure Log Analytics for monitoring and various tasks.
Prerequisites
To efficiently follow this tutorial, you will need the following requirements.
- An Azure account with an active subscription. You can create a free Azure account here if you don’t have one.
- An Azure VM is already deployed and running. This VM will be the resource you’ll be monitoring with Azure Monitor.
Creating a Log Analytics Workspace for Azure Monitoring
Azure Log Analytics workspace is a central place where you can monitor and manage all the Azure Monitor logs collected from one or more Azure resources. You can think of the workspace as a folder where all your monitoring data is stored, and you can access it anytime you want.
This section teaches you how to create an Azure Log Analytics workspace using the Azure Portal and Cloud Shell.
Using the Azure Portal
Follow these steps to create the Log Analytics Workspace from the Portal.
1. Open the Azure Portal on your web browser and log in with your credentials.
2. Click All Services —> Analytics —> Log Analytics workspaces on the Azure Portal.
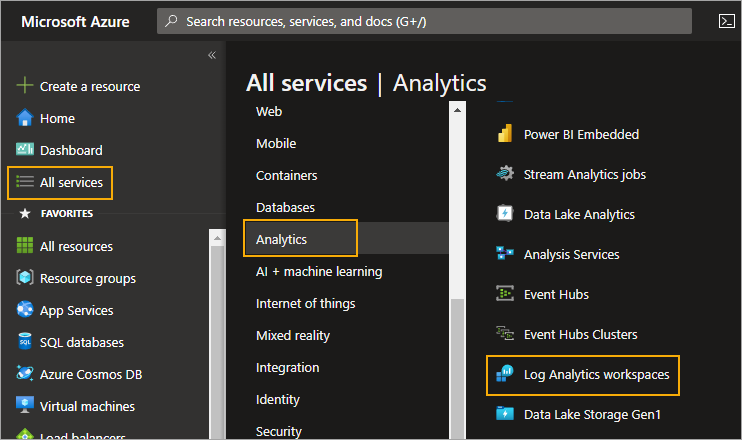
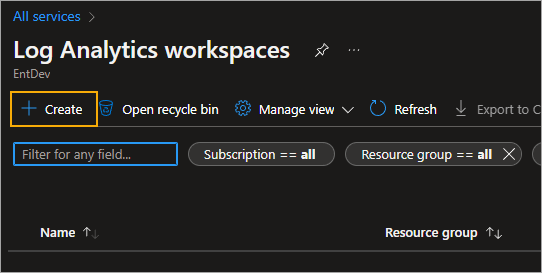
3. On the Log Analytics workspaces page, click on Create to create a new workspace.
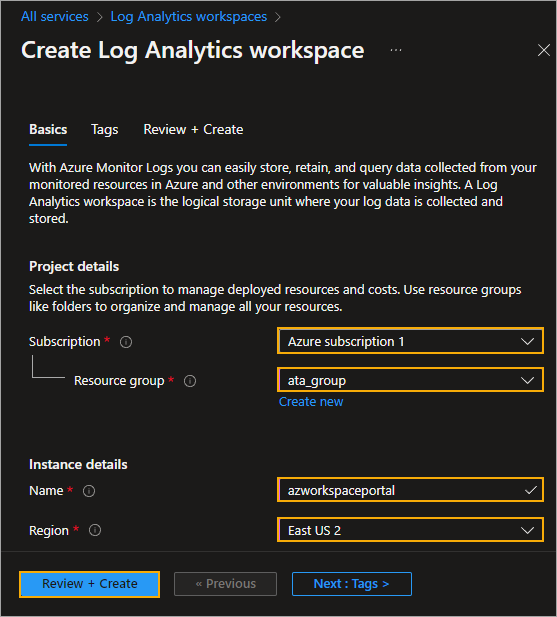
4. Under the Basics tab, complete all fields as follows.
- Subscription: Select the Azure Subscription from the drop-down list in which to create the workspace.
- Resource group: Select an existing resource group or create a new one. This example selects the existing resource group called ata_group.
- Name: Enter a name for the new workspace. The name must be unique within the resource group and Azure subscription. This workspace name in this example is azworkspaceportal.
- Region: Choose a location for the workspace from the drop-down list. The location should be near your geographic location for optimal performance.
Click Review + create to review your settings and validate the workspace.
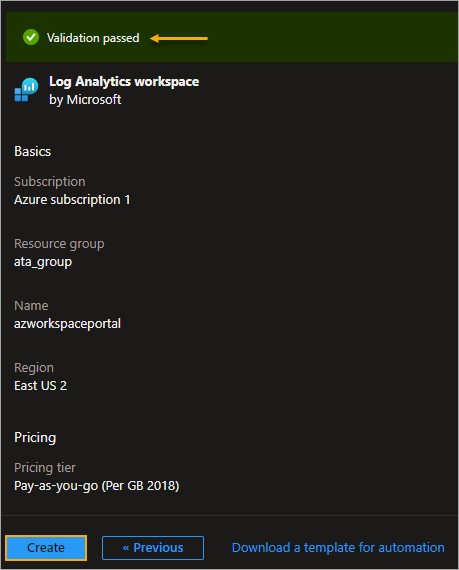
5. Click Create to create the workspace once your settings’ validation test passes.
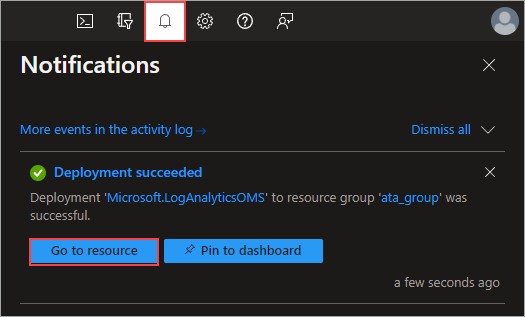
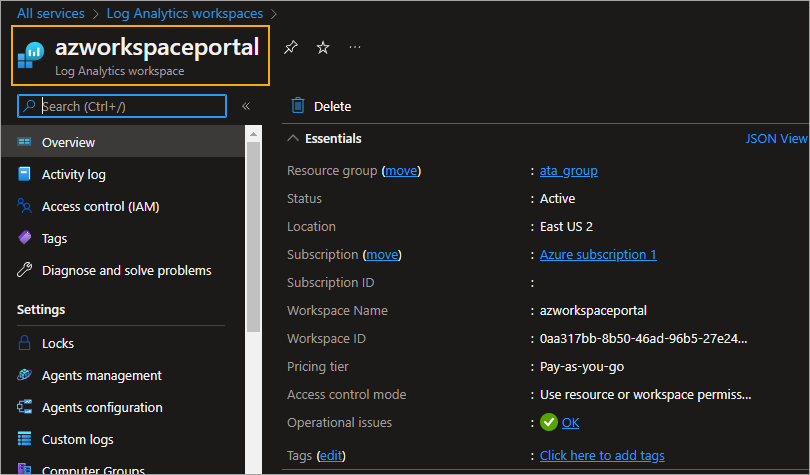
6. Wait for a few minutes while Azure creates your workspace. You should receive a notification upon the completion, and when you do, click on Go to resource to open the new workspace.
You have completed deploying a new Azure Monitor Log Analytics workspace.
Using Azure PowerShell
Do you like accomplishing tasks using commands? If you’re not a fan of the Azure Portal, an excellent alternative is using the Azure Az PowerShell Module, which is pre-installed with the Azure Cloud Shell.
To create the Azure Monitor Log Analytics workspace, follow these steps.
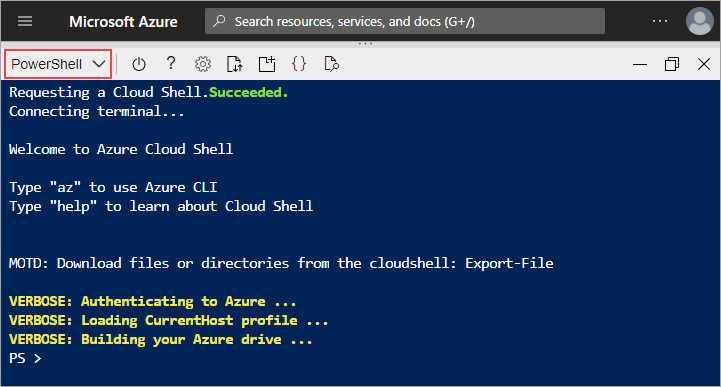
1. Launch the Azure Cloud Shell using the direct link – https://shell.azure.com/ or click the Cloud Shell button on the top of the Azure Portal.
2. Once the Cloud Shell is open, click the drop-down and select the PowerShell environment.
3. If you have more than one Azure subscription, choose the one where you’ll create the Log Analytics workspace by running the below command. This example selects the Azure subscription 1.
Select-AzSubscription 'Azure subscription 1'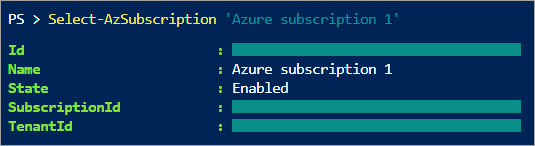
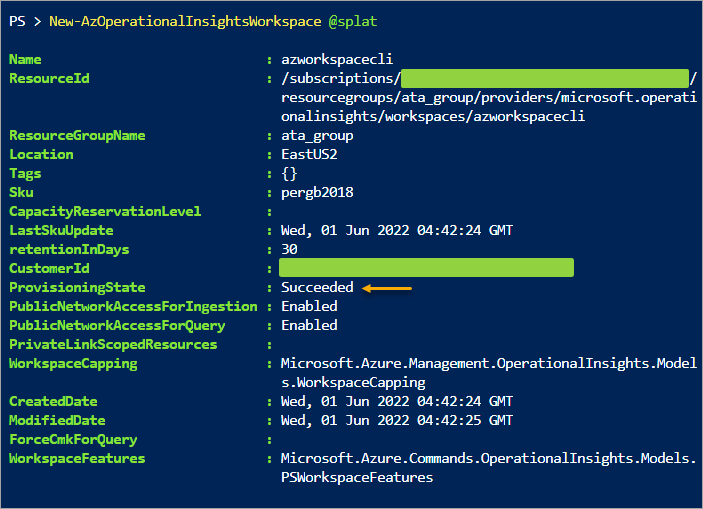
4. Run the following command to create a workspace. Replace the Name, Location, and ResourceGroupName as you wish. The below code uses splatting to simplify the parameter values and for readability.
$splat = @{
	Name = 'azworkspacecli'
	Location = 'EastUS2'
	ResourceGroupName = 'ata_group'
}

New-AzOperationalInsightsWorkspace @splat
Wait for the deployment to finish, which could last for a few minutes. After the deployment, the result you see will be similar to the screenshot below.
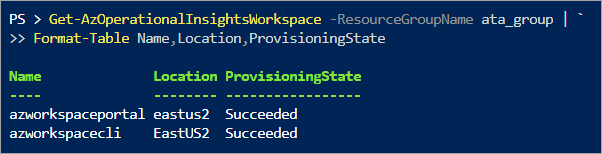
5. Finally, to list all your workspaces, run the following command. Replace the -ResourceGroupName parameter value with your resource group name.
Get-AzOperationalInsightsWorkspace -ResourceGroupName ata_group | `
Format-Table Name,Location,ProvisioningState
As a result, you will see all your workspaces. The screenshot below shows the two workspaces, azworkspaceportal and azworkspacecli you created in the Portal and PowerShell.
Enabling Azure Monitoring VM Insights
Now that you have an Azure Log Analytics workspace, the next step is to enable the monitoring on your Azure VM so that Azure Monitor can start collecting data and send them to your workspace. You must install the VM Insights Agent to your Azure VM to accomplish this task.
Follow the below steps to install the VM insights agent.
The steps only enable the data collection on the VM host and not the VM guests.
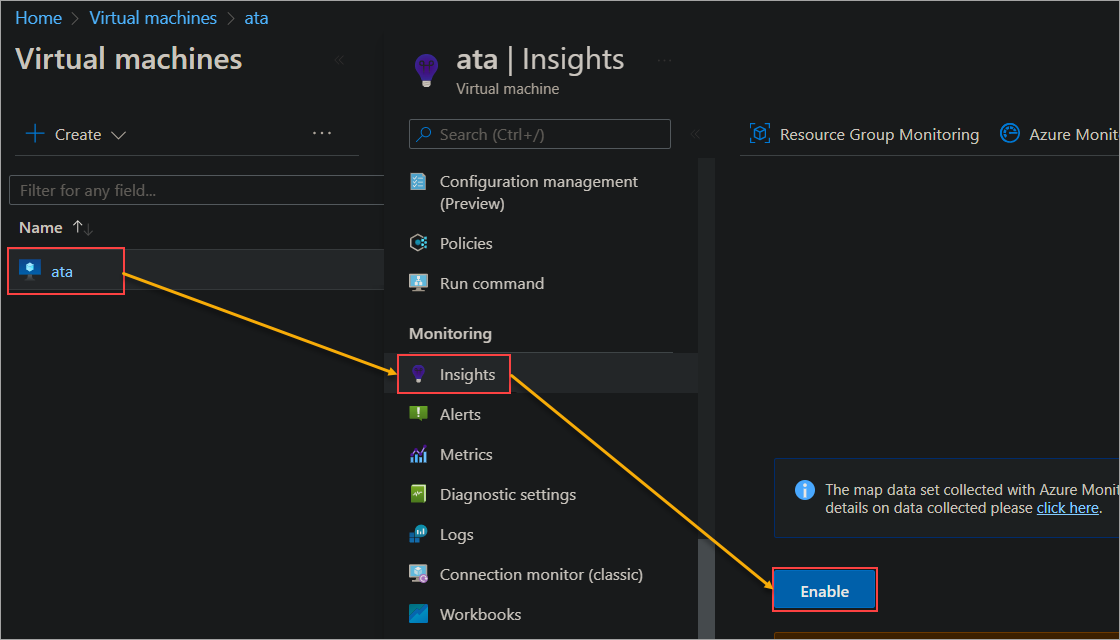
1. Navigate to your virtual machine in the Azure Portal.
2. Click on Insights under the Monitoring section. Click on Enable on the right blade, as shown below.
You can do the same steps above for all your VMs or Azure Arc-enabled servers to monitor them.
3. Select a subscription and a workspace you created earlier. In this example, the subscription and workspace are Azure subscription 1 and azworkspaceportal. After selecting, click on Enable.
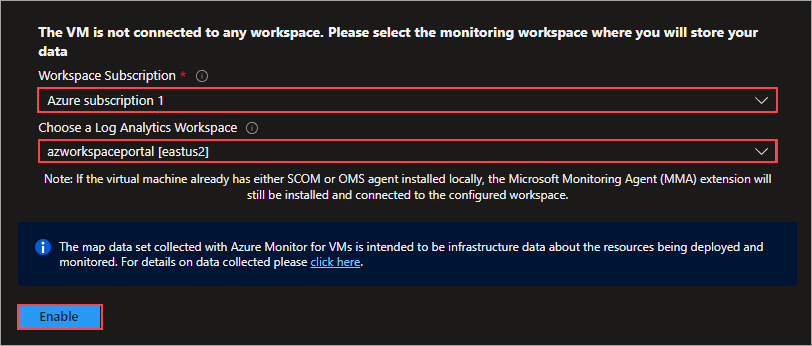
Note: The VM and workspace can be on different resource groups on the same subscription.
Wait to receive the deployment completion notification, which you’ll see in the upper right corner of the page.
Enabling Guest-Level Azure Monitoring
Now that you have a Log Analytics workspace and enabled VM Insights, you must ensure that the VM guest data collection also happens. This way, you can aggregate and analyze data from inside the VM guest and not only from the VM host.
In this section, you’ll enable guest-level monitoring. To do so, proceed as follows.
Navigate to your virtual machine in the Azure Portal, and select Diagnostic settings under the Monitoring section.
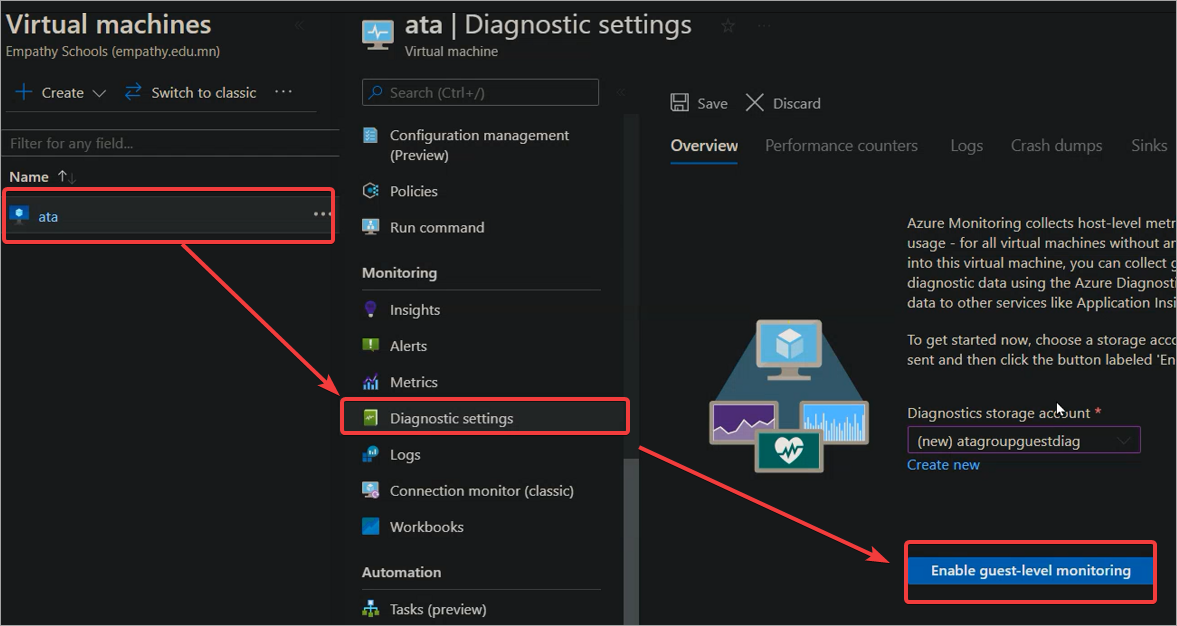
Wait a few moments for the diagnostic setting to complete.
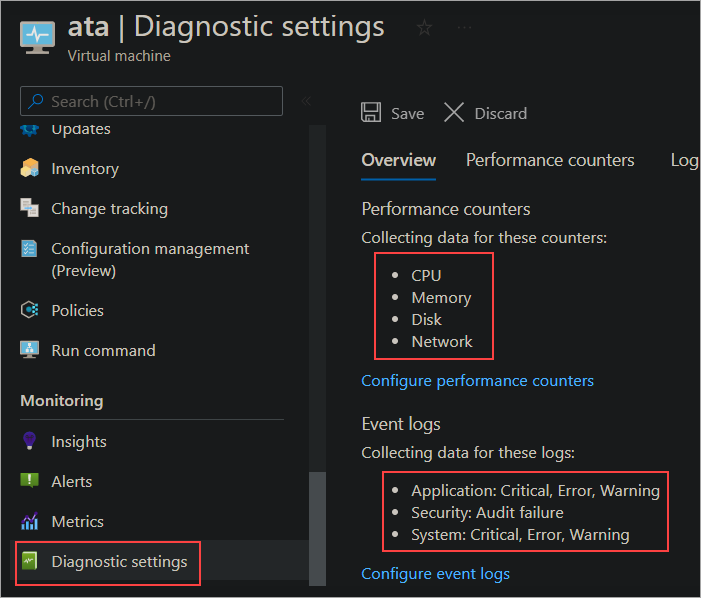
A diagnostic setting is a configuration controlling which data to collect and export. You can create multiple diagnostic settings for each resource, and each setting can export logs to a different destination.
In the screenshot below, you can see that the diagnostic setting is sending data like CPU, RAM, Disk, Network, etc., to your log analytic workspace. All those logs will be stored on separate tables on your log analytic workspace with their unique properties.
Running a Pre-Defined Query
Now that your VM is sending resource logs to your Log Analytics workspace, you can run a pre-defined query to see the data in action.
In this section, you’ll run a pre-defined query using the Log Analytics tool. What is a query? Simply put, it’s a way of asking the data stored in your workspace questions. Log Analytics uses Kusto Query Language (KQL) to formulate queries.
Log Analytics is a tool like a text editor that lets you write, edit, run queries, and then interactively analyze the results.
To run a pre-defined query:
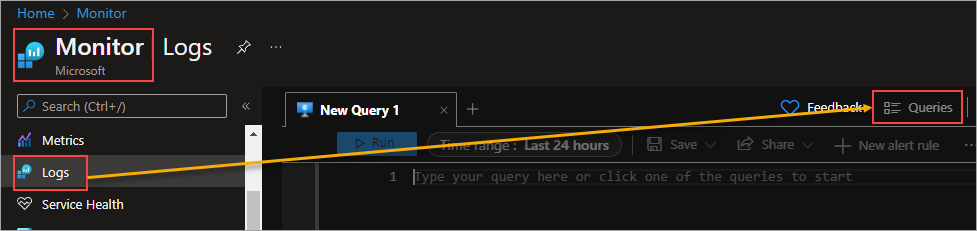
1. Navigate to your Azure Monitoring Logs blade and click on Queries on the top right.
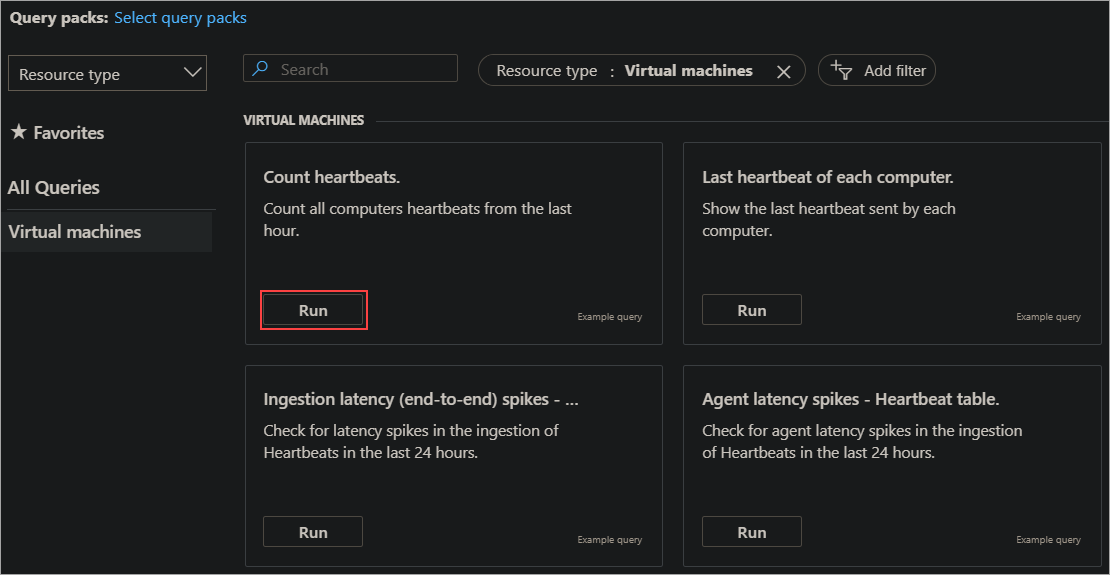
2. You’ll see the list of example queries that you can customize or run as they are. Click Run on the Count heartbeats card to run this query in this example.
What is a heartbeat? It’s a signal that the VM sends to your workspace periodically to let you know it’s still running.
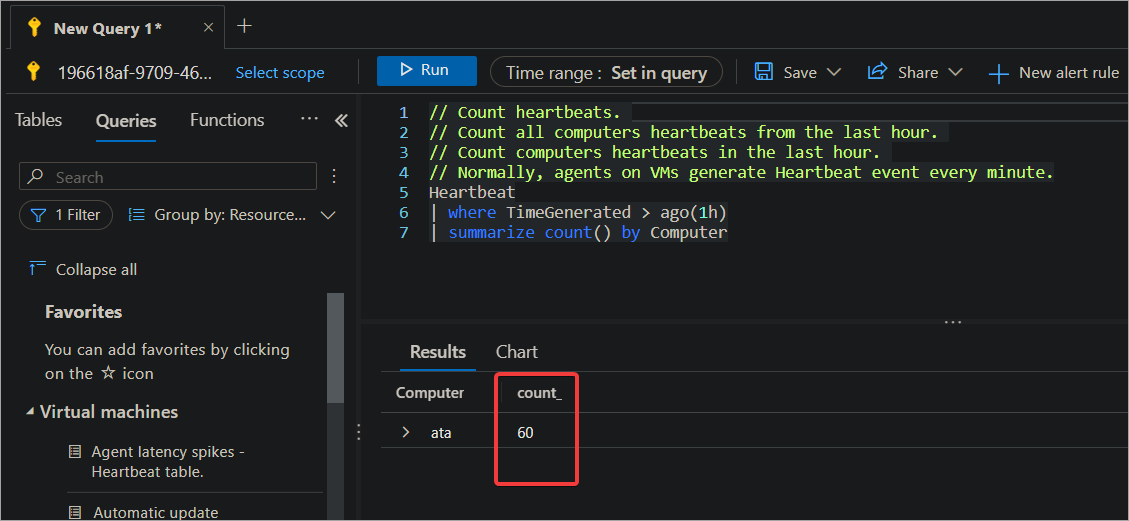
The query returns records in the Heartbeat table. The result shows the total heartbeat count in the last hour by default. The VM sends a heartbeat every minute, so you should see a count of 60 for the past hour.
If the count is less than 60 or zero indicates heartbeat irregularity. In which case might suggest a network or system issue. If so, you can then run other queries like the Agent latency spikes and others you deem related to aid you in troubleshooting.
Writing a Custom Query
In addition to running pre-defined queries, you can also write your custom queries.
Why write a custom query? There are several reasons:
- To answer a specific question that’s not covered by any of the pre-defined queries.
- To analyze data in a way that’s not possible with pre-defined queries.
- To save a query so you can rerun it later or share it with others.
- Schedule a query to run automatically at regular intervals and send you the results by email.
In this section, you’ll load a pre-defined query, modify it, and save it for future use. To demonstrate, you do a slight modification to the Count heartbeats query.
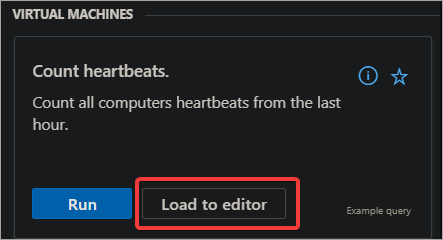
- Select Count heartbeat in the Queries window again, but click on Load to editor to open the query editor.
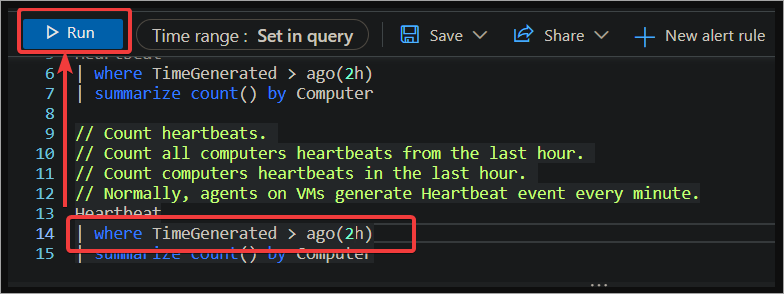
2. Change the time range to the last 2 hours in the query editor by changing the below line.
From:
where TimeGenerated > ago(1h)To:
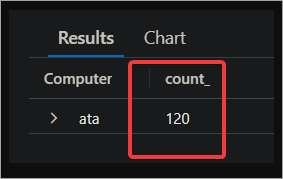
where TimeGenerated > ago(2h)3. Finally, click on the Run button to execute the modified query to test it.
As a result, you will see the heartbeat count for the past two hours, as shown below.
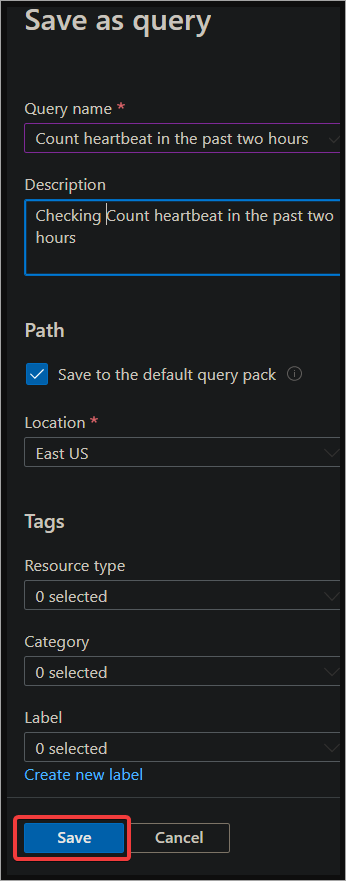
4. Click on Save to save the query for future use. Provide a descriptive Name and Description(optional) for the query and click on Save.

Conclusion
In this tutorial, you’ve learned how to create a Log Analytics workspace and enable the VM insights agent on your Azure VMs. You’ve also learned how to run pre-defined and custom queries on the log data.
Now it’s your turn to put what you’ve learned into practice. Try creating your custom queries and see what interesting insights you can glean from the data. You could also take your analytics further by creating pivots, summarizing your data, and working with charts.
You’ll also benefit from using Log Analytics as the data source for Grafana monitoring. This kind of integration proves that Azure Monitoring Log Analytics is a flexible and adaptable tool in today’s DevOps world.


