Have you ever needed to monitor a single instance or a group of VMware ESXi hosts, but didn’t have a budget for enterprise-grade monitoring? Well, I have some good news for you! You can get the monitoring you need for free with Zabbix monitoring!
In this article, we will build a complete solution. Starting from the ground up, you will gain the knowledge and confidence required to successfully install, configure, and manage a Zabbix server.
Installing Zabbix 5.0 LTS and performing initial configuration steps.
Configuring Zabbix to monitor ESXi hosts using built-in templates.
Configuring triggers based on items being monitored and explore alerting capabilities.
By the end of this article, you will have all the required knowledge to begin monitoring your VMware ESXi hosts. We will close out with all the additional resource links you will need for your Zabbix journey.
Are you interested? If so, keep reading.
Prerequisites
To be fully successful in following along with this guide, you are going to be willing to get real-life, hands-on experience. Don’t worry though. Everything you need and should know is outlined. Even if you may be lacking experience in some areas, this guide explains each step, what is needed, and why. So if you intend to follow along and build this solution yourself, here are the expectations ahead of time.
It is assumed that:
You have basic command-line knowledge and some Linux OS experience.
You are comfortable with basic networking concepts and terminology.
You have some basic knowledge of VMware ESXi hypervisor technology.
Zabbix can be installed using different distributions of Linux, and even has a couple of choices for web servers and databases. But for this guide, we’ll focus on defaults. If you plan to follow along, you will need:
At least one or more ESXi hosts and optionally some VM guests (to simulate a monitoring scenario later). You can host your Zabbix VM on the same host you plan to monitor as well.
You may be wondering why an SSH client is optional. While this guide will be using the native PowerShell 7 capability of opening SSH connections, the choice is yours on what SSH client tool you want to use to connect to the Linux VM. If you are just planning on using a virtual machine management console, you may have to do extra typing as the SSH clients will allow you to paste the code examples in this guide.
Once you have met all of the prereqs, it’s time to begin installing your Zabbix server. The following steps will get you up and running in about six minutes. So let’s start!
Adding the Zabbix Repository
The step in the installation process is preparing to add the Zabbix repository to Ubuntu so you can download and install the package.
First, SSH to your Ubuntu Linux server.
Using the wget command, download the Zabbix repo. When you press Enter, your server will begin to download the source repository information from Zabbix. Now you can install Zabbix direct from per-compiled packages.
3. Now unpack the download to add the configuration to your local repository list. Using the following command, unpack the download:
sudo dpkg -i zabbix-release_5.0-1+focal_all.deb
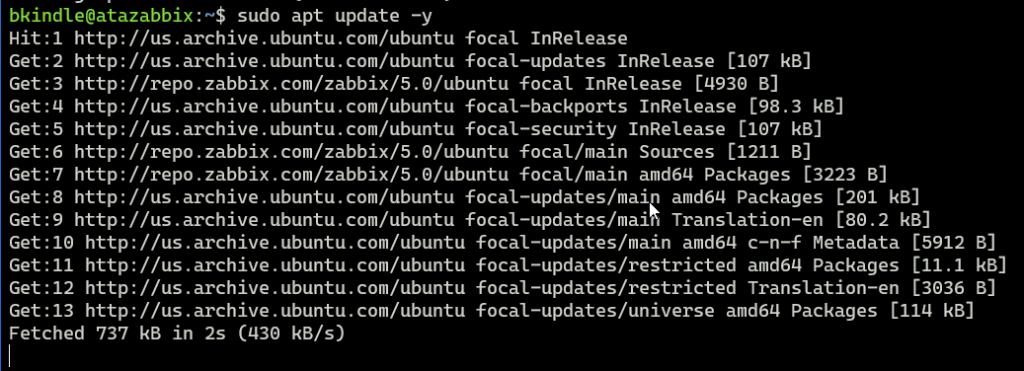
This process happens pretty quickly. As a best practice, re-run the sudo apt update -y command again, just as you did when finishing the Ubuntu Server setup and configuration. You should see the Zabbix repositories as shown in the following screenshot:
Output after updating APT repository on Ubuntu Server.
Now you are ready to begin installing Zabbix components.
About Zabbix Components
There are three major components to every Zabbix deployment:
Zabbix Server (which contains MySQL or Postgre SQL)
Zabbix Web Front End (apache2, httpd, nginx, php 7.4)
Zabbix Agent
Zabbix does support splitting Zabbix Server and Zabbix Web Front End into standalone instances. Splitting up components is more advanced and isn’t a typical scenario. Therefore, this guide will not cover that type of setup.
Each of these components represents a core component for Zabbix.
Zabbix server daemon – handles the back end operations. It’s the central process. Zabbix server performs polling and trapping of data, calculations of triggers, and sending notifications to users. It’s the central repository for configuration, statistical and operational data. You can read more about the Zabbix server process here.
Zabbix web front end – a term used for the webserver components used. For this guide, you are going to be using Apache2 / HTTPd / PHP 7.4. All of these components combined serve the web interface and visualizations you will see later on in this guide.
Zabbix Agent – a local agent that gathers data, and reports it to a central Zabbix server for additional processing. These agents use native system calls to gather data. The Zabbix agent is supported on nearly every OS platform available today. You can read more about the Zabbix Agent here.
Installing Zabbix Components
To begin installing the Zabbix components, enter the following command. The components will start downloading and installing from the Zabbix repository we configured in the previous step. The -y parameter just skips the confirmation dialogs.
Once complete, you are ready to move on to setting up the MySQL server, creating a blank database, and importing a predefined schema into said database.
Creating and Configuring the Zabbix Database
Zabbix requires a database to store statistical and configuration data. The most common choice is MySQL. Ubuntu Server 20.04 default repositories use MariaDB, which is the upstream version of MySQL, both are open-source relational database systems. You could instead choose to use PostgreSQL, but the process is a little different. For this guide, use the default choice, which is MariaDB.
Begin setting up the database server by creating a blank database. Connect to your local MySQL server by typing the following command and pressing Enter. You may be prompted for credentials. Recall the credentials you used during the OS installation and SSH connections should be the same that you use here if prompted.
> sudo mysql
You should now see mysql> at the terminal prompt. From here we can begin to issue MySQL-specific commands to set up the database. The database configuration process creates the database, then creates a user, and then assigns that user privileges on the database before exiting MySQL.
Using the following command, create a blank database called zabbix, which will be the database used by the Zabbix server to store all collected data.
create database zabbix character set utf8 collate utf8_bin;
Next, you need to create a user and assign that user a password. Be sure to replace 'password' with something more secure, keeping the single quotes, and document it. This password will be used later in the guide. This is the account that will be able to connect to and modify the database:
create user zabbix@localhost identified by 'password';
Now you need to grant that user privileges on the newly created database and all tables within the database. This user is what the Zabbix server uses to write data collected to the appropriate tables in the zabbix database.
grant all privileges on zabbix.* to zabbix@localhost;
If you received no errors, quit the connection by typing the following command and pressing Enter:
quit;
You should now be returned to the Bash prompt.
Importing the Zabbix Database Schema
At this point, you have an empty database. There are no tables or structure. The next step is the import the schema using a script and database template provided by Zabbix.
The code example below is going to use the command-line utility zcat to expand the compressed SQL file that contains the Zabbix database schema. This is all sent to standard output, which is then piped into MySQL using the -uusername zabbix, require you be prompted for a -p password and then what database to connect to, zabbix. The -uzabbix -p zabbix credentials are not must be typed exactly as shown below or the script will not create the database schema.
Using the following command, execute the script provided with the Zabbix server installation to import the schema:
sudo zcat /usr/share/doc/zabbix-server-mysql*/create.sql.gz | mysql -uzabbix -p zabbix
This will take a minute or two to execute. When you return to the Bash prompt, you can continue.
Configuring Zabbix Server
Using the built-in text editor Nano that comes with Ubuntu Server, you need to make a couple of edits to the /etc/zabbix/zabbix_server.conf file.
You can use Vim too if that works better for you. This guide uses Nano in screenshots and instruction, but the actual edits do not change based on your choice of text editing utility.
There are two parameters you will need to search for, uncomment, and edit. Those are DBPassword and StartVMwareCollectors.
You can quickly search for these options using CTRL+W when using the nano text editor.
Begin by opening zabbix_server.conf with nano and making the required edits. Type the following command into your terminal prompt and press Enter:
> sudo nano /etc/zabbix/zabbix_server.conf
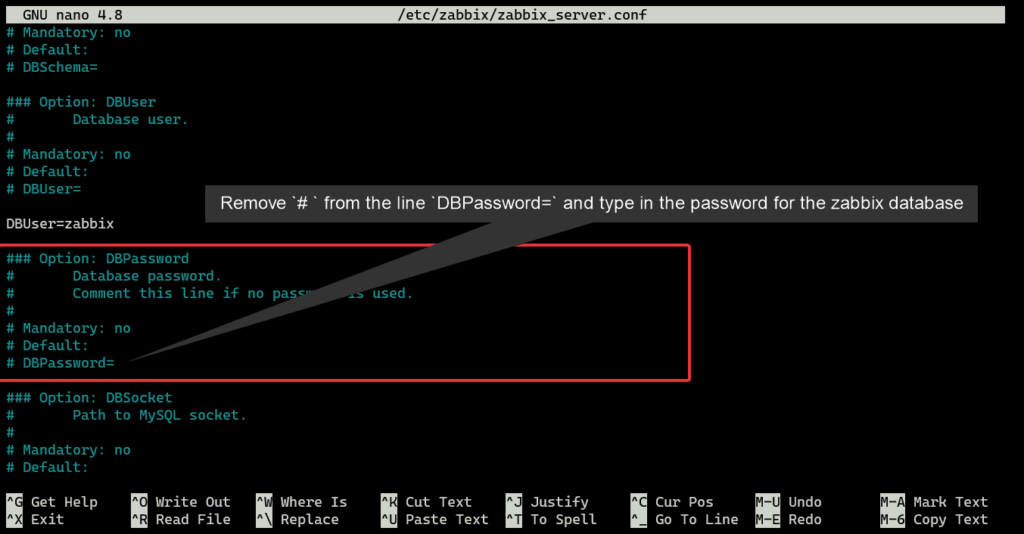
After opening the Zabbix server configuration file, use the shortcut key combination CTRL+W to search for the DBPassword parameter and press Enter. You should now see the DBPassword parameter options, as shown below. Remember, you are entering the password used for the zabbix@localhost database user, not the database server password.
Editing the DBPassword parameter in /etc/zabbix/zabbix_server.conf using nano on Ubuntu Server
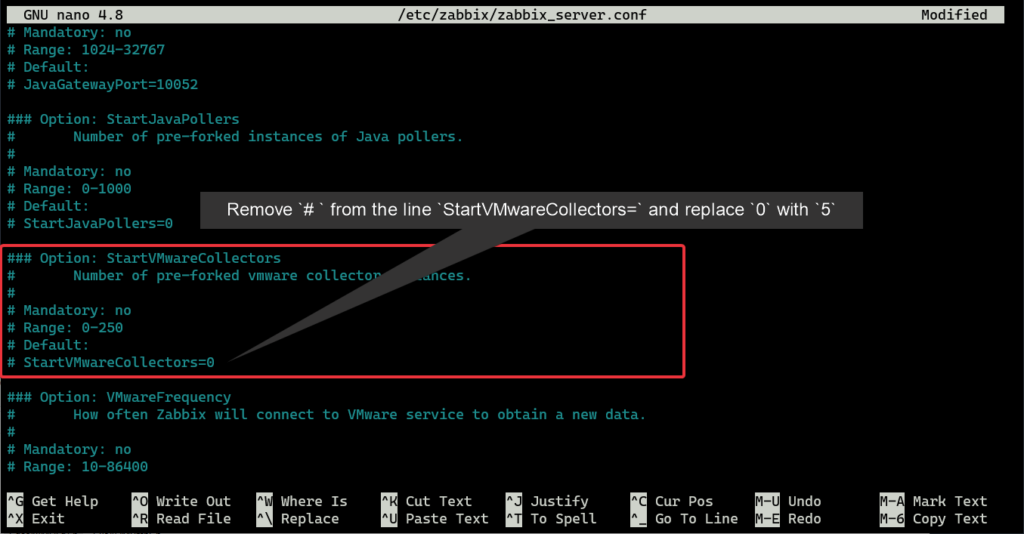
Now edit StartVMwareCollectors. Using CTRL+W again, search for StartVMwareCollectors and press Enter. You should now see the StartVMCollectors=0 parameter below. Edit StartVMwareCollectors parameter and assign a value of 5.
Editing the StartVMwareCollectors parameter in /etc/zabbix/zabbix_server.conf using nano on Ubuntu Server
Before you save the file, you may have noticed there is a couple of other VMware related parameters. You do not need to edit these at this time as the defaults are fine. However, if you would like to write different settings, I encourage you to take a look at the full list of parameters here.
Save your changes using CTRL+X, choose Y, and then press Enter. You will be returned to the Bash prompt.
The last configuration you will need to edit in /etc/zabbix/apache.conf. This file controls the settings for the Zabbix web front end.
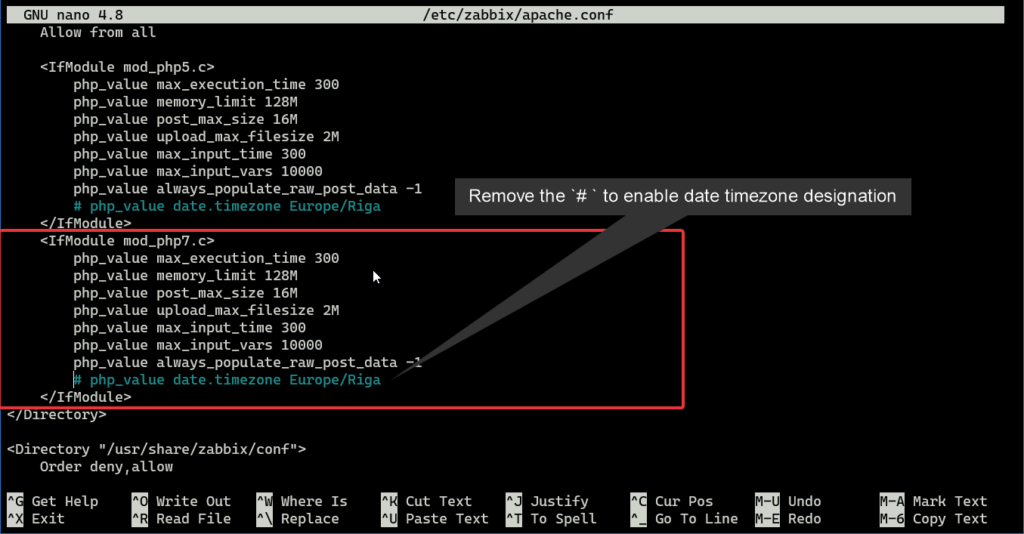
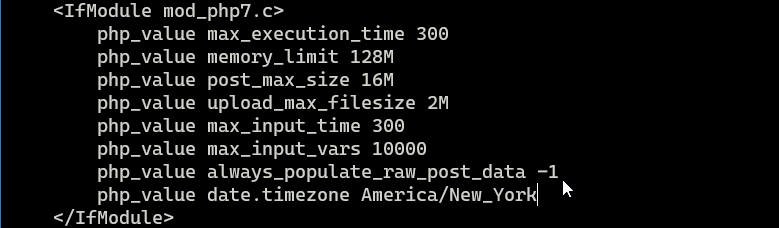
Change the line in the <IfModule mod_php7.c> section. This is the section for PHP7 configuration parameters. The older <IfModule mod_php5.c> section is for PHP5 and here for backwards compatibility. PHP5 is no longer used in Zabbix starting with Zabbix 5.0 due to security vulnerabilities.
Editing the Apache configuration in /etc/zabbix/apache.conf using nano on Ubuntu Server
Uncomment the line # php_value date.timezone Europe/Riga and change to the timezone you wish to use. For example, you could enter America/New_York to set the timezone to Eastern Standard Time. See this site for a complete listing of valid PHP timezones. Your configuration should look similar to the screenshot below:
php_value date.timezone value set to America/New_York
Save your changes. You return to the Bash prompt. You are now ready to start the Zabbix server.
Starting Zabbix Server
Restart the Zabbix services and enable them so they will auto start on reboot.
Using the commands below, you are restarting the Zabbix server, agent, and apache2 daemons so that your configuration file edits will take effect. Then you are enabling these daemons to auto start after reboot. If you do not do this, you will have to manually start services each time your host is taken down for maintenance or becomes unstable and is rebooted.
You can now log off your SSH session, and close your terminal.
You should now be able to open any modern web browser and navigate to the Zabbix web front end and finalize the initial configuration. That’s precisely what you are going to do in the next section.
Setting Up Zabbix Web Front End
You are almost done! From your web browser, navigate to http://[IP_Address]/zabbix/ and follow the on-screen instructions. Use the static IP address you configured your server to use during the OS installation.
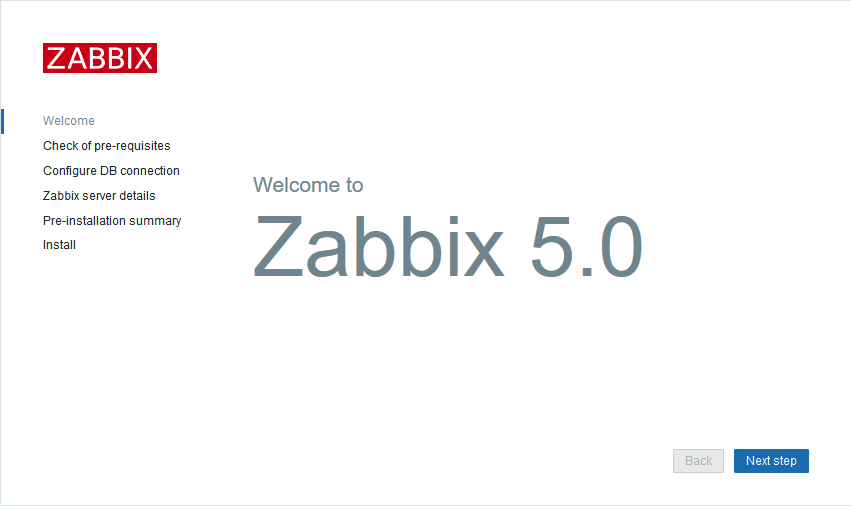
The first page you come to is a welcome page. Click on Next step:
Zabbix web front end welcome page
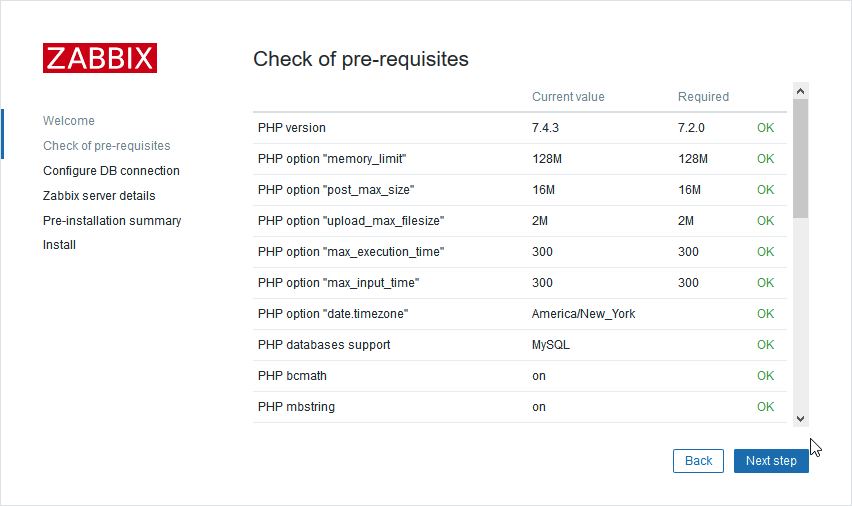
Next, Zabbix will run through a list of pre-requisites. You should see all OK statuses as you scroll down the list. At this point, you will see if the edits you made earlier are correct. If they are not, the setup wizard will not proceed until you make the corrections in your configuration files. If everything is correct and documented, click on Next step:
Zabbix web front end Check of pre-requisites
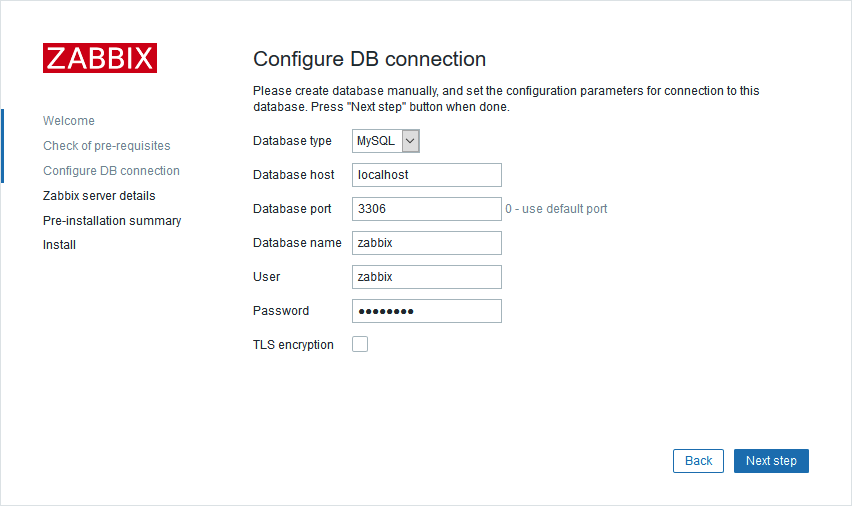
Now supply the database connection info to the web front end. Be sure to change the Database Port (if you did not use the default MySQL port 3306) and enter the database user password you configured when setting up the Zabbix database. If everything is correct and documented, click on Next step:
Zabbix web front end Configure DB connection
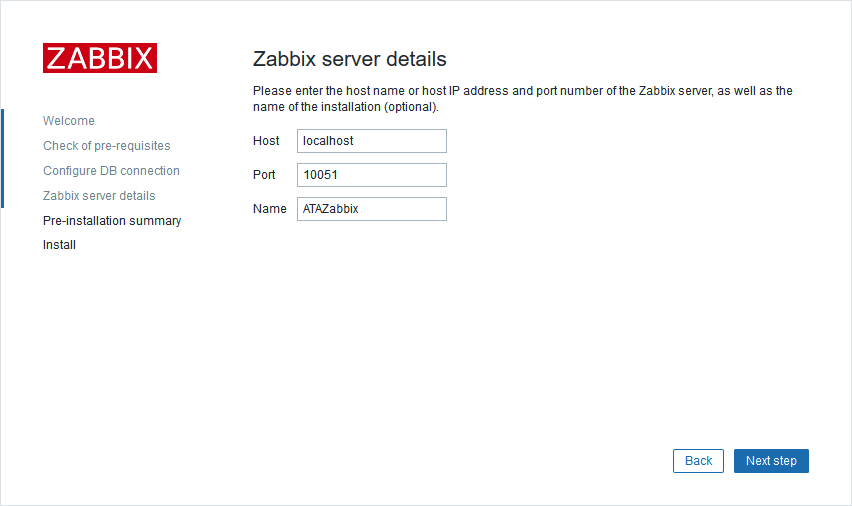
Lastly, give the Zabbix server a Name and leave the default values for Host and Port. Any name will work, this is just a way to label your Zabbix server in the Zabbix UI. As a best practice though, try to use the actual hostname of your server. When satisfied, click on Next step:
Zabbix web front end Zabbix server details
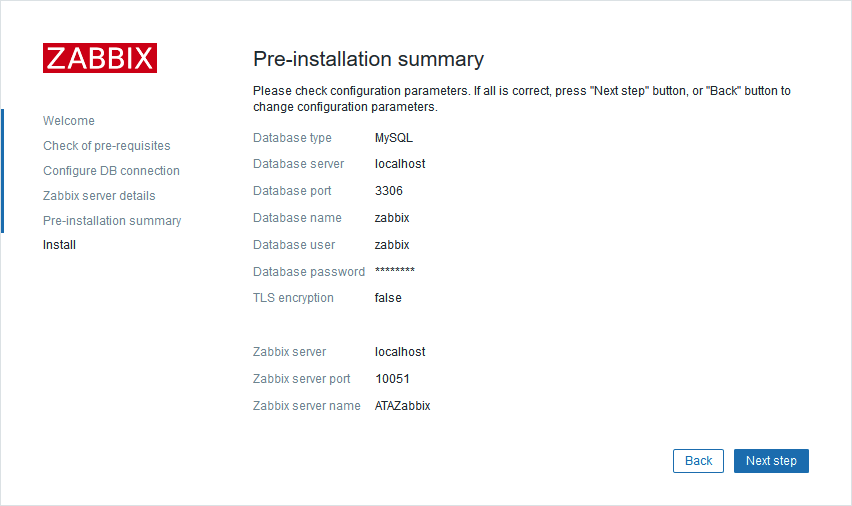
Lastly, verify the Pre-installation summary information. This is another good point to document your Zabbix server configuration. When satisfied, click on Next step:
Zabbix web front end Pre-installation summary page
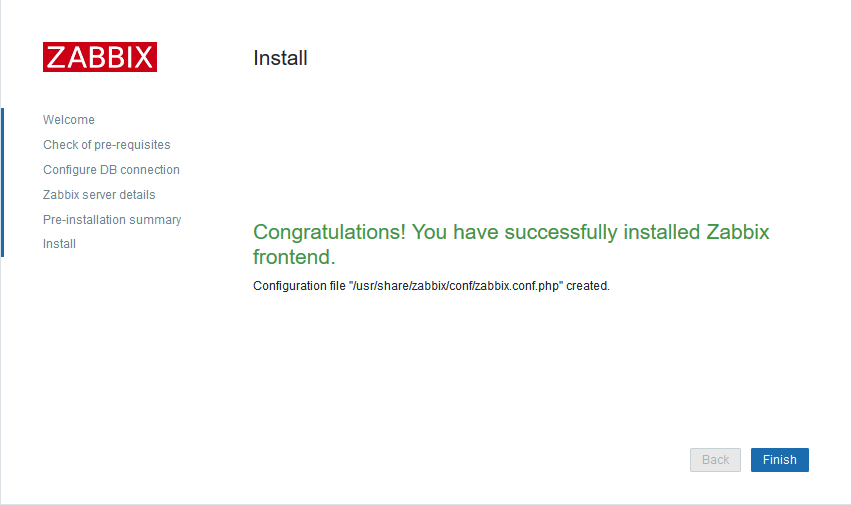
The installation is now complete. Click on Finish.
Zabbix web front end complete
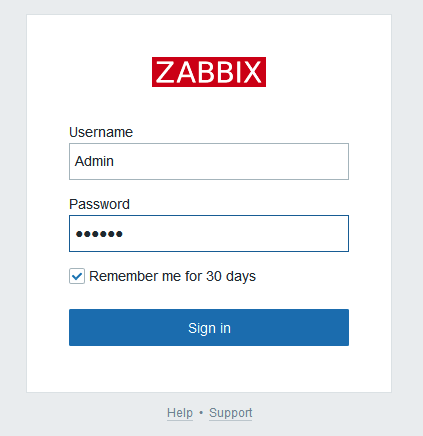
You will now be returned to the Zabbix server login page. The default credentials to log in are case sensitive. Every time you install a new instance of Zabbix, the default credentials are Admin / zabbix :
Zabbix server web front end log in page
Monitoring a VMware ESXi Host
You’ve completed the most difficult part by installing Zabbix. Now that you have a fully working Zabbix UI, it’s time to get down to what this guide is all about.
In this section, you are going to be walked through the process of configuring and adding a VMware ESXi host to Zabbix and configuring a trigger to alert you of the status on the host when a condition is met. Remember, Zabbix can monitor nearly any device you can connect to. The steps you will be doing to add a VMware ESXi host are nearly identical with some variances for other types of devices.
Adding a VMware ESXi Host
To begin monitoring a VMware ESXi host, you need first to create a host. A host in Zabbix is any device you wish to monitor, such as servers, workstations, virtual machines, switches, routers, firewalls, etc.
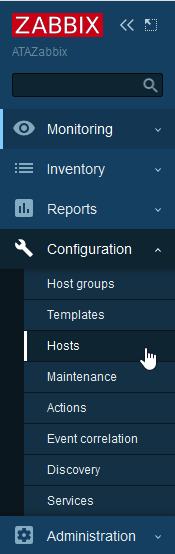
To do so, use the navigation menu on the left side of the Zabbix UI and click to expand the Configuration menu, and then click Hosts:
navigation menu on the left side of the Zabbix UI
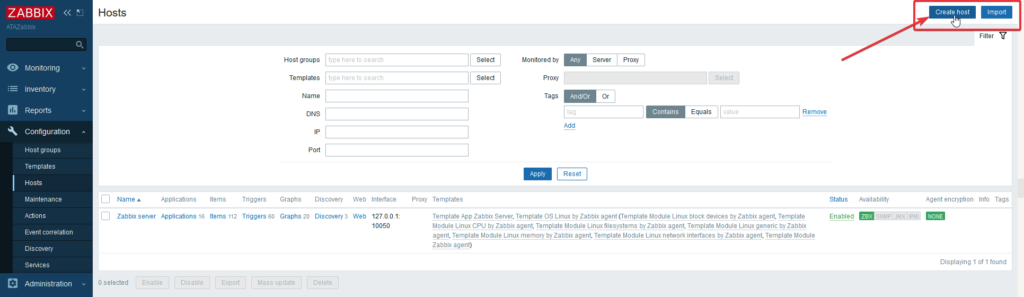
Now click the Create host button. This button is located in the upper right corner of the web UI:
Zabbix Hosts screen
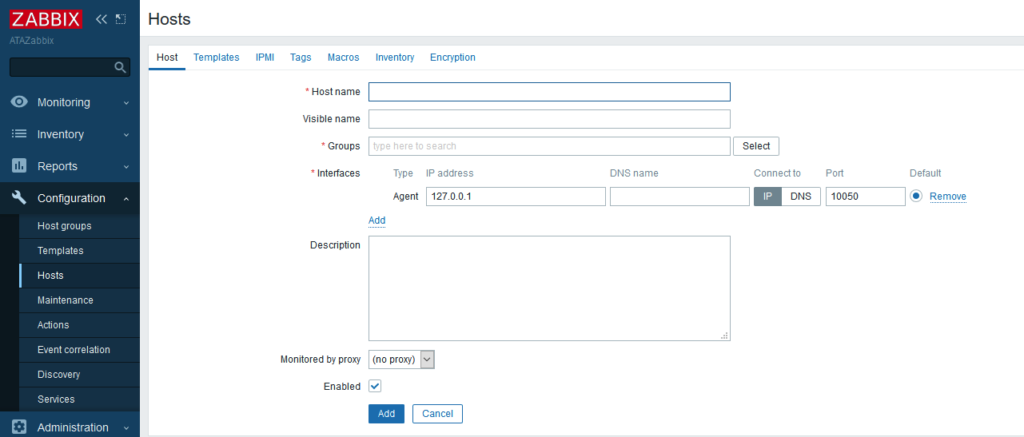
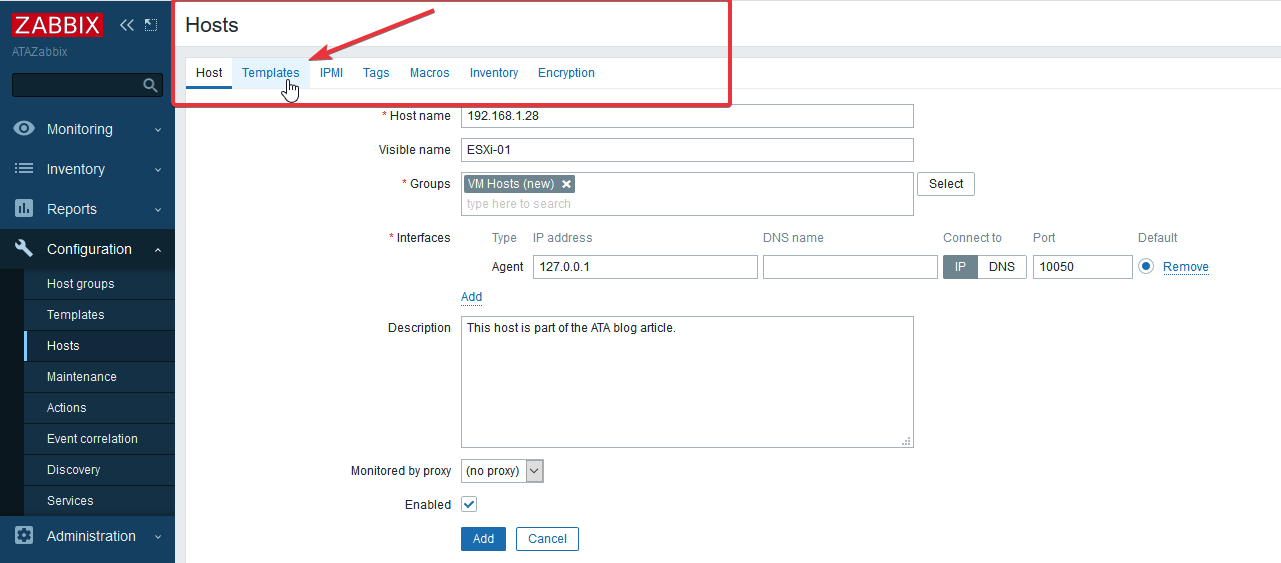
Now enter some information regarding the VMware ESXi host you wish to monitor:
Zabbix Hosts configuration screen
Here are some parameters definitions:
The hostname is just a unique name for the device to be monitored. This field can be an IP address or FQDN. No leading or trailing spaces, but you can use alphanumeric, dots, dashes, and underscores.
When using the Zabbix Agent, do be sure to use the same hostname here as you do in the agent configuration file. If you do not use the same hostname, active checks will fail. This is a required parameter.
Visible name is where you can give your device a friendlier name that will be sued on lists, maps etc. It’s an optional parameter.
Groups are just that-Groups of hosts that belong together. Every host has to belong to at least one group. You can choose an existing group or create a new one.
Interfaces can be a few types that are supported by Zabbix. Those are Agent, SNMP, JMX (java), and IPMI (out of band IP management interface like iLO/iDRAC) This is a required parameter but does not require modification for monitoring VMware ESXi hosts.
Description is also an optional parameter, but it’s a good idea to use this opportunity to document what you are doing by adding one.
Monitored by proxy is an optional parameter and can be left at the default. Zabbix proxies are out of the scope of this guide.
Enabled should be checked. If it is not, be sure to select it so that the host will be active and monitored.
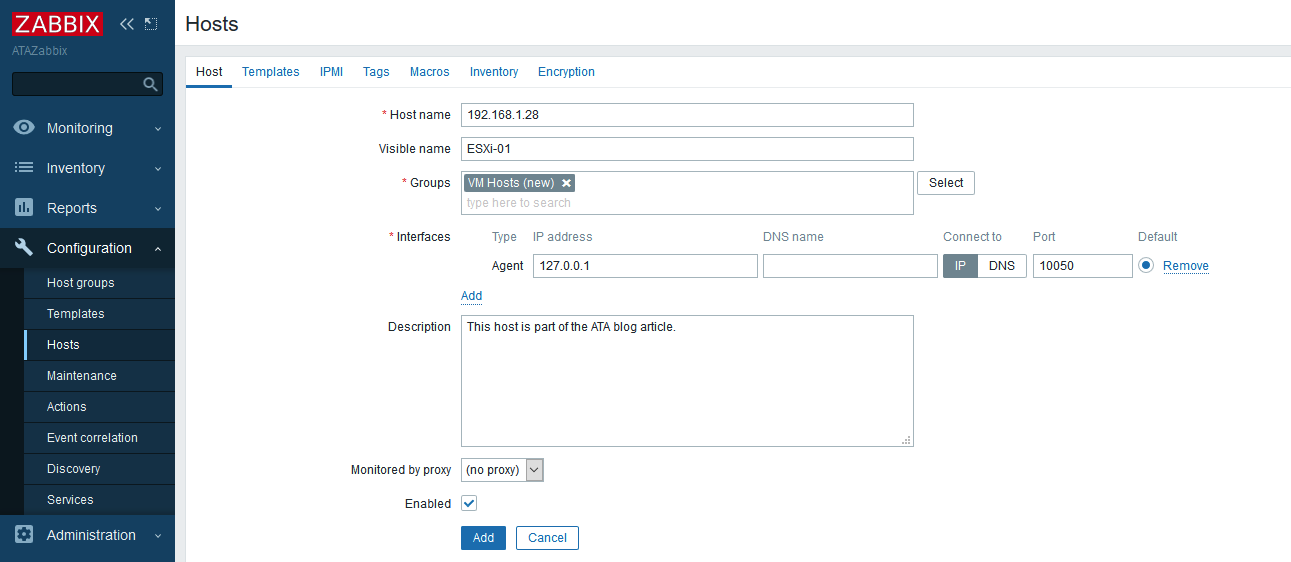
Enter the IP address of the VMware ESXi host you want to monitor int he Hostname field, give it a friendlier name in the Visible name filed, Create a new Group called “VM Hosts” and add a simple Description of “This host is part of the ATA Blog guide.”.Do not click Add yet!
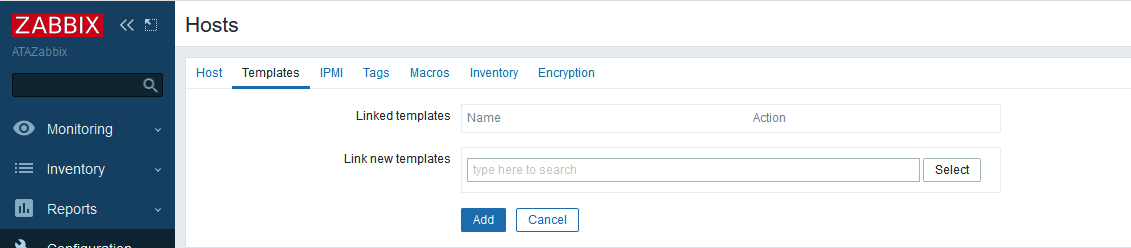
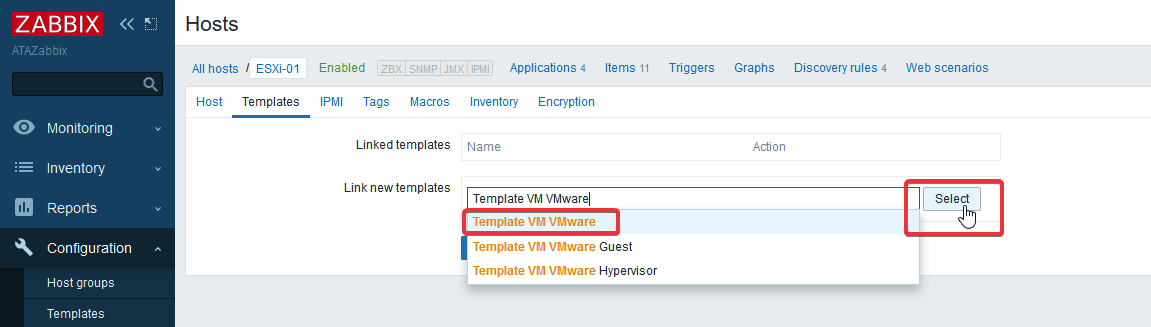
Link the template called Template VM VMware. This will add all the appropriate item expressions and definitions for ESXi hosts. If you start typing that name into the search field, you will see autocomplete suggestions. You can save some time typing by using the arrow key and pressing enter once you see the correct template. Do not click Add yet!
You see two other templates listed. Those are Template VM VMware Guest and Template VM VMware Hypervisor. These two templates are actually Low-Level Discovery (LLD) templates that are part of the one you are choosing. These will use low-level discovery rules to gather additional information about the host you are adding.
You may get an error message about unsupported items mentioning an invalid hypervisor UUID. You can try enabling an option on your VMware ESXi host for Module Object Browser. Follow this KB for details. With that said, if you have chosen the correct host template, you should not see this with a generic ESXi host.
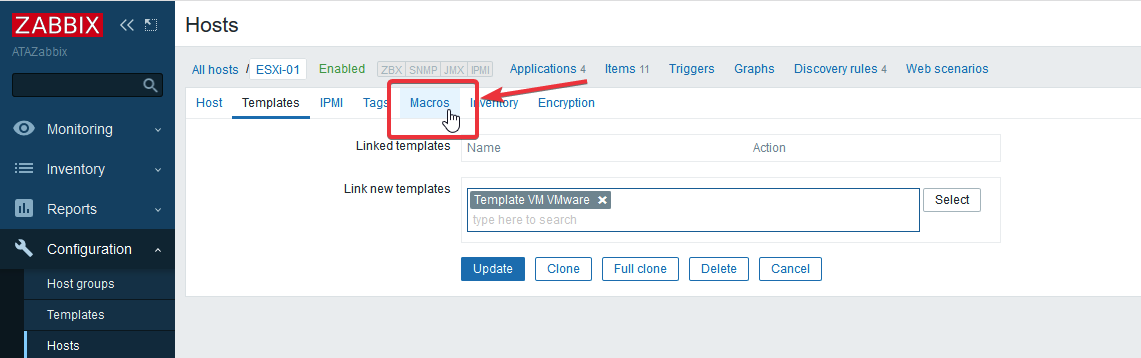
Now for the last host configuration step. Before Zabbix can connect to VMware ESXi hosts, you have to supply some host macros or parameters that will allow you to connect to the VMware ESXi host. To do so, click on the Macros menu item in the Hosts configuration screen:
Zabbix Hosts configuration screen menu
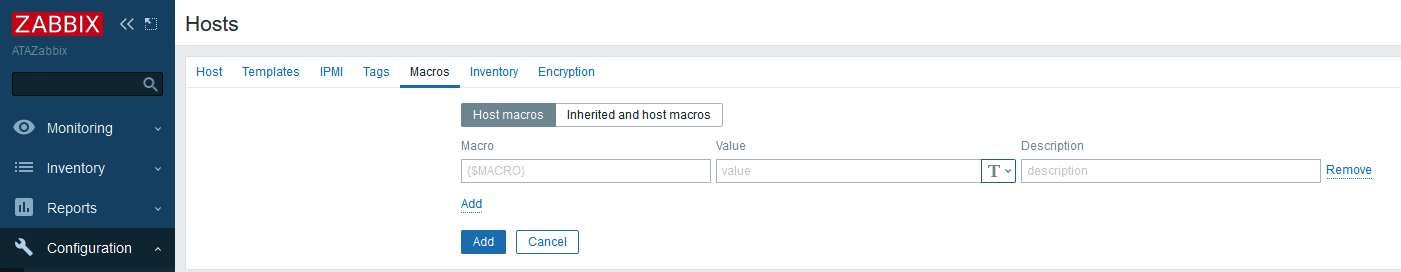
The next screen will look like this:
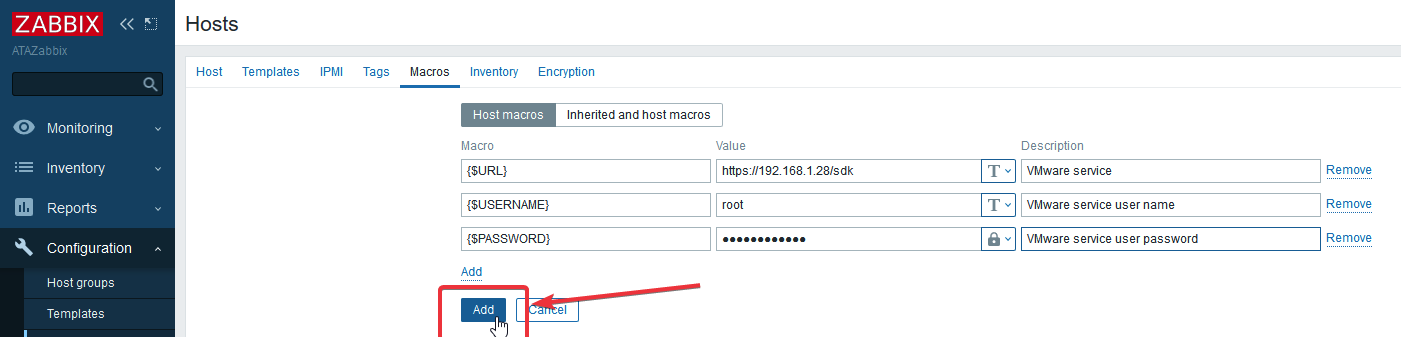
Zabbix Hosts Macros configuration screen
Now supply the following host macros that will enable Zabbix to perform simple checks against the host you are configuring. There are three required parameters:
{$URL} – VMware service (vCenter or ESX hypervisor) SDK URL
{$USERNAME} – VMware service user name
{$PASSWORD} – VMware service {$USERNAME} user password
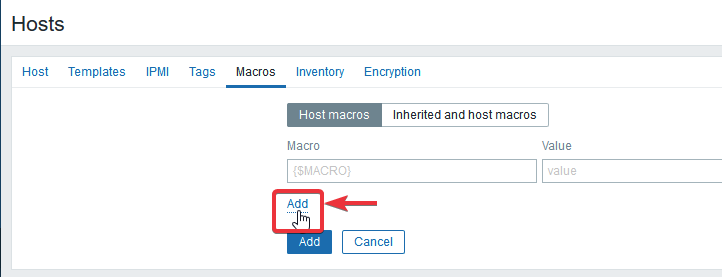
By default, you only have one macro field, but you will need two more. The reason you need additional macros is that you need to supply additional parameters. Clicking on Add will add an additional field for the next parameter you want to assign. Click on Add as shown in the screenshot below two more times:
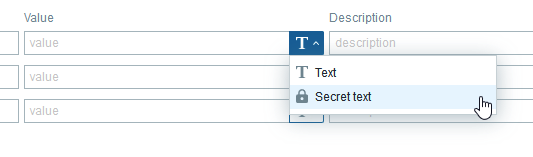
All user macros can be secured using this option and are great for API tokens, passwords, and other sensitive information that you do not want to be exposed to non-admin users. It is recommended to use this option.
Secret Text Option
Once this step is completed, you can now click the blue Add button as show below:
Add Host to Zabbix Server
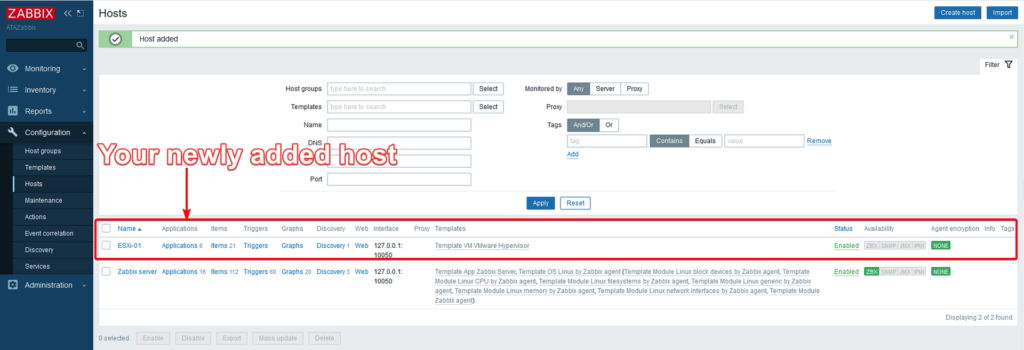
You will be returned to the Hosts Configuration page. You should now see that your VMware ESXi host is now listed:
ESXi-01 added to Hosts
Don’t be alarmed if you do not see any values for items being monitored right away. It can take up to an hour to begin receiving data from the VMware ESXi host. You can also add other templates for VMware guests and VMware (for logs) if you choose.
Creating a Trigger for Alerting
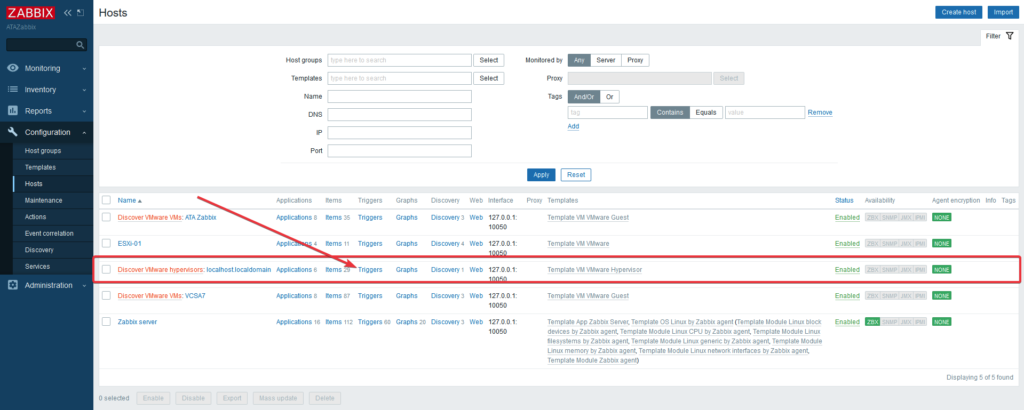
In the meantime, now configure a trigger based on items already being monitored. Thanks to the low-level discovery templates linked to the template you applied to your host, information is pouring in. There’s a lot of details on the hypervisor, and even a few of the guests (if you have guests)! You will see that information being gathered when viewing Latest Data. You can explore the items that each host contains to get an idea of what you could create an alert for. But for this guide, you are just going to create a simple trigger.
Creating a trigger will enable you to get an alert based on the condition(s) you assign. For instance, you would like to know when your tiny home lab ESXi hypervisor begins to run low on memory. You have so little available memory, you decide that you need to be alerted when the usage is at or over 8GB. Now in this lab, the hypervisor name is the default localhost.localdomain, so that’s the one used in the examples going forward. To begin creating the condition for your alert, click on the Triggers link as shown below:
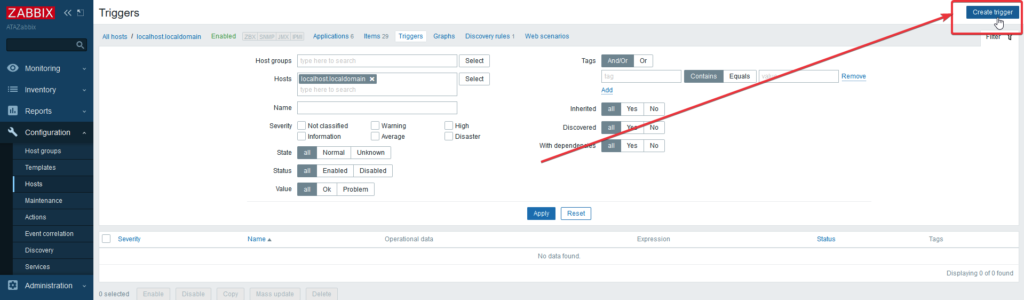
On the following screen, click the Create Trigger button in the upper right corner:
Create Trigger for discovered VMware Hypervisor localhost.localdomain
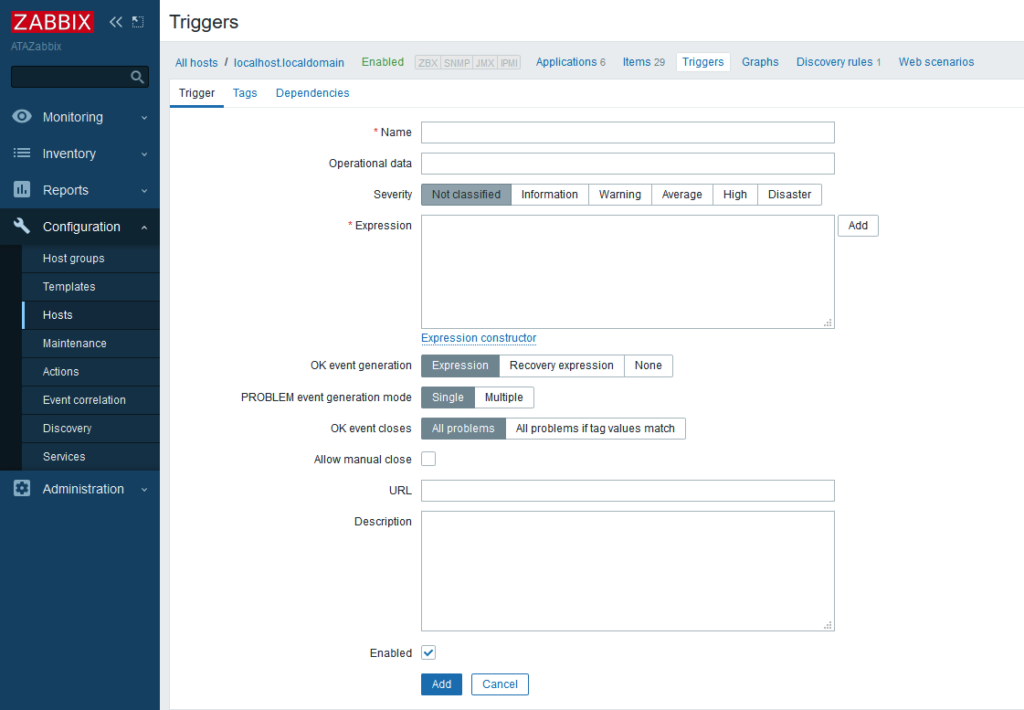
You should now see the Triggers configuration screen:
Creating Trigger for localhost.localdomain
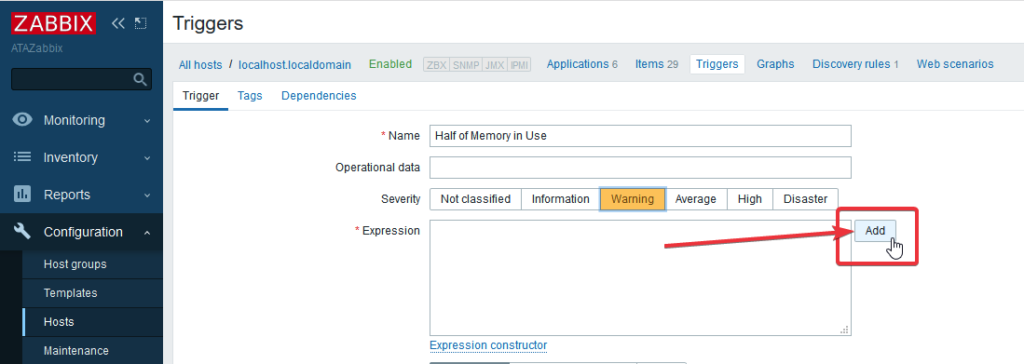
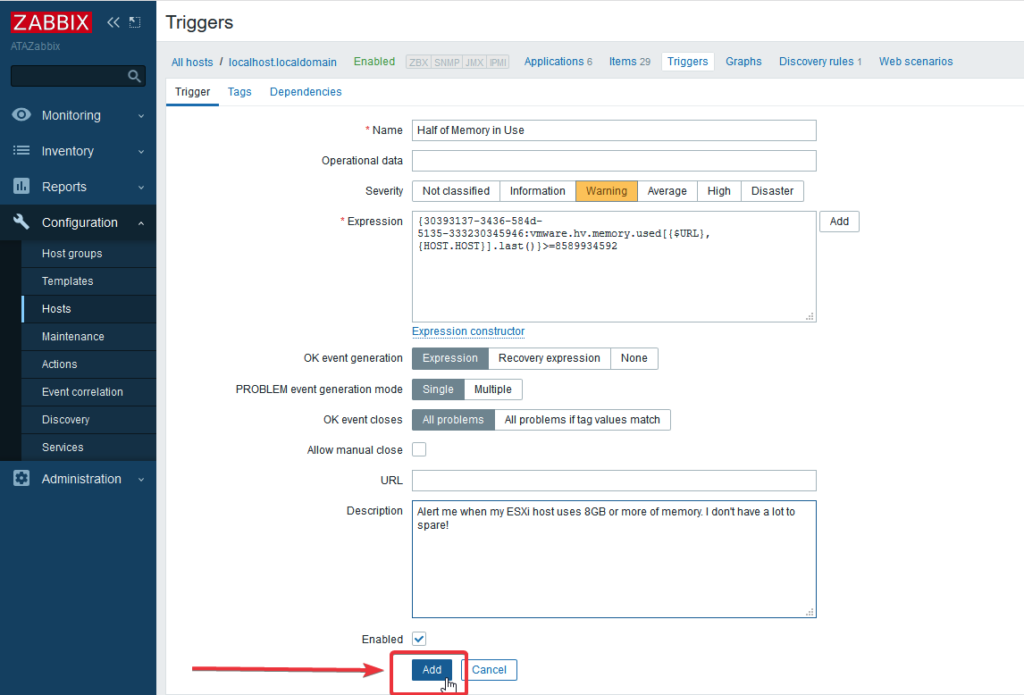
Let’s give the trigger the meaningful name Half of Memory in Use, and select the Severity level of Warning. Next, in the Expression field, click the Add button as shown below to begin creating a conditional expression for the trigger:
Creating trigger conditions for localhost.localdomain Trigger
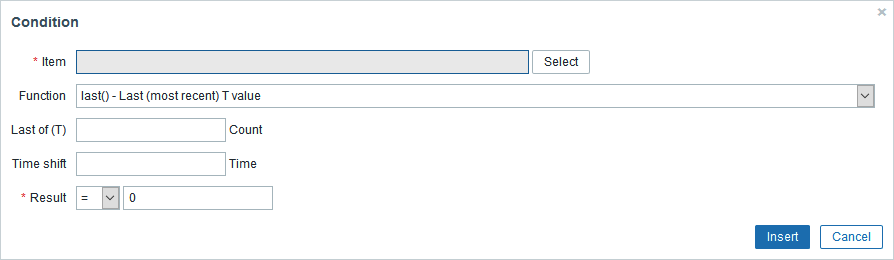
A pop up will appear that will allow you to select conditions for the trigger. Start by clicking Select in the Item field:
Conditions for the Trigger
Click on Select to begin viewing the available items you can create conditional expressions for:
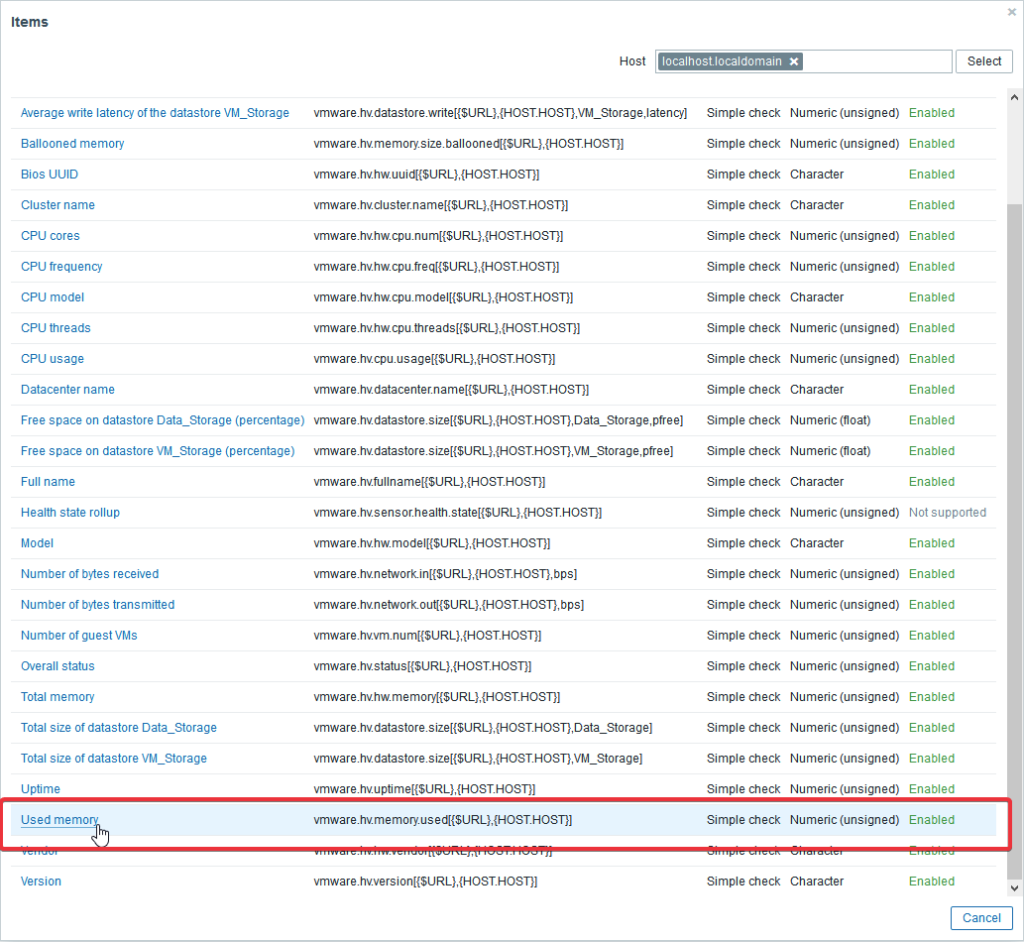
Available Items to be used in Condition
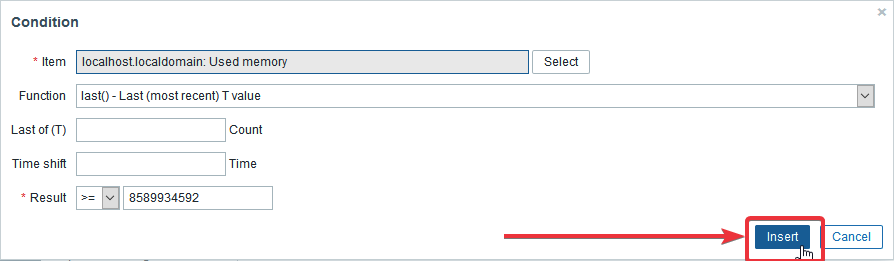
After you scroll down the list, find Used Memory, and click it. This will add the item to the condition expression. You have three additional fields that can be manipulated. Those fields are Function, Last of (T) Count, and Time shift Time. These are all part of predictive trigger expressions and out of scope for this guide. For now, stick with the default function selection and then change the resulting drop-down from = to ≥=. Zabbix primarily deals in bytes when it comes to memory readings, so you will give a value of 8589934592 which is 8GB. When done, click on Insert to resume Trigger setup:
Adding Used memory conditions to Trigger expression
You will be returned to the trigger expression screen. There are some other options here, but one, in particular, that is worth mentioning. The OK event generation option is the opposite of Problem event generation. Problem and is just a state of your trigger. Think of it this way. When your conditional expression evaluates to TRUE, then a problem event is created. When the next check interval executes and conditional expression evaluates to FALSE, then an OK event is generated. You could add a separate trigger expression to generate an OK event based on a conditional expression. This could be useful for automation of alert handling if your ESXi host shut a few VM’s off and stopped using so much memory.
Add a simple description and ensure that the Enabled box is checked and click on Add:
Add Trigger with completed condition expression
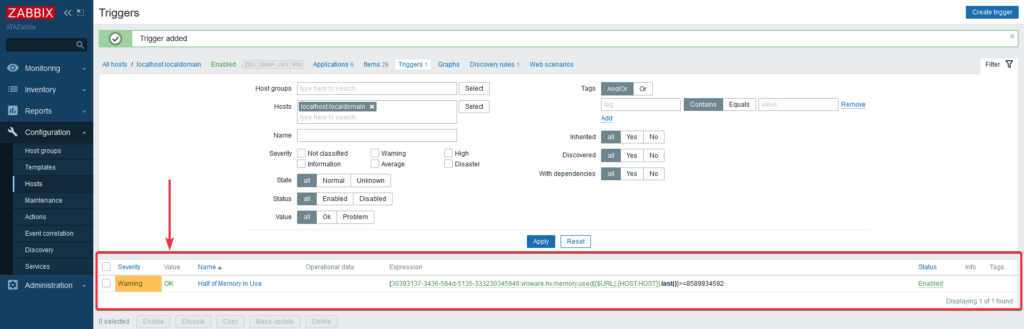
And now you have the first trigger created for your ESXi host:
Trigger added to host
The initial Value should be OK as long as the trigger expression is evaluating to FALSE. If the trigger expression evaluates to TRUE, you would see a value of PROBLEM. Now time to run a test on the trigger. You will see the alert on the monitoring dashboard if your trigger condition expression is true in the next section.
Viewing Alerts
Let’s say you’ve decided to spin up some new Linux VM’s on your ESXi host. You’ve assigned your Junior Sysadmin the duty of minding the systems monitoring you’ve put in place.
After morning coffee, your junior sysadmin calls you up.
“Hey Boss. You have an alert on one of your VMware hosts. Are you doing deployments on the wrong host?”
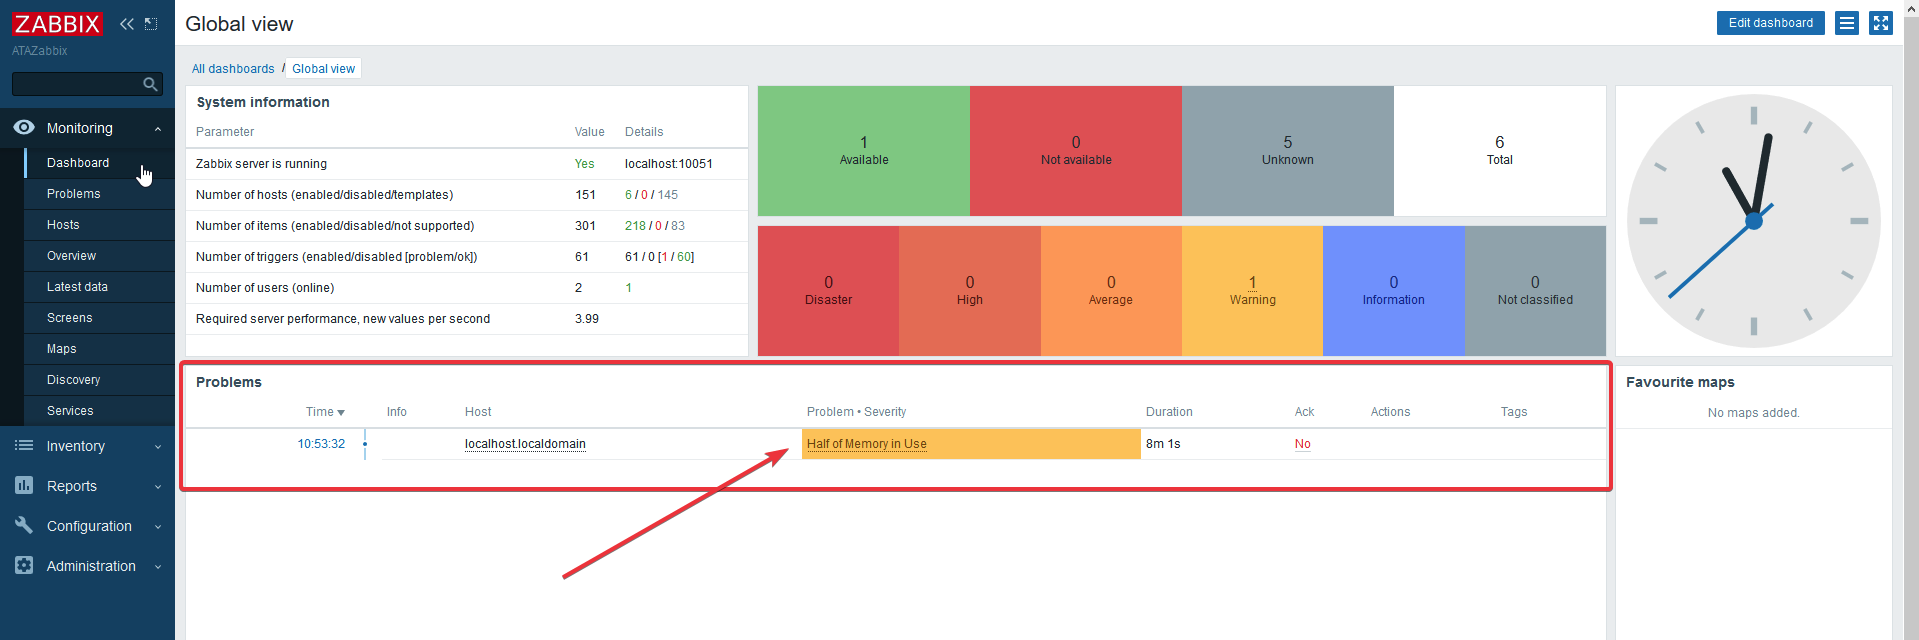
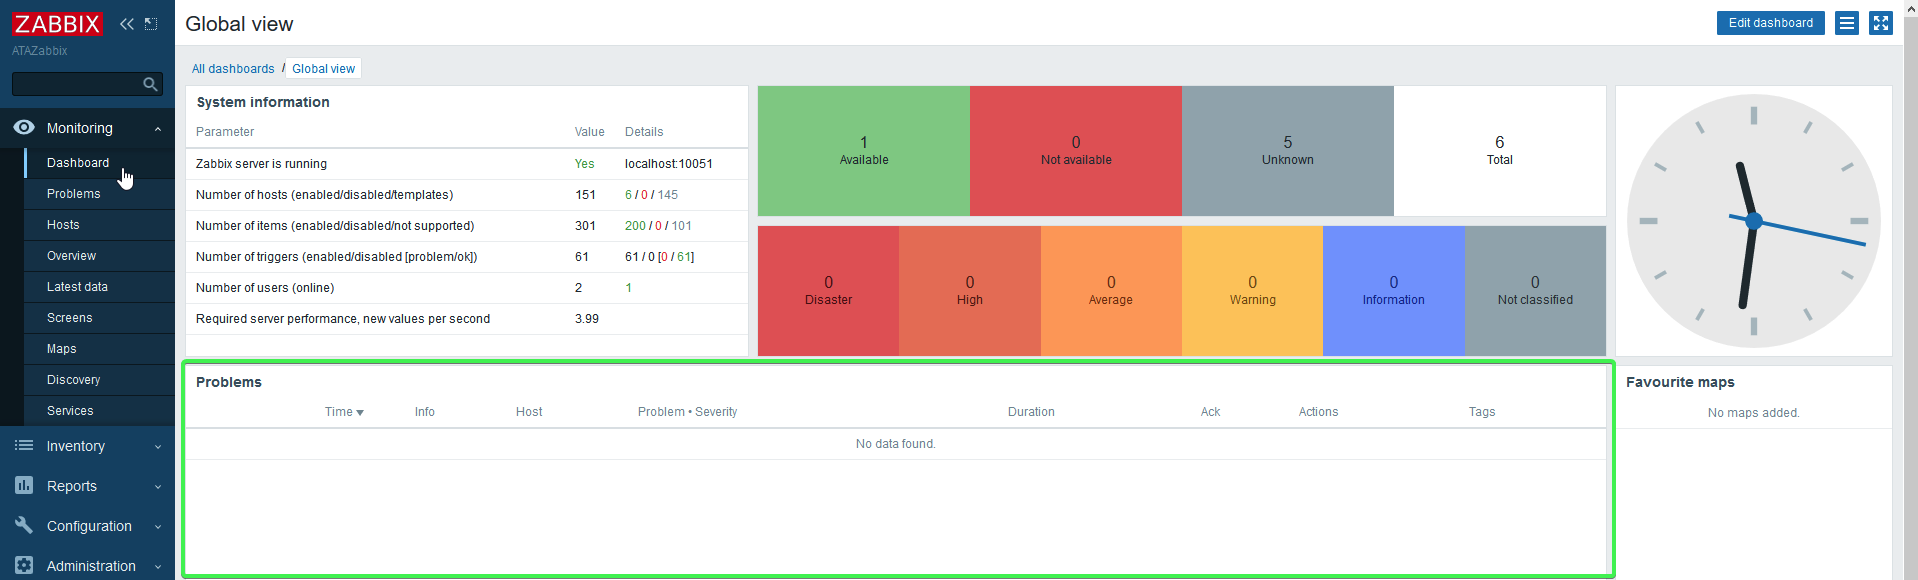
You pull up your Zabbix URL on your iPad or Surface book and sign in. By default, you are shown the Global view dashboard.
You can create your own custom dashboard views, but this is out of scope for this guide. You can learn more about creating custom dashboard views Global View Dashboard
There’s a timestamp of when the trigger condition was met, followed by a Host that the trigger is assigned to, along with the Problem Severity level you defined. Should have ordered that extra memory.
Looking at the details, you will see the Duration the trigger has met your condition and an Ack(nowledgement) which is used to trace corrective action if any is needed by you or your Junior Sysadmin. There is also a field for Actions and Tags.
After confirming you’ve used all that memory, you shutdown the two new VM’s for now until you order than additional memory. You call up your Junior Sysadmin and thank them for being on top of things, and promote them to Network Operations Center Manager!
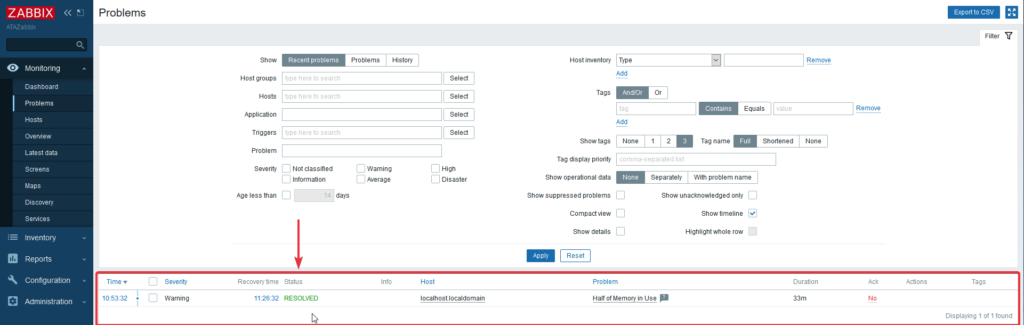
While Zabbix poller subprocesses continue to gather data, your Zabbix server updates the trigger status. When you click on Problems under the Monitoring menu, you now see a flashing RESOLVED message:
Resolved Message
Turned off memory hogging VM’s and automatically resolved trigger alert
You should also see back on the Dashboard view that there are no alerts:
Dashboard
And there you have it. That’s how to use Zabbix 5.0 to monitor your VMware ESXi hosts!
Conclusion
If you have made it to the end of this guide, I hope that you learned enough to make you feel more confident with Zabbix and monitoring VMware ESXi hosts. Zabbix has a lot of awesome functionality and capabilities that this guide barely scratched the surface of.
You’ve built a ground-up solution by installing Ubuntu Server, Zabbix 5.0, and adding a VMware ESXi host. You then configured an alert trigger to complete the monitoring project. You can not only monitor 1 or 100 VMware ESXi hosts for free but ANY device you can connect to!
That’s a lot to have accomplished, and the benefits of having a solid, proven monitoring system for your core virtualization infrastructure will pay off in the end.
Next Steps
Zabbix is a very powerful enterprise-grade monitoring solution. However, for the beginner, it can be a frustrating, oftentimes confusing experience. But do not get discouraged! Start small, keep it simple, and only monitor/alert on the things that are important.
So what’s next? Take a look at the additional learning resources below and begin experimenting on your own! Take a deeper look into what and how you monitor devices and services and what Zabbix can enable you to do.