

One way to optimize packet capture is to use a command-line interface tool, and out of all the tools you can find, TShark is one you must try. TShark is the equivalent of Wireshark GUI, which provides valuable information about traffic captured in your network.
One thing that makes this great is that instead of clicking multiple buttons and digging through various menus, you can type just one command to get the information you need.
Read on and never waste hours analyzing your packet captures again!
Prerequisites
This tutorial will be a hands-on demonstration. If you’d like to follow along, be sure you have the following.
- A Linux machine – This tutorial uses Ubuntu 20.04 LTS, but any Linux distributions will work.
- Wireshark installed on your machine.
Installing TShark on Ubuntu
TShark doesn’t come installed on your Linux distro by default, so before you can take advantage of this, kick off this tutorial by installing TShark on your machine.
Using your package manager, you can install on most Linux distributions and BSD operating systems. But for this demo, you’ll install using the APT package manager.
1. Run the apt update command below to ensure your package manager is up to date. This command updates your system’s list of packages and their current versions.
sudo apt update -y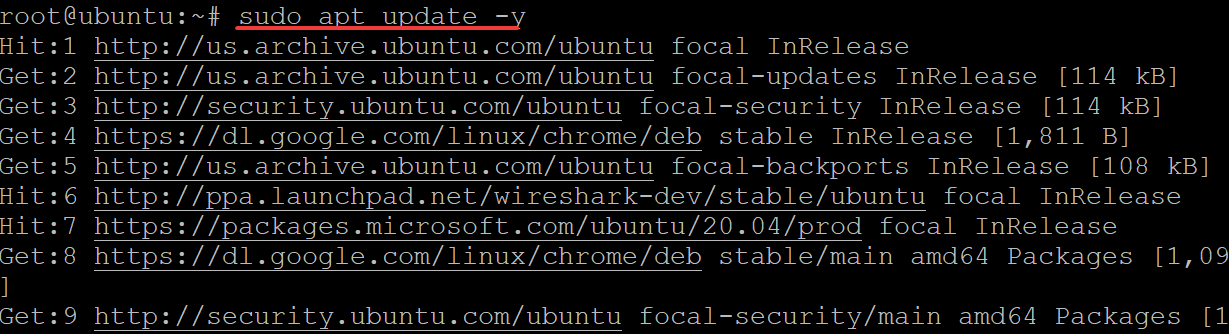
2. Next, run the apt install command below to install the TShark command-line tool on your machine.
sudo apt install tshark -y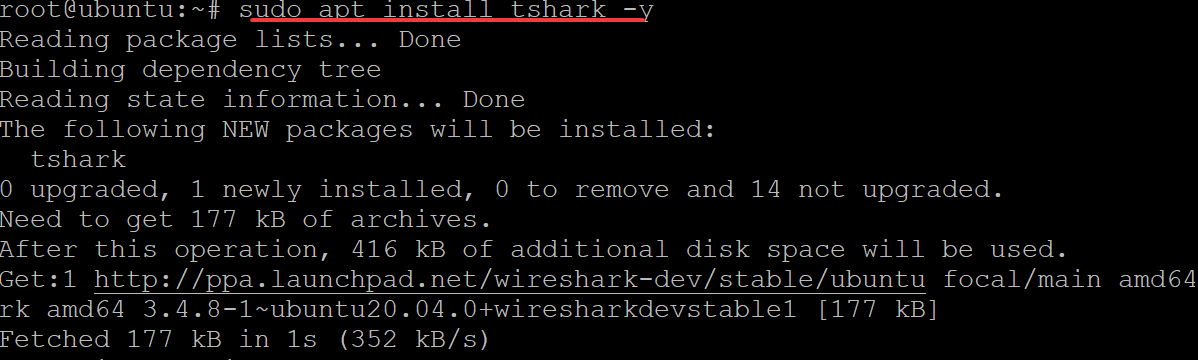
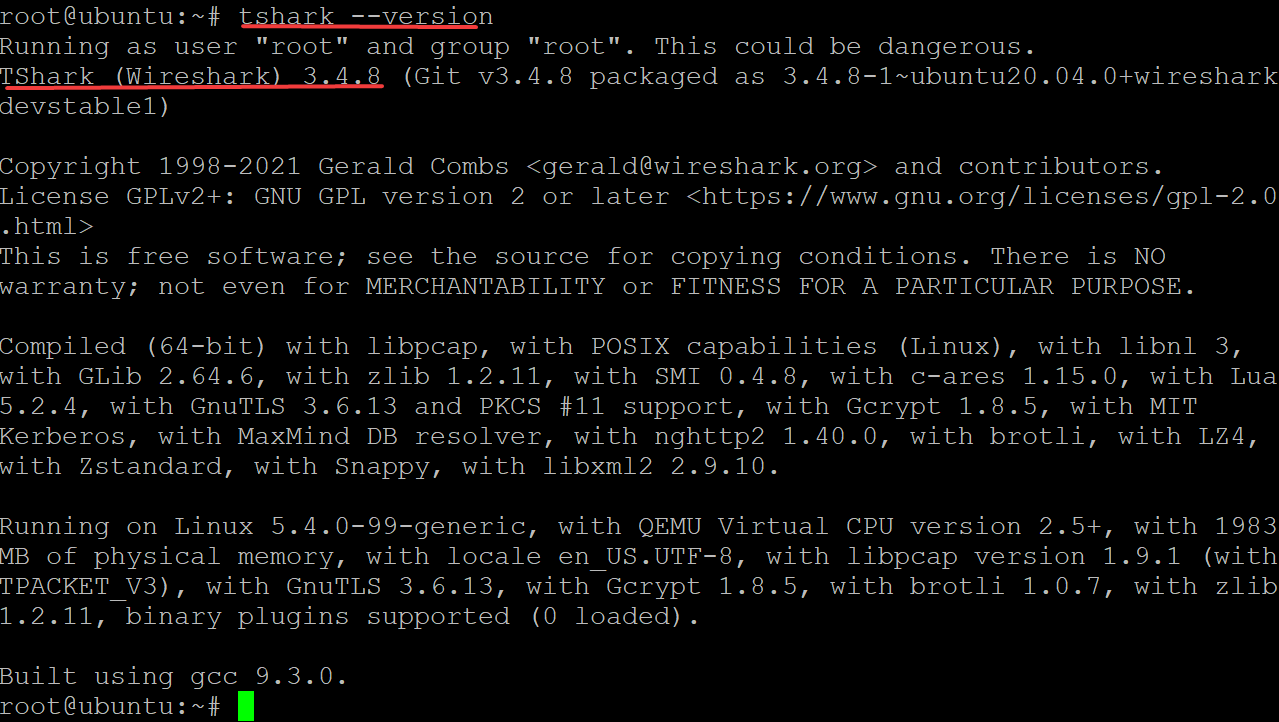
3. Run the below tshark --version command to ensure the tool is available on your system.
tshark --versionYou will get an output like the one below. As of this writing, the current version is 3.4.8, but your version might be different.
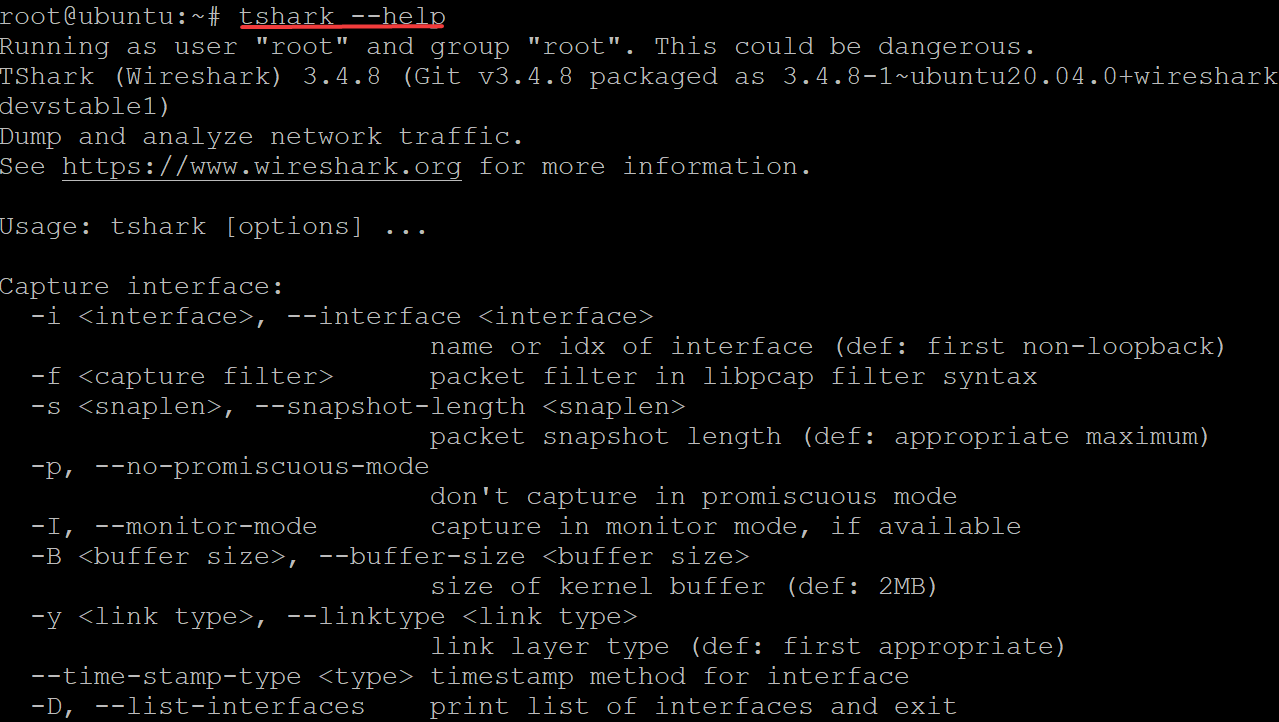
4. Finally, run the tshark --help command below to see all available commands. Commands
tshark --helpYou can use many of its commands, as shown below, to get information about data captured in your network. This output only shows a small number of the available commands. You will learn the basic use of some of these commands in the following sections.
Capturing All Packets from a Network Interface
Now that you have it installed, you can capture packets and analyze captured network data. You can capture network data using a specific interface, but before you capture data, you’ll need to start and specify the network interface where you’ll capture data.
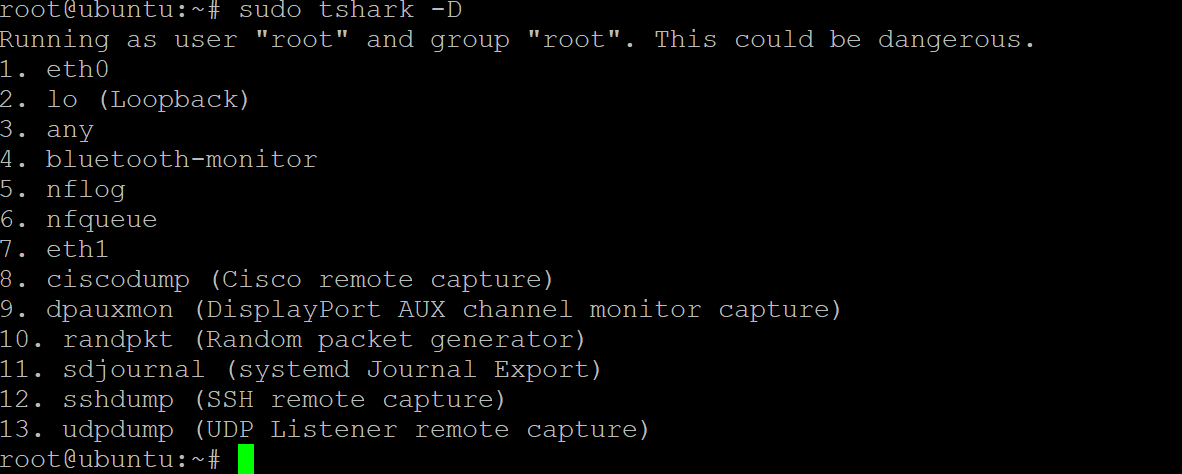
1. Run the tshark command to list all available network interfaces (-D) that T-shark can find, even the old and inactive ones.
sudo tshark -D You’ll see a list of the available interfaces on your system, as shown below. If you have multiple network cards installed in your system, always run the tshark -D command before starting and specifying an interface.
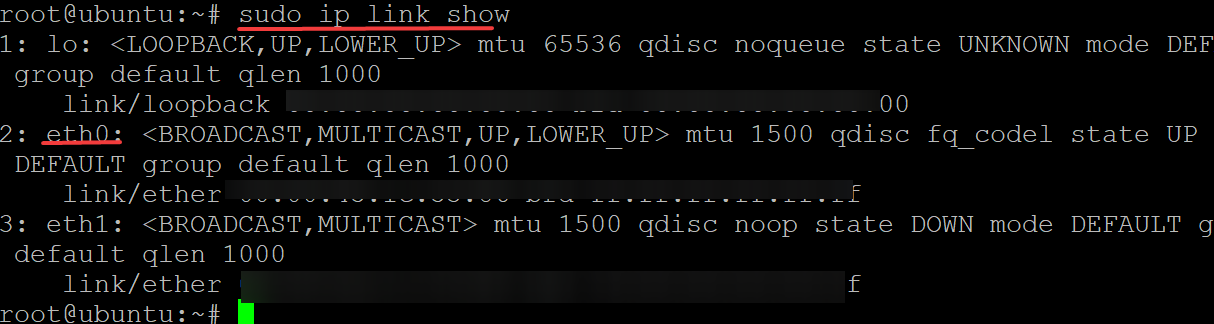
2. Next, run the ip link command below (on Linux and BSD systems) to list all active network interfaces. You must select an active network interface to use.
Although TShark lists all network interfaces on your system, not all of them might be active at the time.
sudo ip link show In most cases, you will use a network interface, such as an ethernet card. In this example, note down eth0, as shown below, to capture packets.
3. Lastly, run the following tshark command to select an interface (-i) and capture live packets. Replace interface with the interface you noted in step two.
sudo tshark -i interfaceOnce you start capturing data, you’ll see packets displayed in real-time, as shown below. And at any point, you can press Ctrl+C to stop from capturing packets.
Like other popular data-network packet analyzer tools, such as tcpdump and Wireshark, Tshark uses the pcap library (libpcap) to capture packets. In this case, the pcap library is used to capture packets from the eth0 interface.
As you see below, it prints out the decoded form of captured packets, each line in a human-readable format to standard output (stdout) on your terminal.

Capturing a Specific Number of Packets
Suppose you’re interested in analyzing a specific number of packets. If so, instead of capturing all the packets, specify the number of packets to capture and directly analyze them.
To capture a specific number of packets, you’ll append the -c option (capture packet count) in the tshark command.
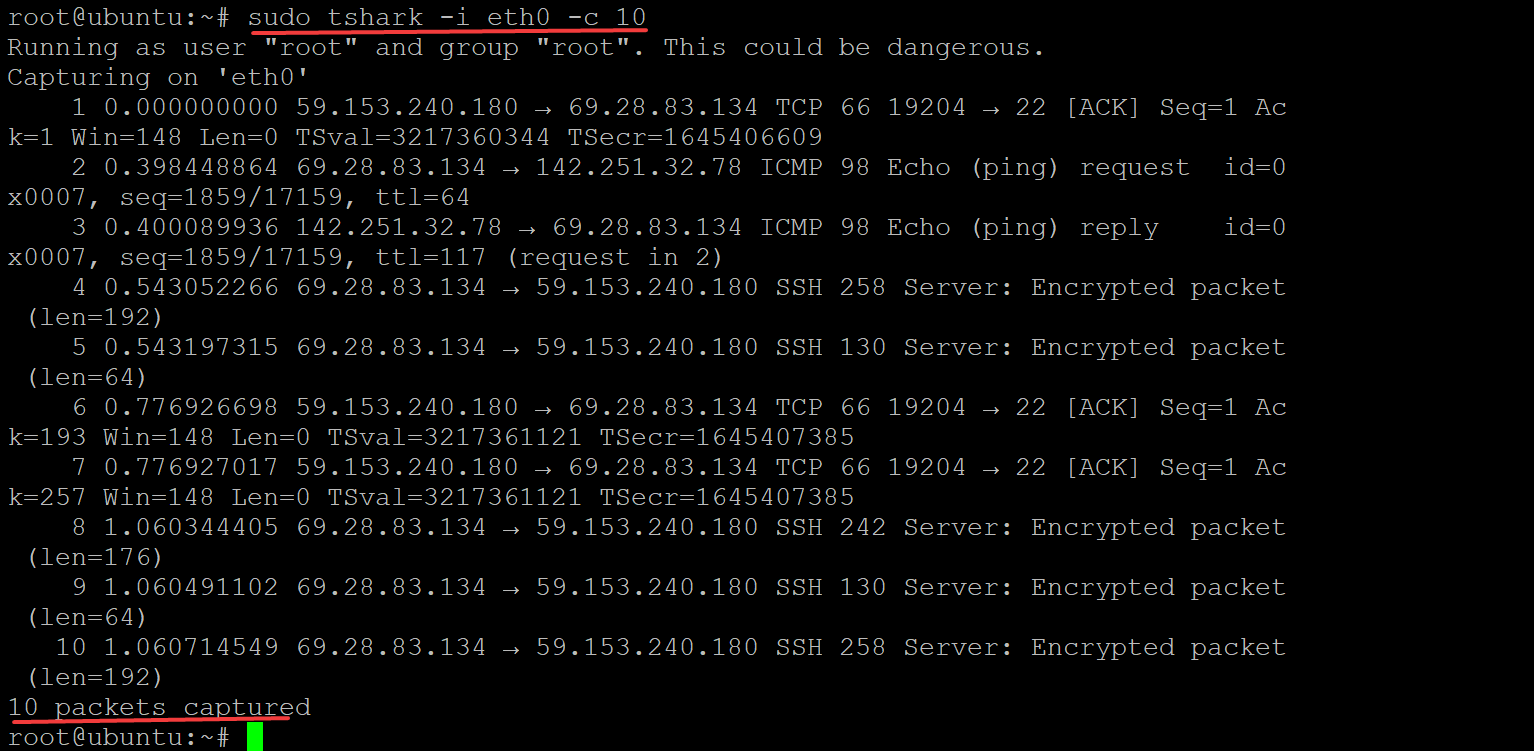
Run the following command to capture the first 10 packets (-c 10) to check if the packets are routed to tshark correctly. Replace 10 with your preferred number of packets to capture.
sudo tshark -i eth0 -c 10
If you prefer to capture packets and suppress displaying the packets, append the -q option instead. The -q option is handy if you only want to see the total number of captured packets and don’t want to scroll through outputs on your terminal continuously.
Run the below command to capture packets while suppressing (-q) the outputs.
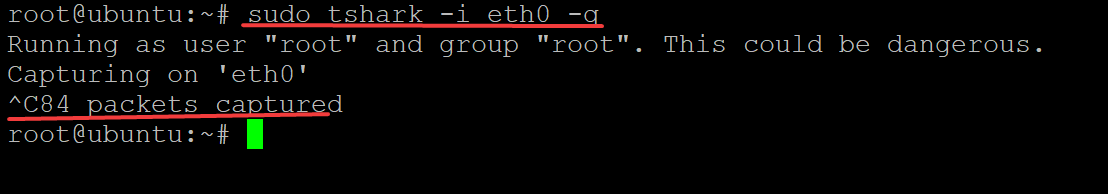
sudo tshark -i eth0 -q
As soon as you press Ctrl+C, TShark prints the total number of captured packets in the terminal. Below, you can see a total of 84 packets captured.
Capturing Specific Packets by Filter String
Perhaps the number of packets captured is too large, and it’s almost impossible to look for any specific string using only your eyes. In this case, you will have to use a filter to capture packets by the string of your choice.
You’ll use TShark’s capture filter expressions to select packets based on protocols, source/destination host/port pairs, and so on. For example, your SSH connection is not working, and you want to capture packets related to the SSH connection only.
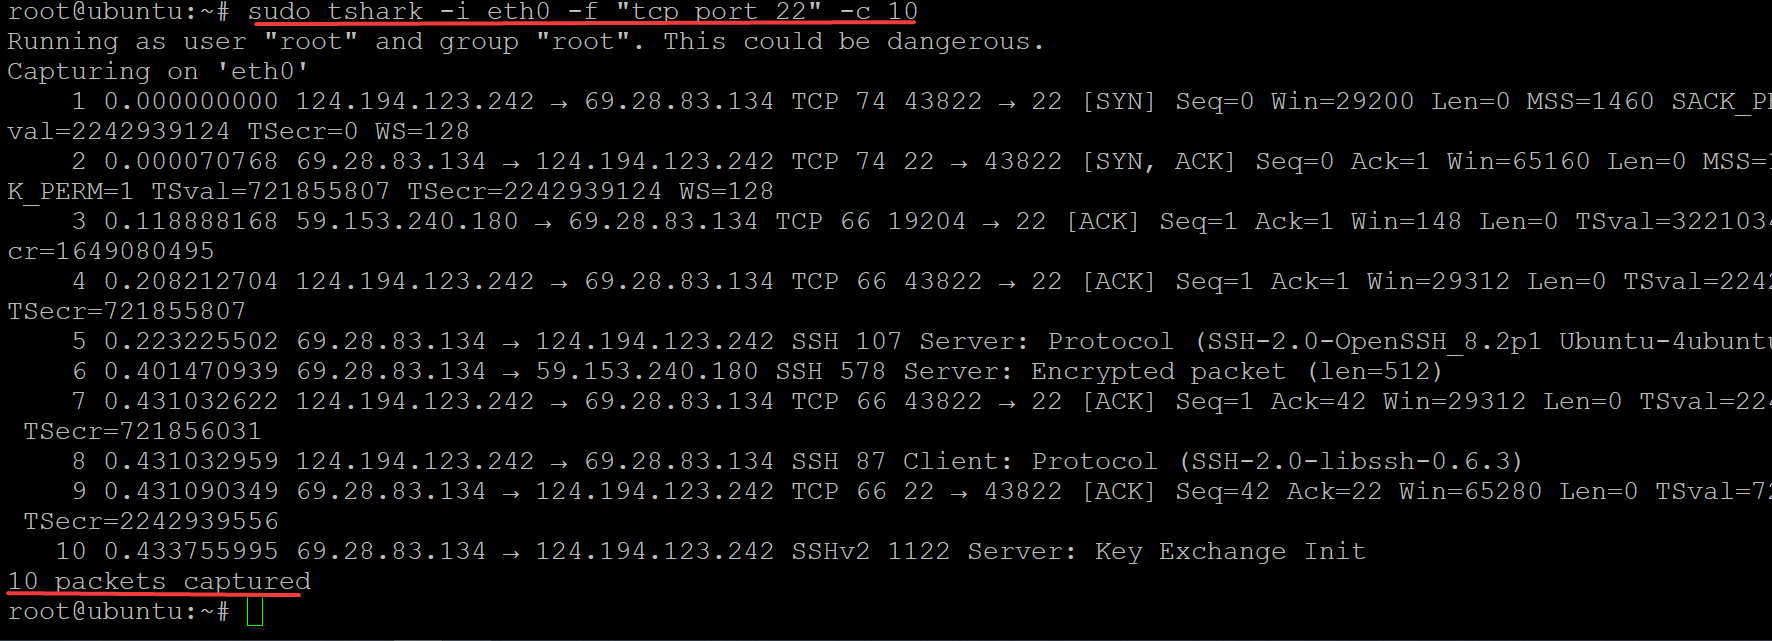
Run the below command to capture and filter packets (-f) with the tcp port 22 string.
sudo tshark -i eth0 -f "tcp port 22" -c 10
If the string filter is not enough, you can also use the display filter after running a capture filter to narrow down your search and analyze specific packets. The display filter takes advantage of comparison operators (!==,===,==, and so on.) to test strings, patterns, or byte sequences.
You can also use Boolean operators (and, or, not) and grouping with parentheses to specify more complex expressions.
For example, after you found the IP addresses you use to connect to SSH, now you want to further dig into the packets. In this case, you’ll use the == (Equal (any if more than one)) operator, as shown below.
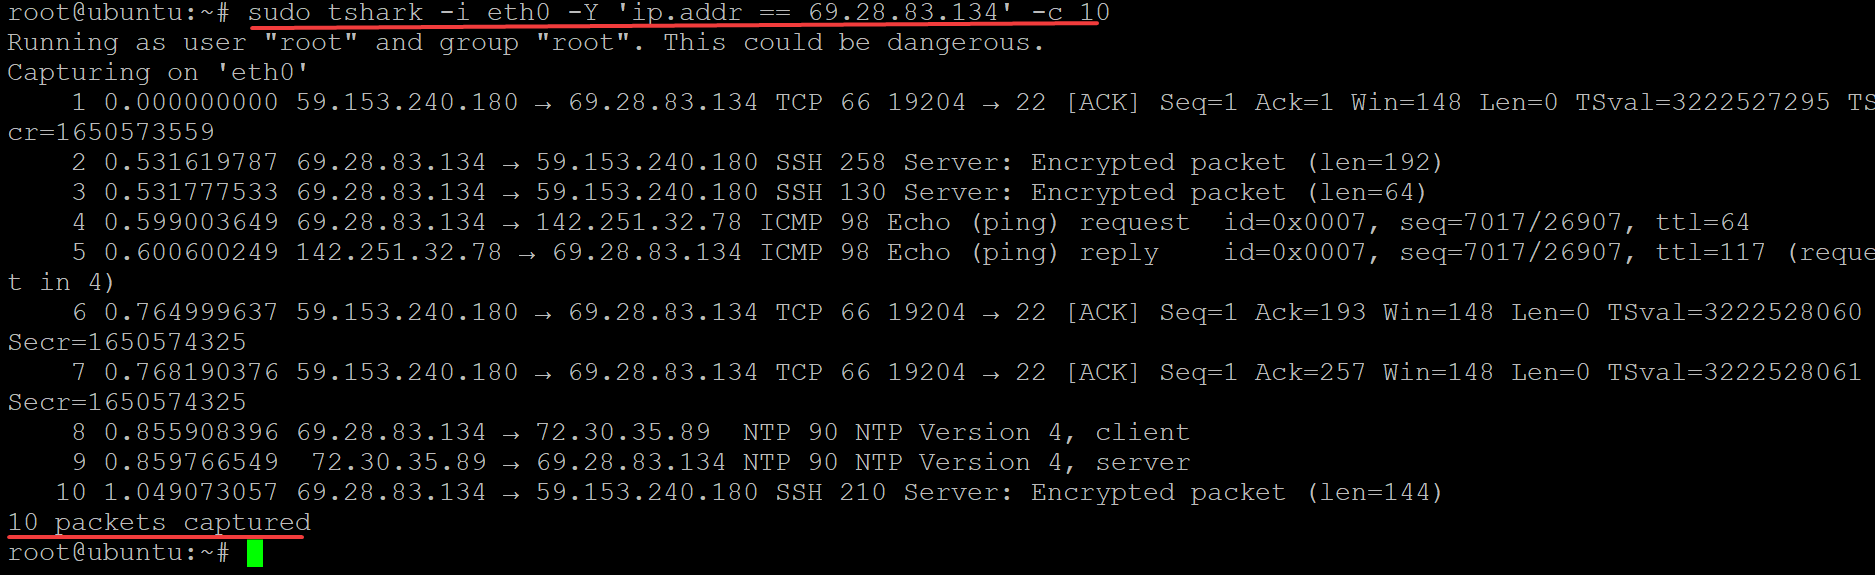
Run the tshark command below to capture and display the first 10 filtered packets (-Y) related to the 69.28.83.134 IP address.
sudo tshark -i eth0 -Y 'ip.addr == 69.28.83.134' -c 10
You can see that the output below only displays the packets related to the 69.28.83.134 IP address.
Saving Captured Packets to a File
Viewing captured packets in real-time lets you immediately act for troubleshooting. But perhaps you don’t have time to troubleshoot at the moment. So why not save the captured packets to a file? For example, your SSH connection has been working fine, and suddenly the connection is not available.
Scrolling through the packets in the terminal won’t always give out information to understand what’s causing the issue. In this case, you can use TShark to save the captured packets and share them with your friends or colleague who you think can help.
Run the below command to store packets captured to a file .pcap file. The command performs the following:
- Sets the capture ring buffer option (
-b), which brings up the multiple files mode. In this mode, TShark writes captured packets to numbered files. Once the first file size is full, TShark moves on to the next file, and so on.
- Instructs TShark to create 10 files (
-a files:10) containing the packets captured in the ring buffer mode of operation, each file containing1024KB (1MB). If you don’t add thefilesoption, the ring buffer mode of operation will run forever until your disk space is full or a stop condition occurs.
There is no limit on how many files you can use with this option. But note that the total size of all files in the ring buffer mode of operation can not exceed 2GB. Once this limit is reached, TShark pauses and waits until you free up some disk space by deleting some files before continuing.
- Writes the packets to a file (
-w), in this case,ata.pcap, while you’re running your capture on a specific interface (eth0).
sudo tshark -i eth0 -f "tcp port 22" -b filesize:1024 -a files:10 -w ata.pcap
TShark does not show you the writing progress and the continuous count of packets captured when writing to a file. You’ll only see the number of packets captured, as shown below.
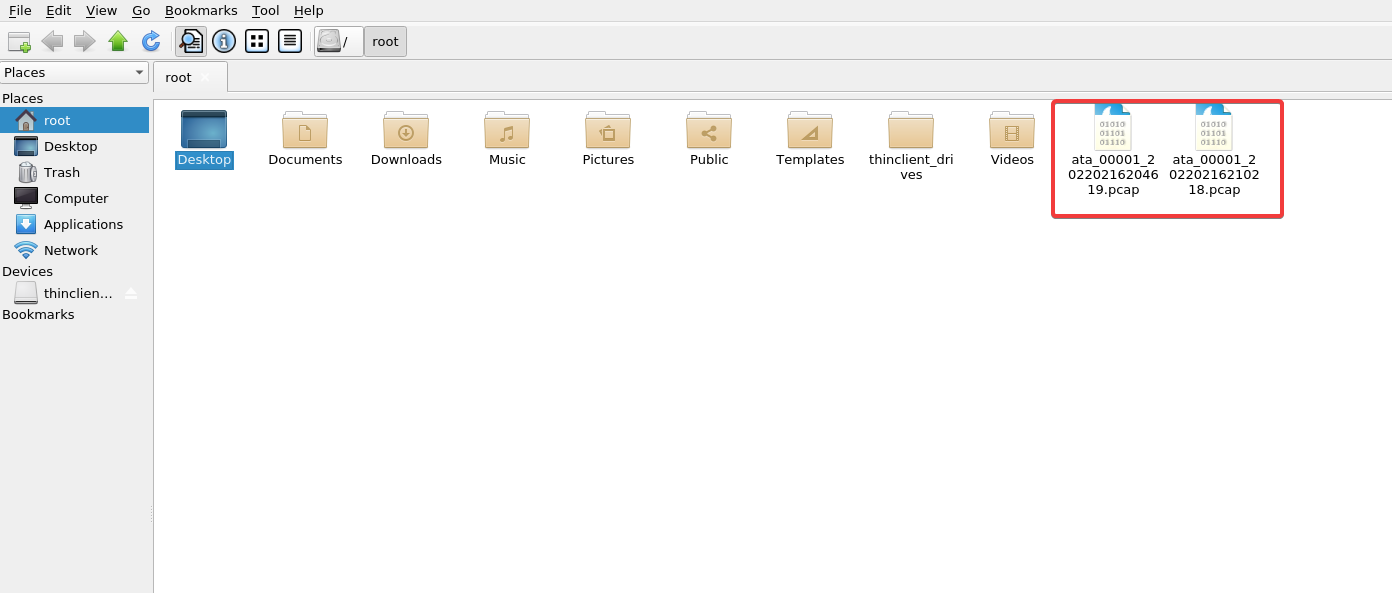
Now, press CTRL+C to stop the writing process at some point. You’ll have a new file, as shown below, containing packets captured during the session.
You can now share this file with your friend and continue debugging the issue together!
Conclusion
In this tutorial, you learned to install TShark on an Ubuntu machine. You also learned to add filters to look for specific captured packets and write captured packets to a file.
At this point, you already understand TShark and its basic command-line options to manage packets. You can now start troubleshooting network issues by yourself or make it a reason to bond with some friends!
With this newfound knowledge, why not install Tshark along with Wireshark for Monitoring Packets in AWS EC2? Or perhaps Measure the Bitrate of a Video Stream?


