
Welcome back to ATA’s Learn with Me series on the 1E Tachyon Platform for Unified Experience Management! If you missed the previous posts, be sure to catch up here. Today, we’re going to cover Tachyon’s Inventory application.
One of the most common features of any endpoint management product is software and hardware inventory. Tracking assets such as devices, software, and user activity and displaying that data in a set of graphical dashboards is a requirement for any product claiming to control your endpoints. Tachyon’s Inventory is no different.
Tachyon Inventory: Using Data for Good
Through the 1E Client, Tachyon reads information like software installed, logged-in users, CPU and memory stats including licensing information, and sends it back to the Tachyon server(s). So what’s so different about this product? I noticed two major things.
- Data aggregation Along with its own hardware and software inventory, instead of recreating the wheel, it also allows you to leverage all of that existing data by providing connectors. Through its connectors, Tachyon natively supports inventory data integration with products like Microsoft Endpoint Manager Configuration Manager (MEMCM), BigFix, or even uploading your own data in CSV format.
- Data consolidation One of the biggest annoyances I had with being an SCCM admin years ago was how different software and hardware information was stored in Windows. A user could install a piece of software with InstallShield, a Windows Installer (MSI) and the software would look completely different in Windows. Even across the same software line, versions would even have slight variations which would make inventorying software a major headache. I hated it so much that I even gave a talk at TechMentor 2015 on the topic. Tachyon Inventory tackles that challenge head-on by normalizing all of that disparate data together into an understandable format using their 1E Catalog and even using artificial intelligence through their AI-powered auto-curation feature.
Enough with the overview. Let’s now jump into how Tachyon handles inventory across all of its managed endpoints.
How Tachyon Manages Inventory Data
Before we jump into the Tachyon portal and start clicking around, I want to first explain, from what I’ve seen, how 1E handles inventory data. Why am I taking a section specifically for this? Because pretty dashboards and charts are great but if you don’t understand how it’s generated, you’re not a true geek!
Inventory Repositories
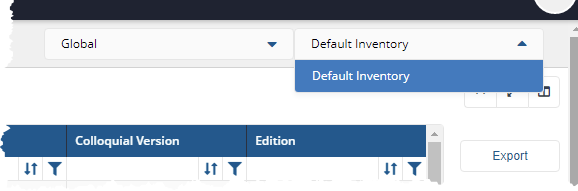
As I was clicking through the various screens, one feature stood out to me and I had to investigate further; the inventory repository. You’ll see below that Tachyon stores data in what they call inventory repositories. In my lab, I only had the Default Inventory repository, as shown below.
It turns out that Tachyon allows you to segment data in these partitions. These inventory repositories are used across various applications like Patch Success, Application Migration and more.
You’ll see that Tachyon uses inventory data across a wide range of applications. The Inventory application seems to just be a way of presenting that data for asset tracking and licensing purposes.
These inventory repositories are created via connectors that ingest data. According to the documentation, you can partition up data by source and time periods which would be handy if you have hundreds of thousands of endpoints with millions of database records!
The 1E Catalog
Recall in the first section how I mentioned one of the two differentiating features of Tachyon was its data consolidation efforts? The 1E Catalog is how it’s done. Using its catalog as a single source of truth, Tachyon ingests data from all of its endpoints. It then normalizes all of the data using good ol’ fashioned logic and even artificial intelligence.
According to 1E and from my experience, you probably don’t need to access the catalog directly too much but it’s still possible by navigating to https://<tachyon DNS Name FQDN>/CatalogWeb.
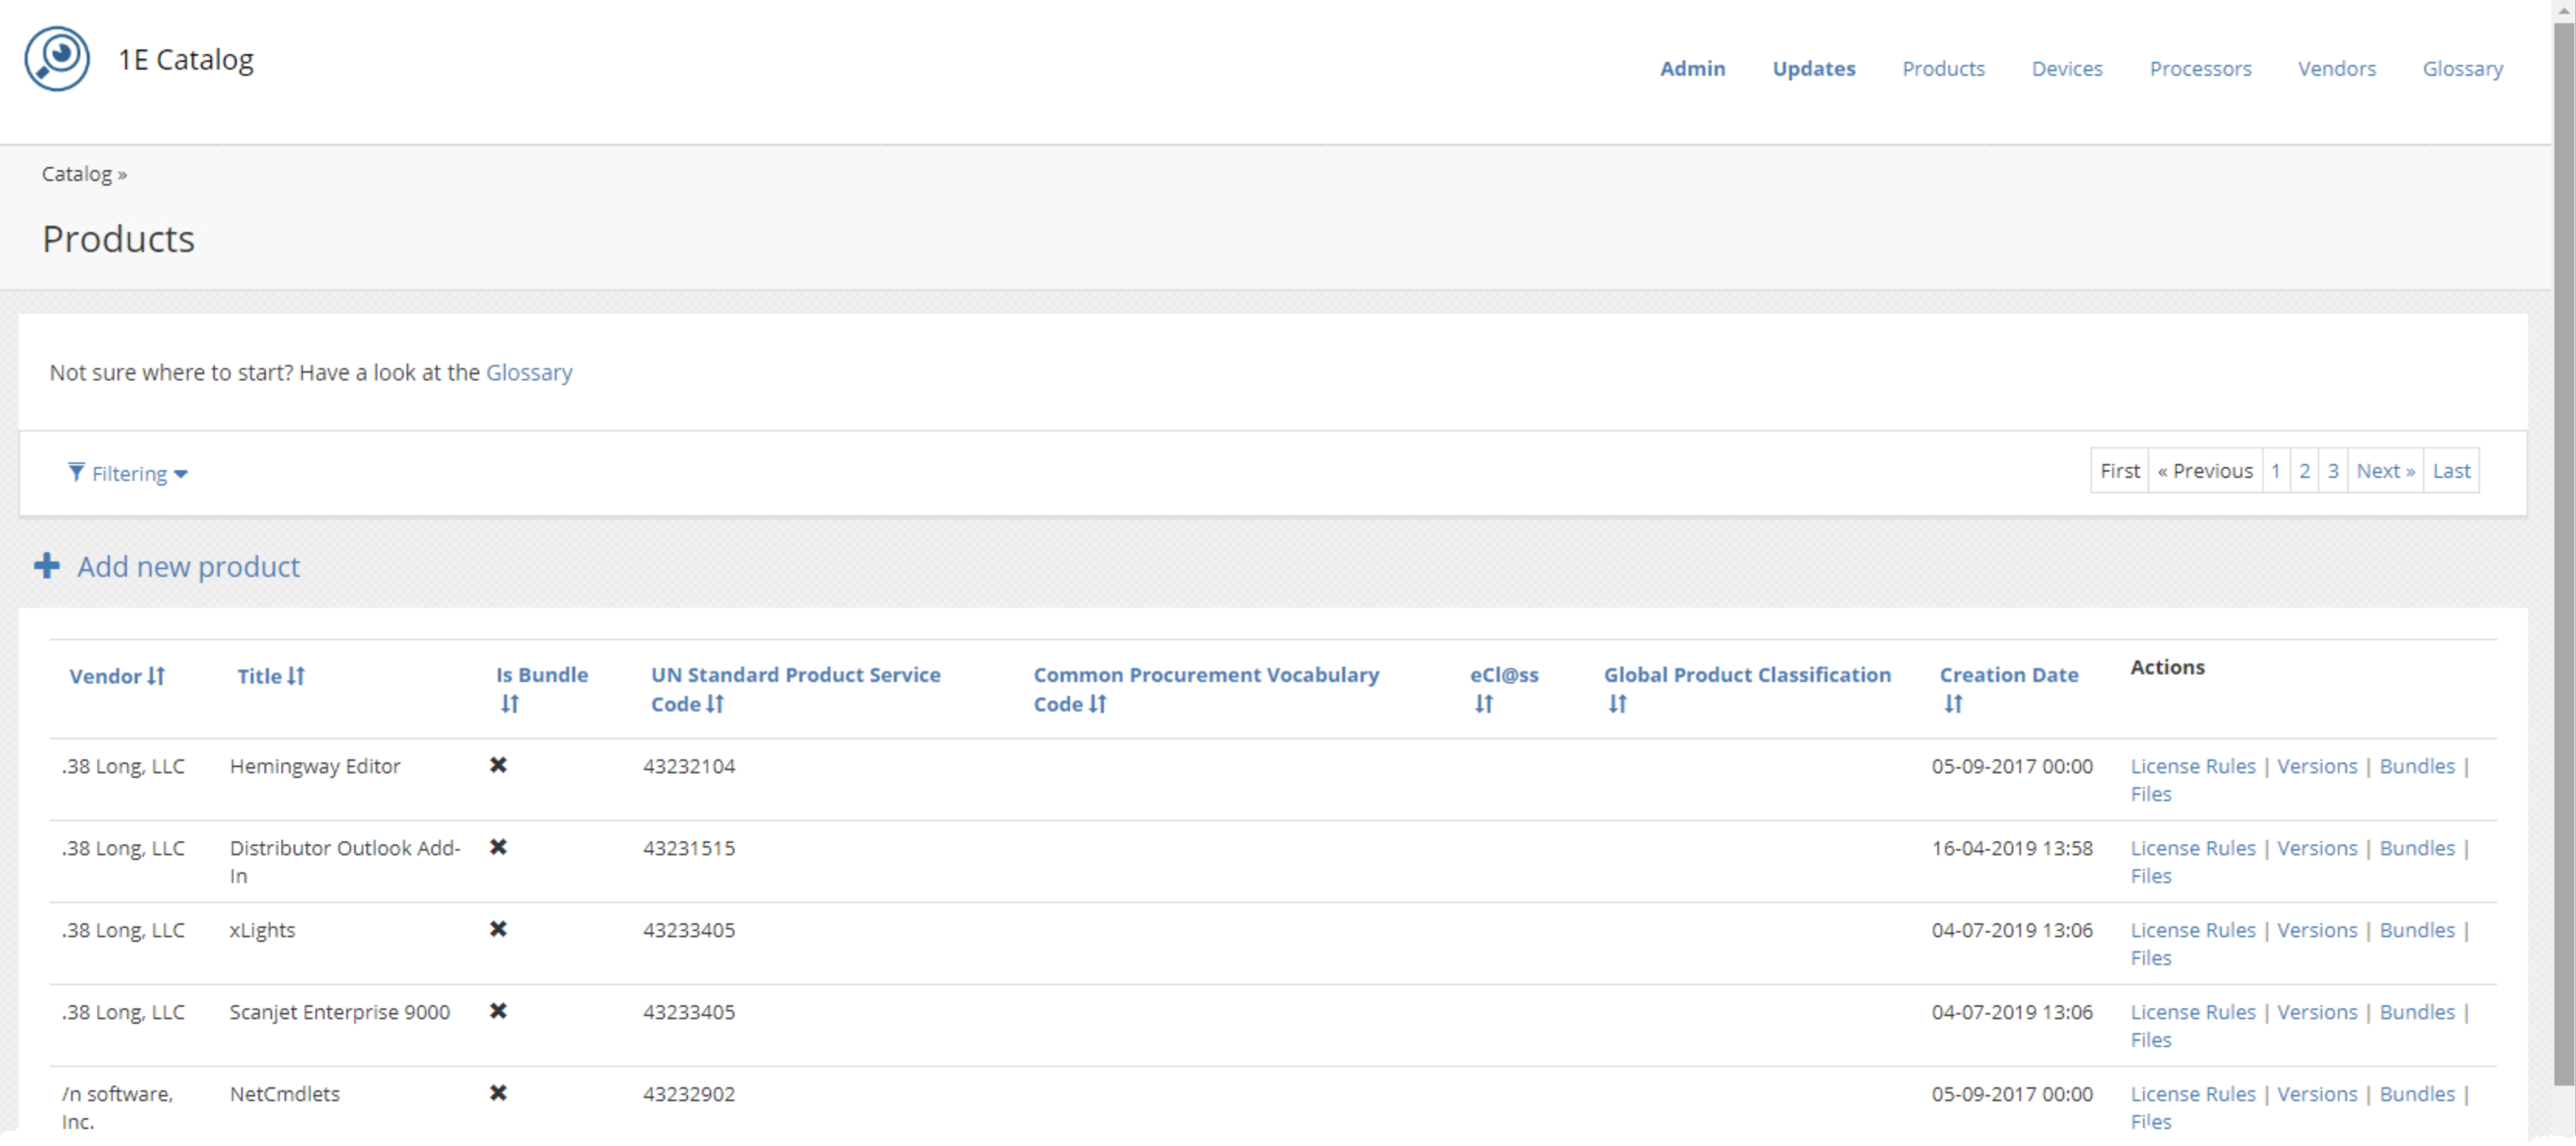
The 1E catalog is a critical component of Tachyon’s inventory data strategy. It:
- Uniquely identifies deployed software.
- Identifies device types like laptops, desktops, virtual machines, operating systems, and more.
- Normalizes hardware and software inventory across all endpoints.
- Applies bundling rules to identify software suites like Office.
- Tracks software entitlement rights like when you can upgrade/downgrade licenses, change software editions, and is even aware of Microsoft’s software assurance.
If Tachyon inventory had a single source of power, I’d say it’d be the 1E Catalog.
Navigating the Dashboards
Now that you’ve gotten some background on Tachyon Inventory and how the data is handled in the background, let’s now get into the fun stuff that’ll be sure to impress your boss, dashboards!
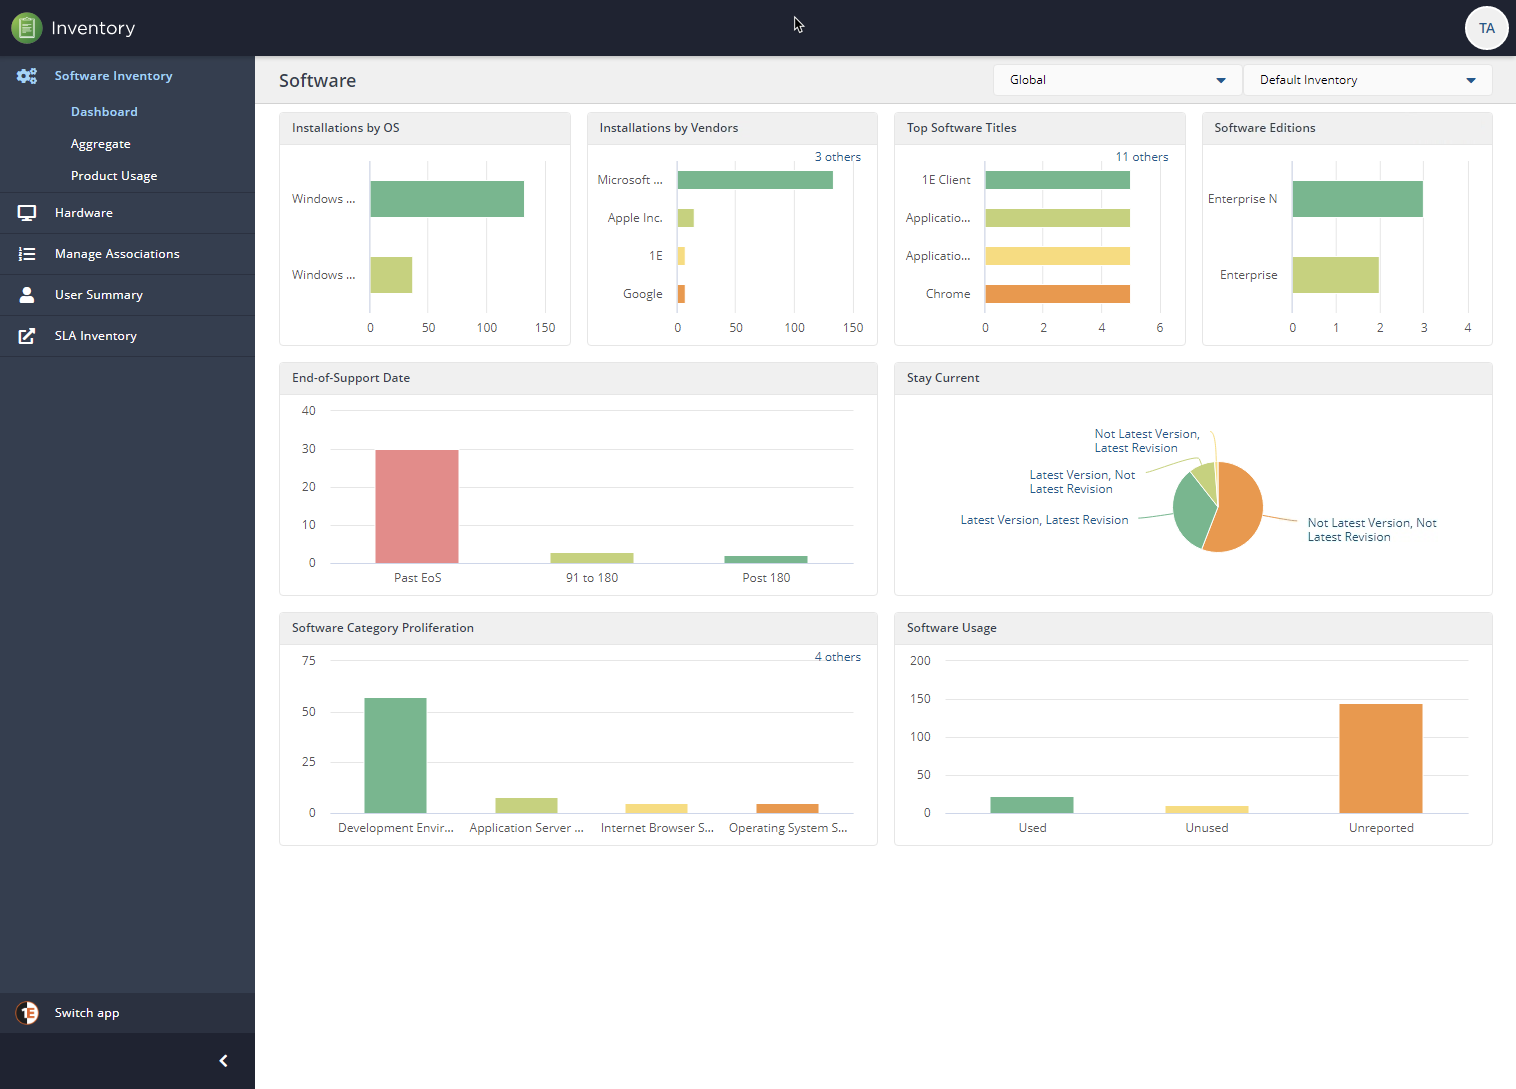
When you first open the Inventory application, you’ll be at the Software Inventory dashboard. Like other applications such as Experience, Inventory provides you with various dashboards. These dashboards allow you to, at a glance, track all of your assets.
You can see below by clicking on various elements in the various charts, you can drill down on specific information. This feature is common across Tachyon and is one I really like.
Imagine if the boss comes in one day and asks, “Hey, can you tell me how many devices we have that are ending support? We need to replace those.”. When that happens, you’d bring up the Software Inventory dashboard and wow him with all of your mesmerizing charts!
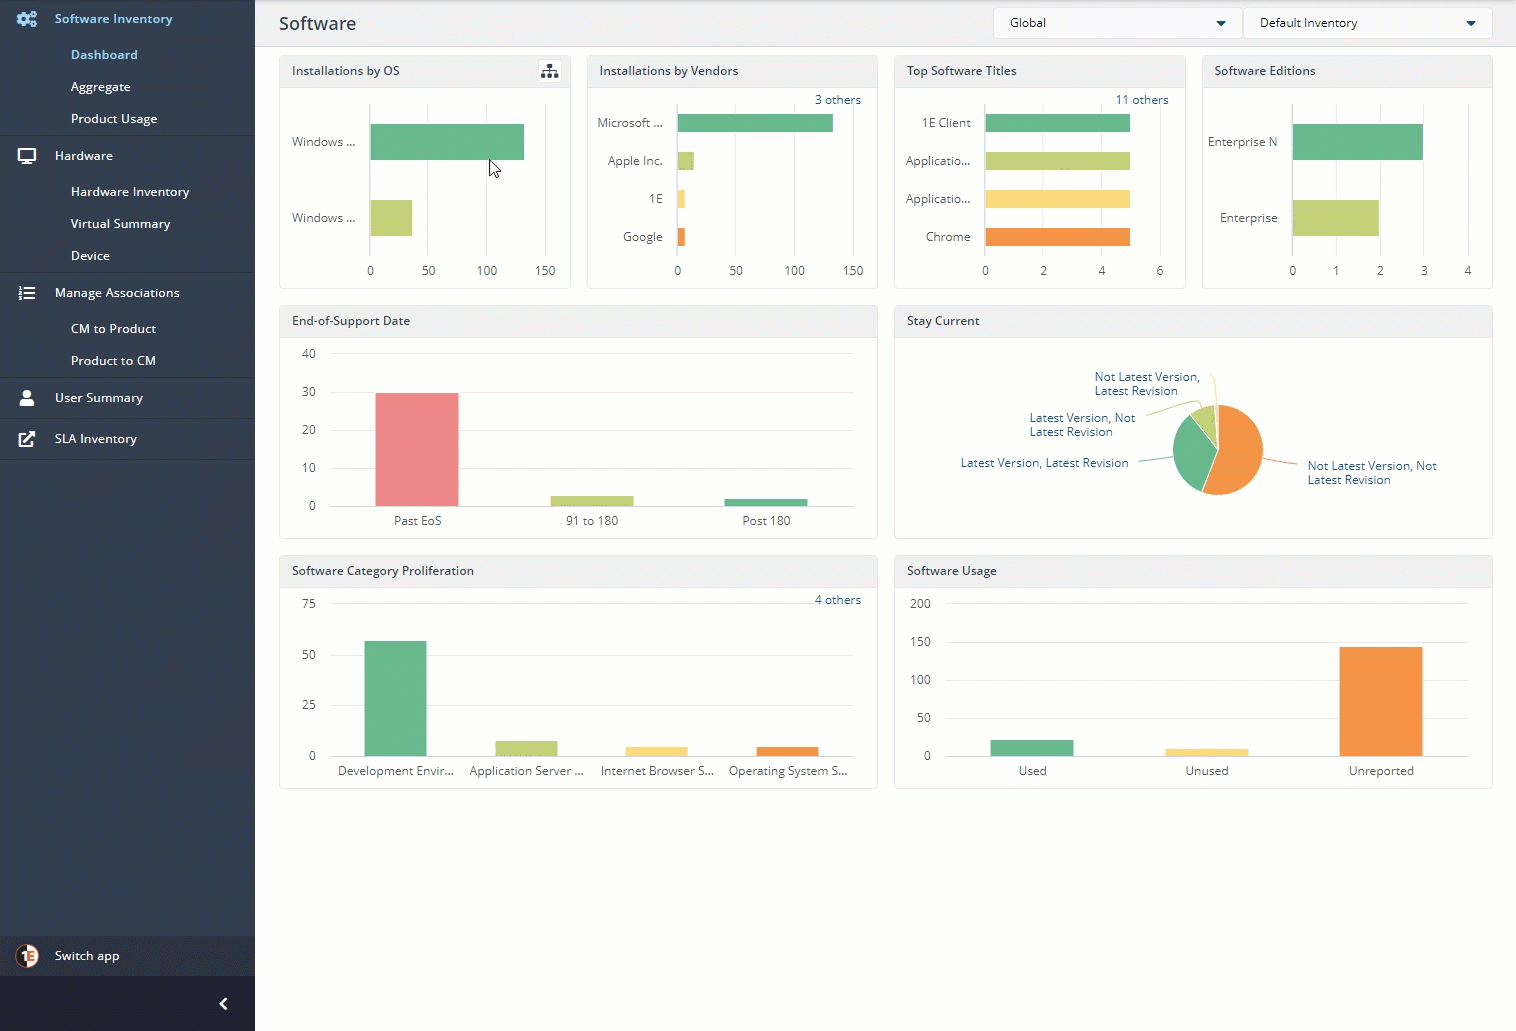
Software Inventory
One of the first components of Inventory you’ll come across is Software Inventory. Software inventory is the place where you can get a bird’s eye view of not only what software is installed across your environment but how much that software is being used.
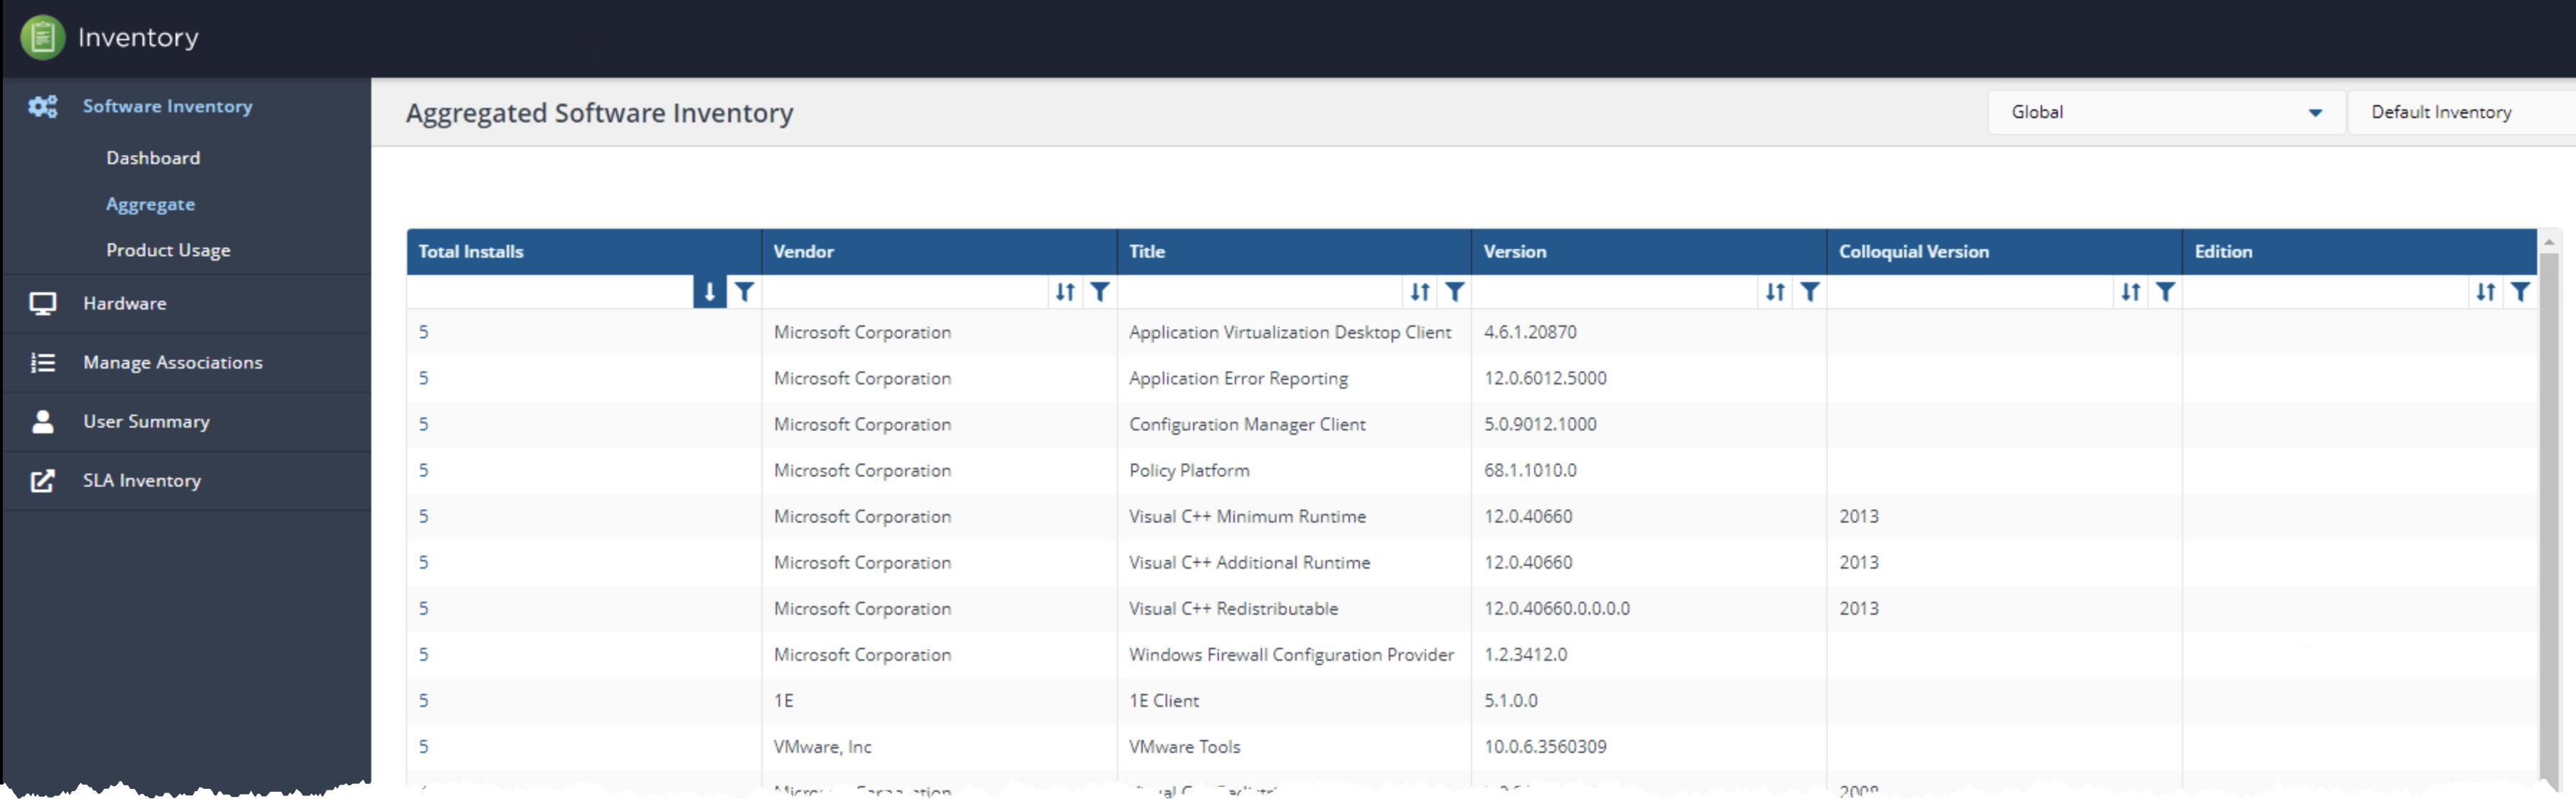
Through the 1E Client and by optionally setting up various connectors to bring other data in, Software Inventory provides an Aggregate view that shows all software installed across the environment. Although useful, I didn’t see anything particularly amazing in here.
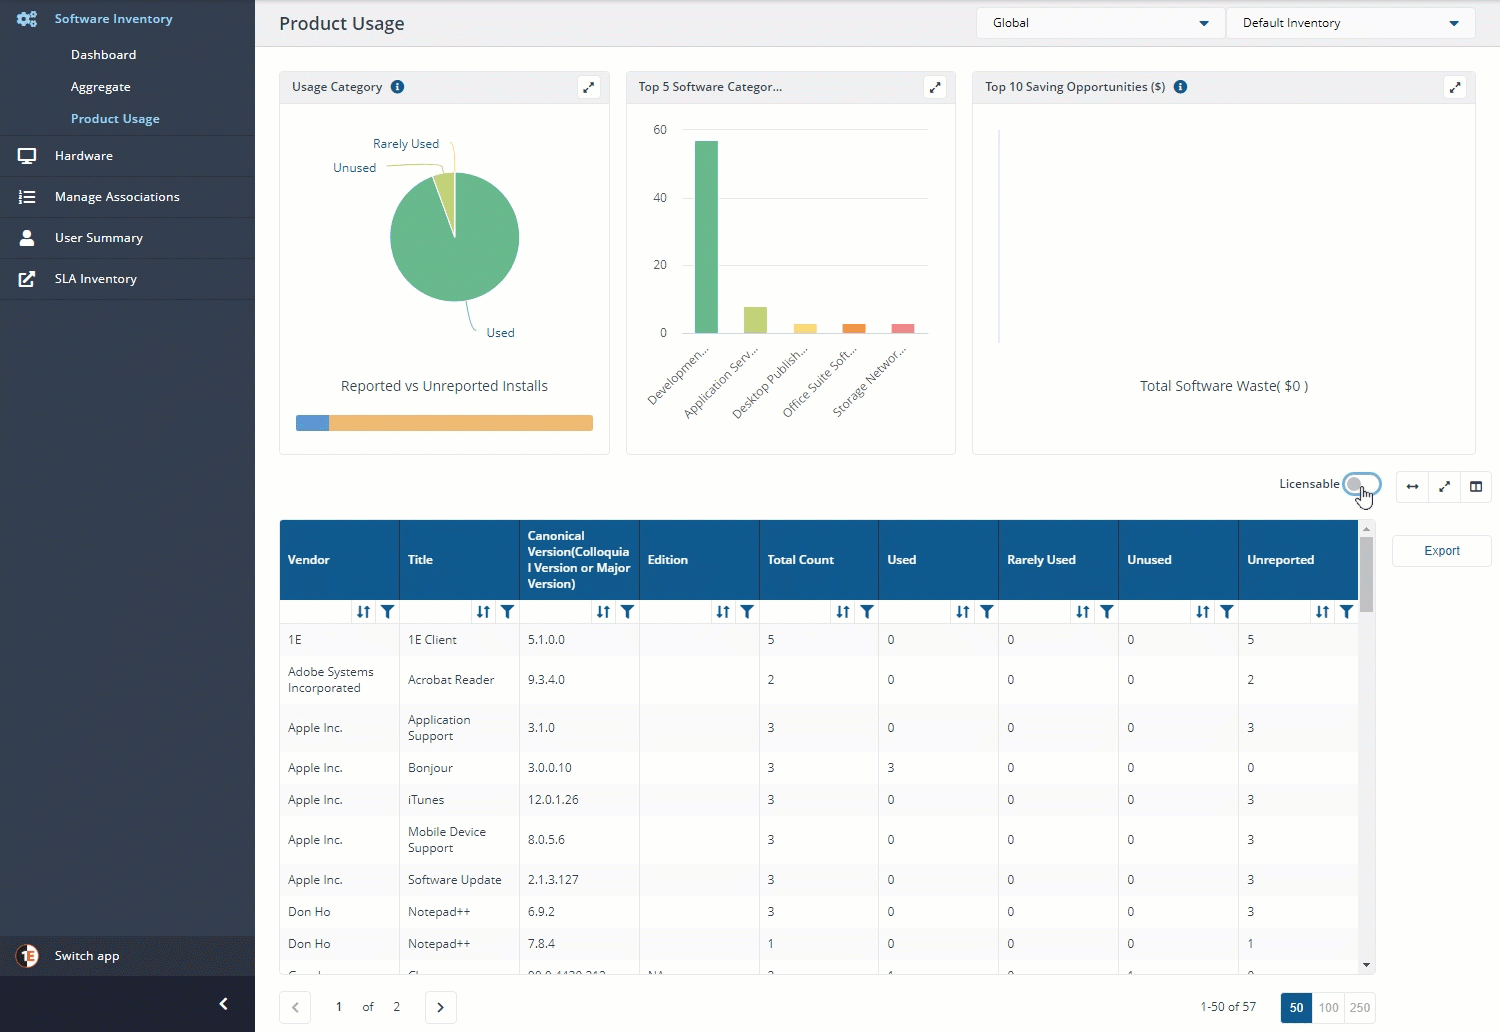
Product Usage Statistics
Now, I did like the Product Usage screen. Here is where Tachyon summarizes inventory data by usage statistics. The Product Usage screen would be great for those times when you need to save money on licensing by discovering what’s actually being used in your environment.
Have you ever spent hours on a script just to figure out what “used” and “unused” means when it comes to installed software? I have and it’s not pretty. The Product Usage screen could have saved me from a headache.
By tracking every process that starts and stops on an endpoint, Tachyon is able to map those processes to software and provide usage data like you see below.
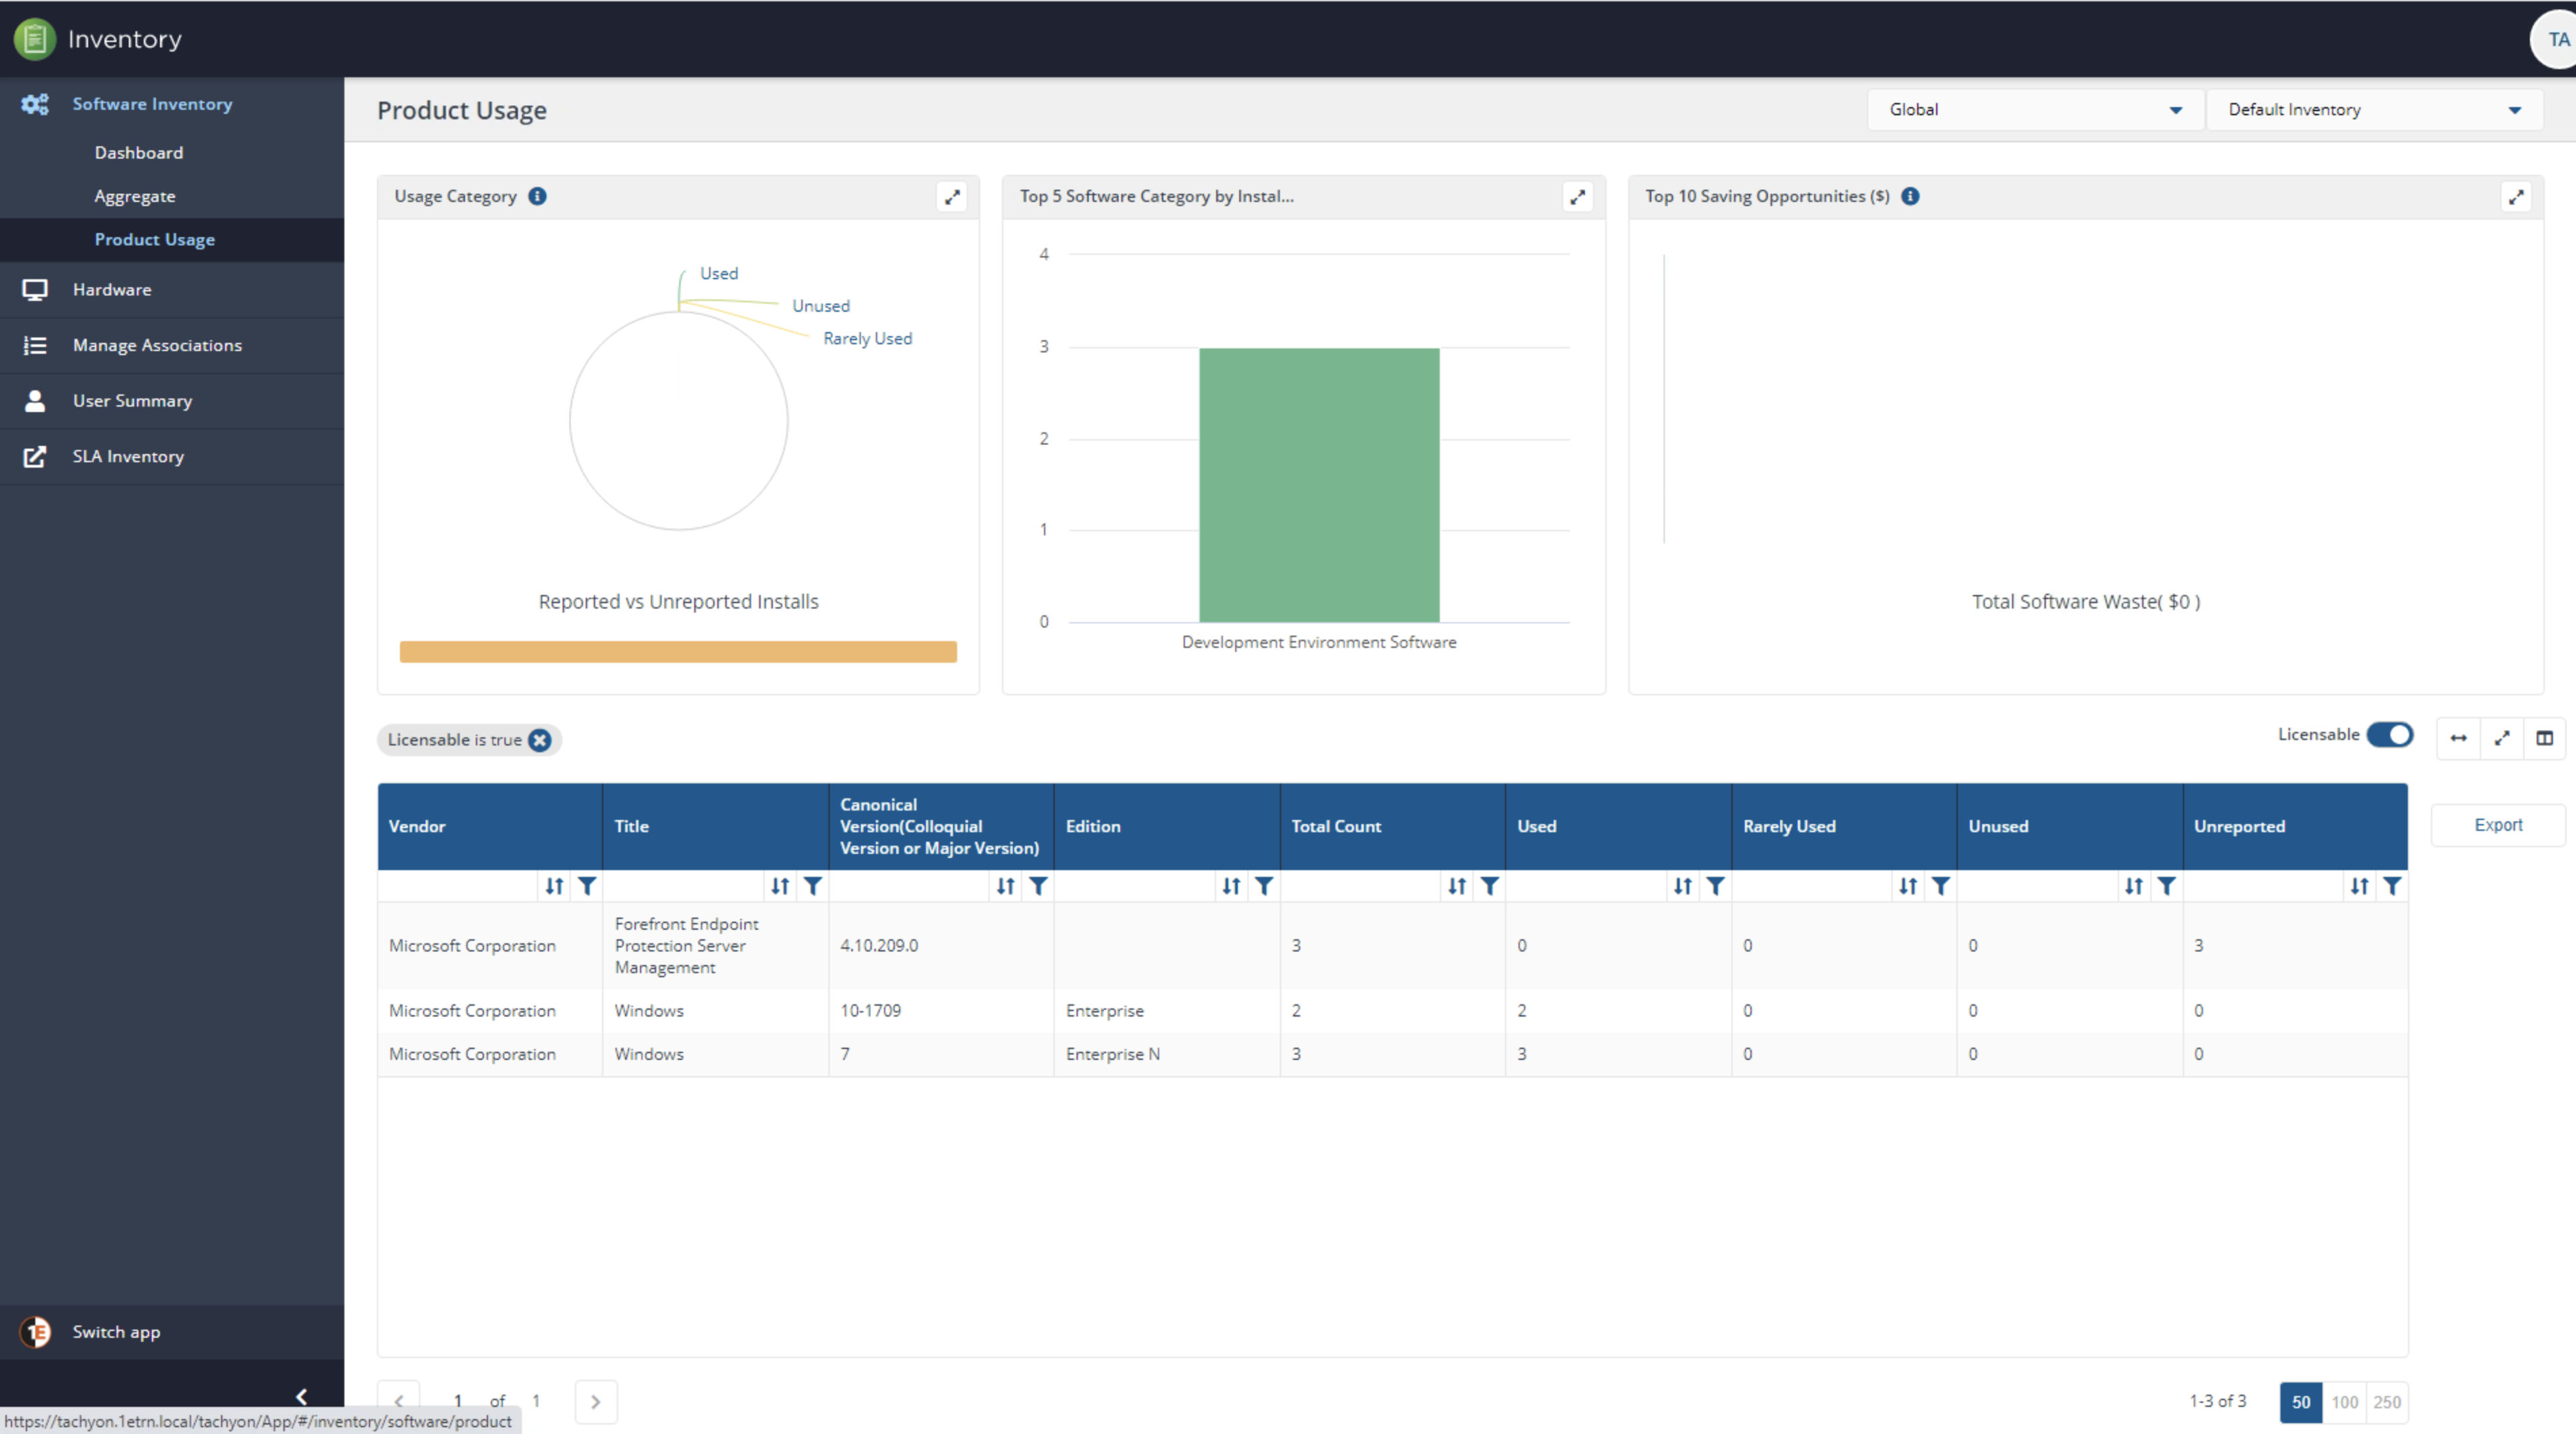
Licensing
The Product Usage screen has many different uses all packaged up into one. Licensing is another useful feature I found. In particular two elements stood out to me; helping me track licenses in use and helping me save money on licenses
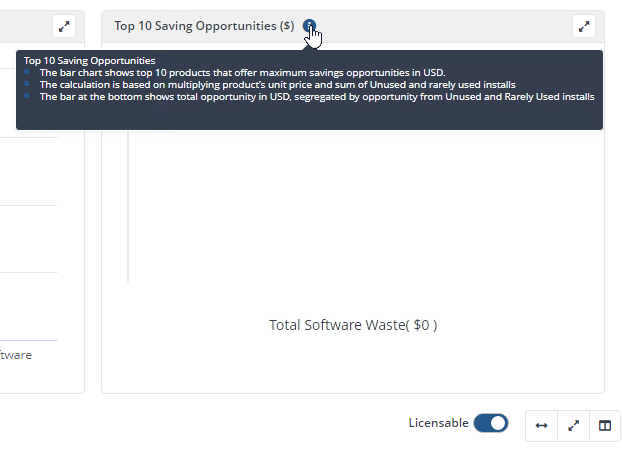
One part of the Product Usage screen that stood out to me which was the Top 10 Savings Opportunities ($) chart. Recall the first section where I mentioned the Inventory application was all about data? The below screenshot is a great example.
Although I didn’t have any data to populate this bar chart in my lab, just having this chart available provides a peek into 1E’s design decisions. They seem to be looking for every way possible to make intelligent sense out of boring old software and hardware inventory data.
You’ll also notice on the Product Usage screen a handy Licensable button. By toggling this button as shown in the following GIF, the Tachyon Portal will immediately filter out all of the software that you’re probably paying a license for.
By having this quick toggle, you can easily narrow down to only those products that might be costing your organization way too much money.
Hardware Inventory
Like any good endpoint management product, Tachyon has hardware inventory. Using the 1E Client and any optionally created connectors, Tachyon reads hardware data and sends it back to the Tachyon server(s). Although hardware inventory isn’t nearly as interesting as software inventory, I did find a few gems.
If you’d like to see hardware inventory data on devices, click on the Hardware Inventory tab and you’ll see the standard tabular view of all devices.
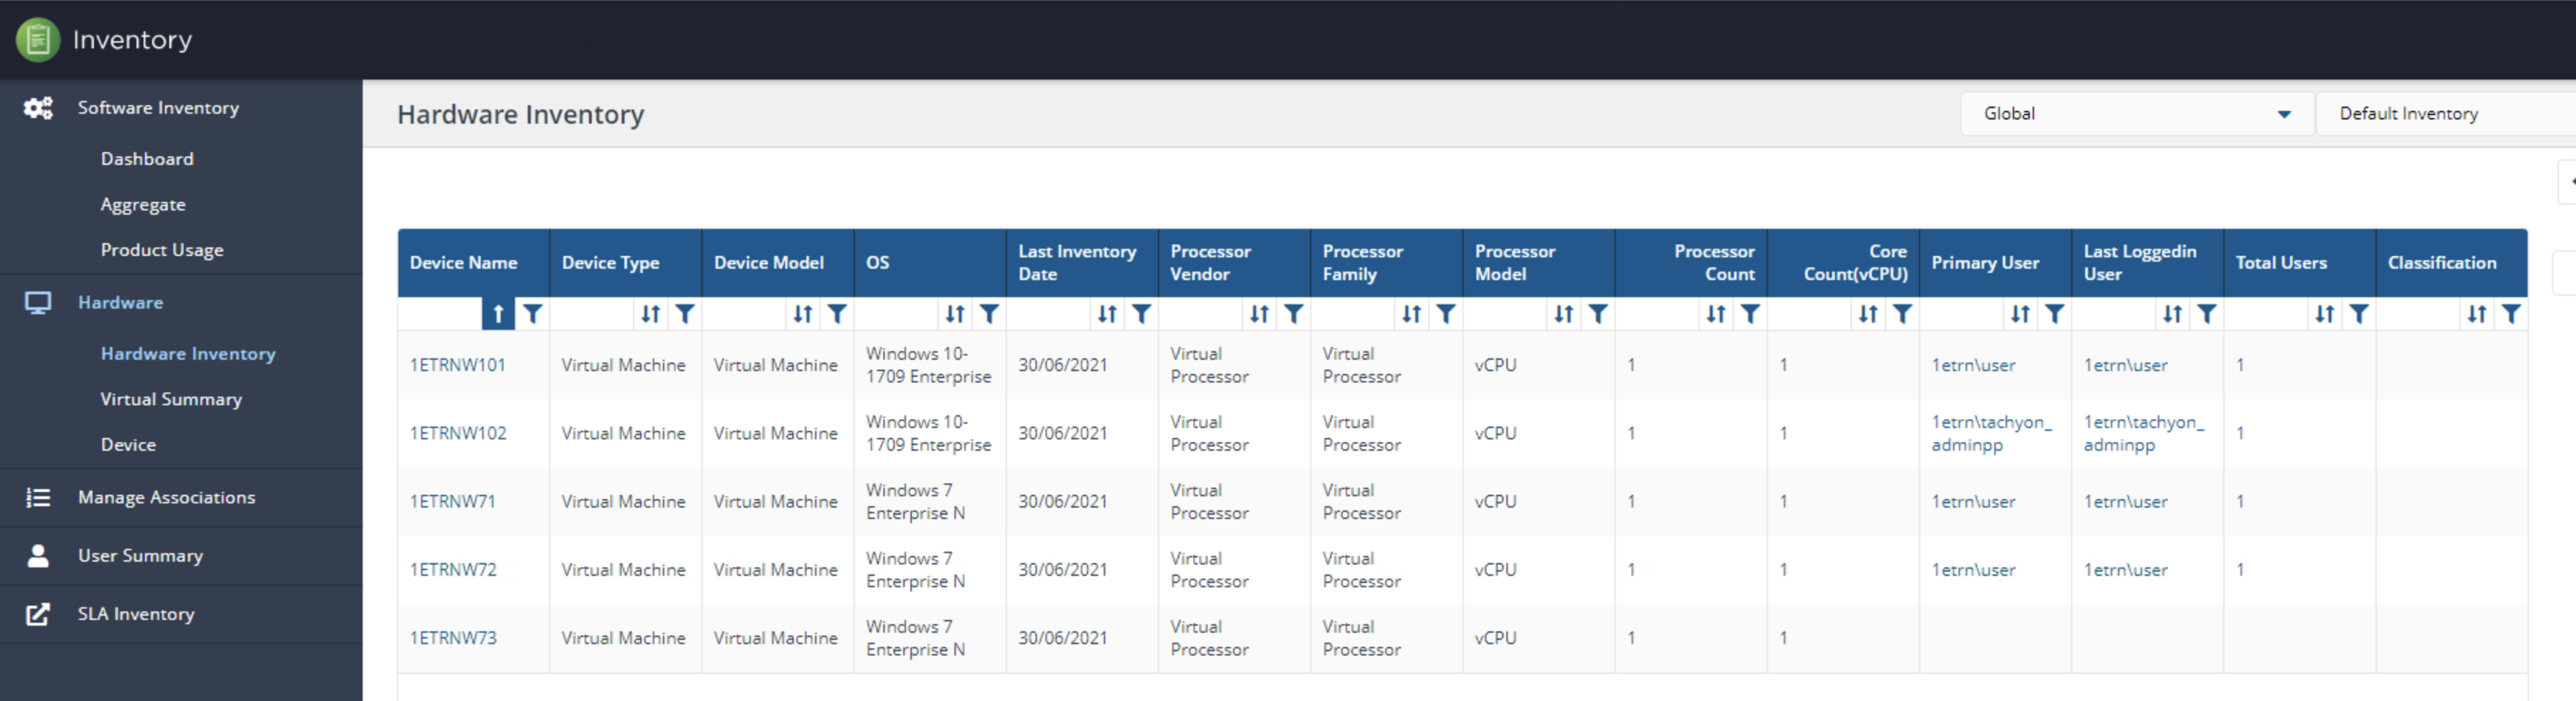
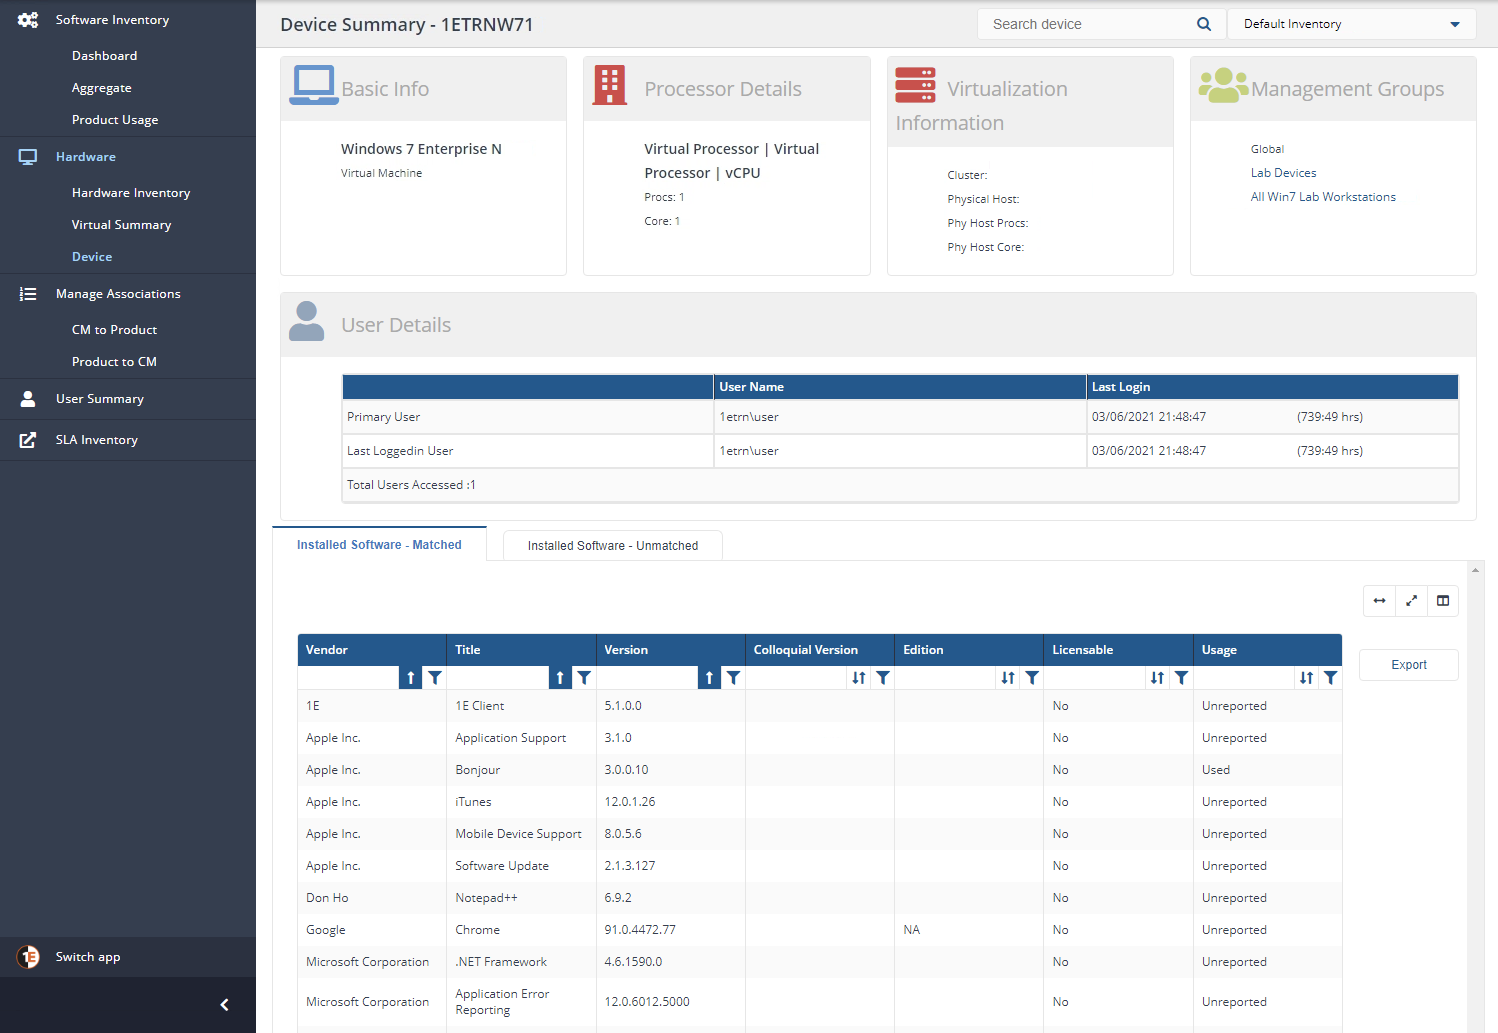
Click on a device and you’ll see a common summary of how the 1E Client sees that device. No earth-shattering revelations here.
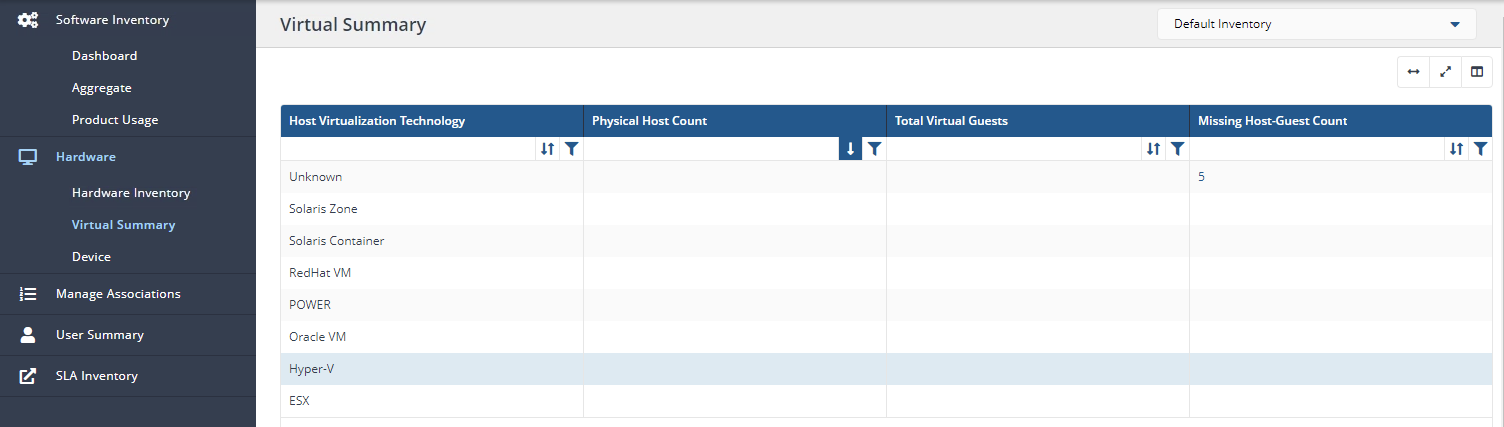
When I clicked on the Virtual Summary, I started having flashbacks.
I remember the days when I had to write complicated SQL queries in SCCM to find every version of VMware Tools installed on machines to know if they were VMs or not. With Tachyon, you’ll see below that under the Hardware tab, we now have Virtual Summary.
Out of the box, Tachyon knows what’s virtualized and what’s not. That would have saved me some serious time.
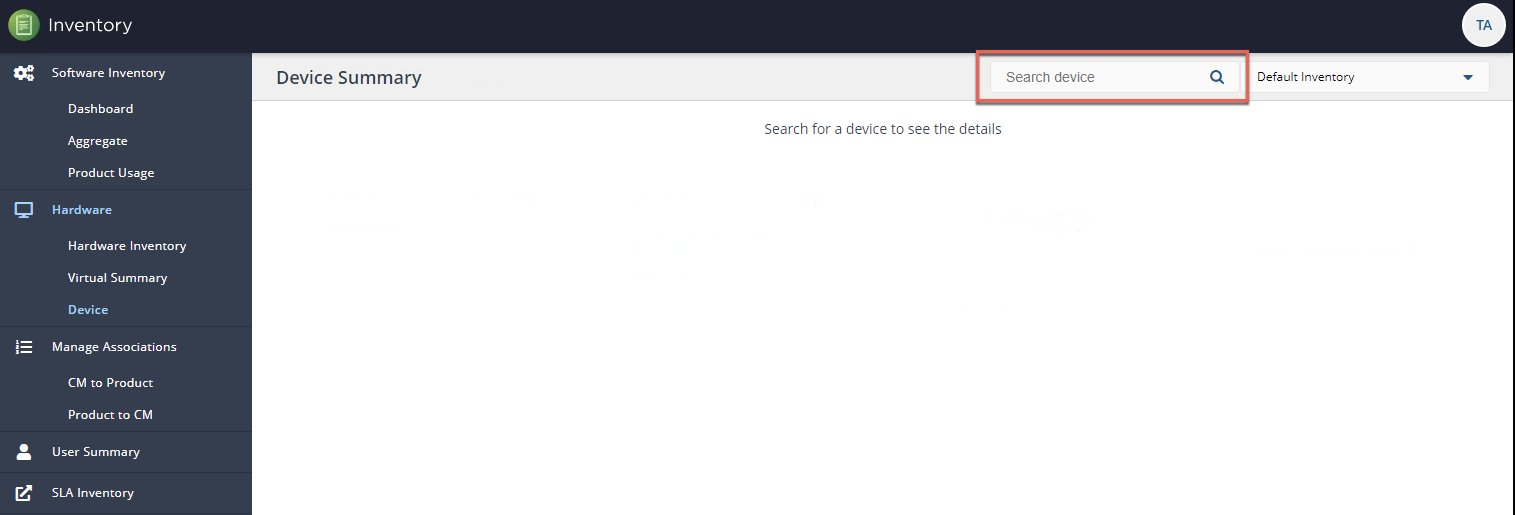
As you navigate down the Hardware options in the Tachyon Portal, I did notice an odd design decision. You’ll see an example of the Device screen below. Notice nothing shows up. To see any device, you must search for it in the highlighted box.
After learning a bit more, I eventually realized that this Device screen populates with a single device when you click on one in the Hardware Summary table. I found this section a little odd and kept wondering why 1E decided to show it, on its own, with no devices in the first place.
Software Lifecycle Automation or an Outdated Interface?
On the left-side navigation menu, you’ll notice an item called Software Lifecycle Automation. At first, the name may be enticing thinking it will help manage software better but you’d be disappointed.
You’ll find nothing in the Software Lifecycle Automation menu that you can’t find in Software Inventory. When you click on this page, you’ll find that it takes you to a legacy interface and contains all of the same general information as in Software Inventory.
The Inventory interface you see in the Software Lifecycle Automation section seemed more like a backend interface to the database rather than a feature of the Tachyon Portal.
Better Filtering than Guaranteed State
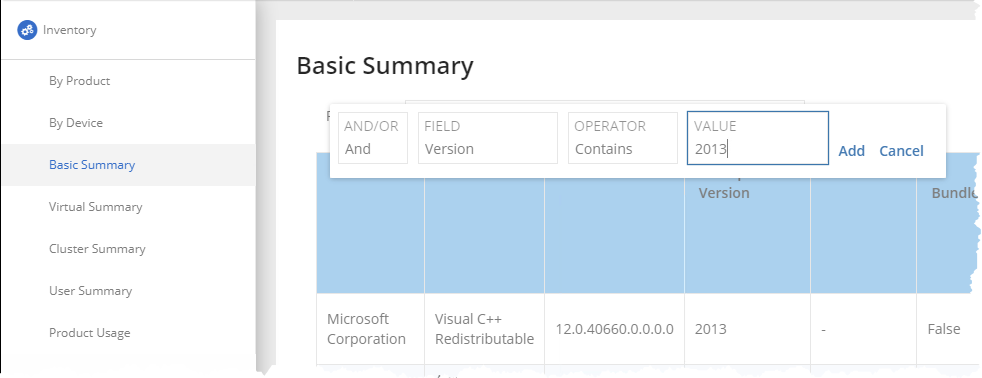
However, as I mentioned in my Guaranteed State article, I was concerned about how Guaranteed State didn’t allow you to create conditions mapped to fields, as shown below.

I did notice in some of the Summary sections that the tabular interfaces displayed did allow you to create complex conditional logic if needed. You’ll see below where you can create AND/OR conditions complete with operators.
In large environments, the ability to create complex filters would be crucial to finding the data you need.
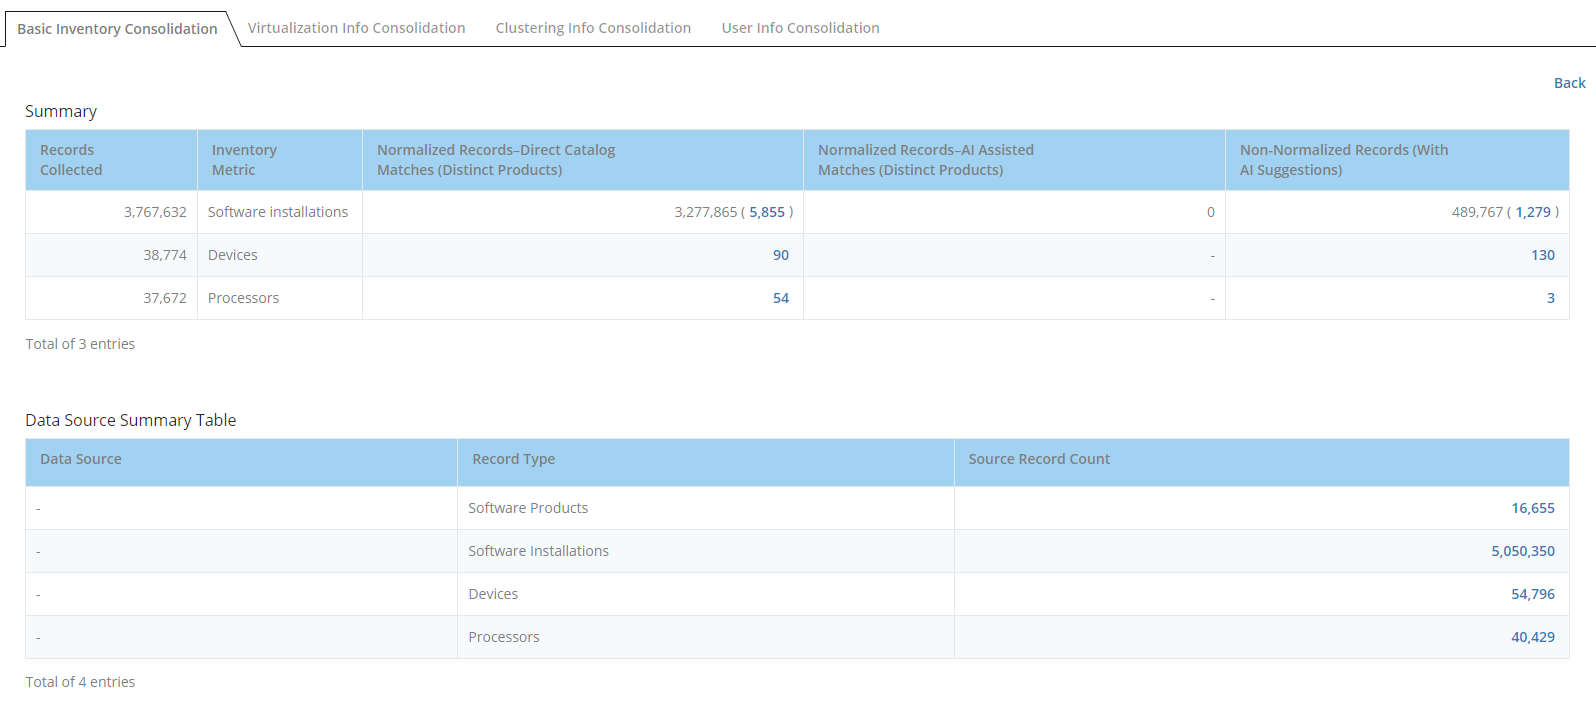
Summarizing Software Inventory by Inventory
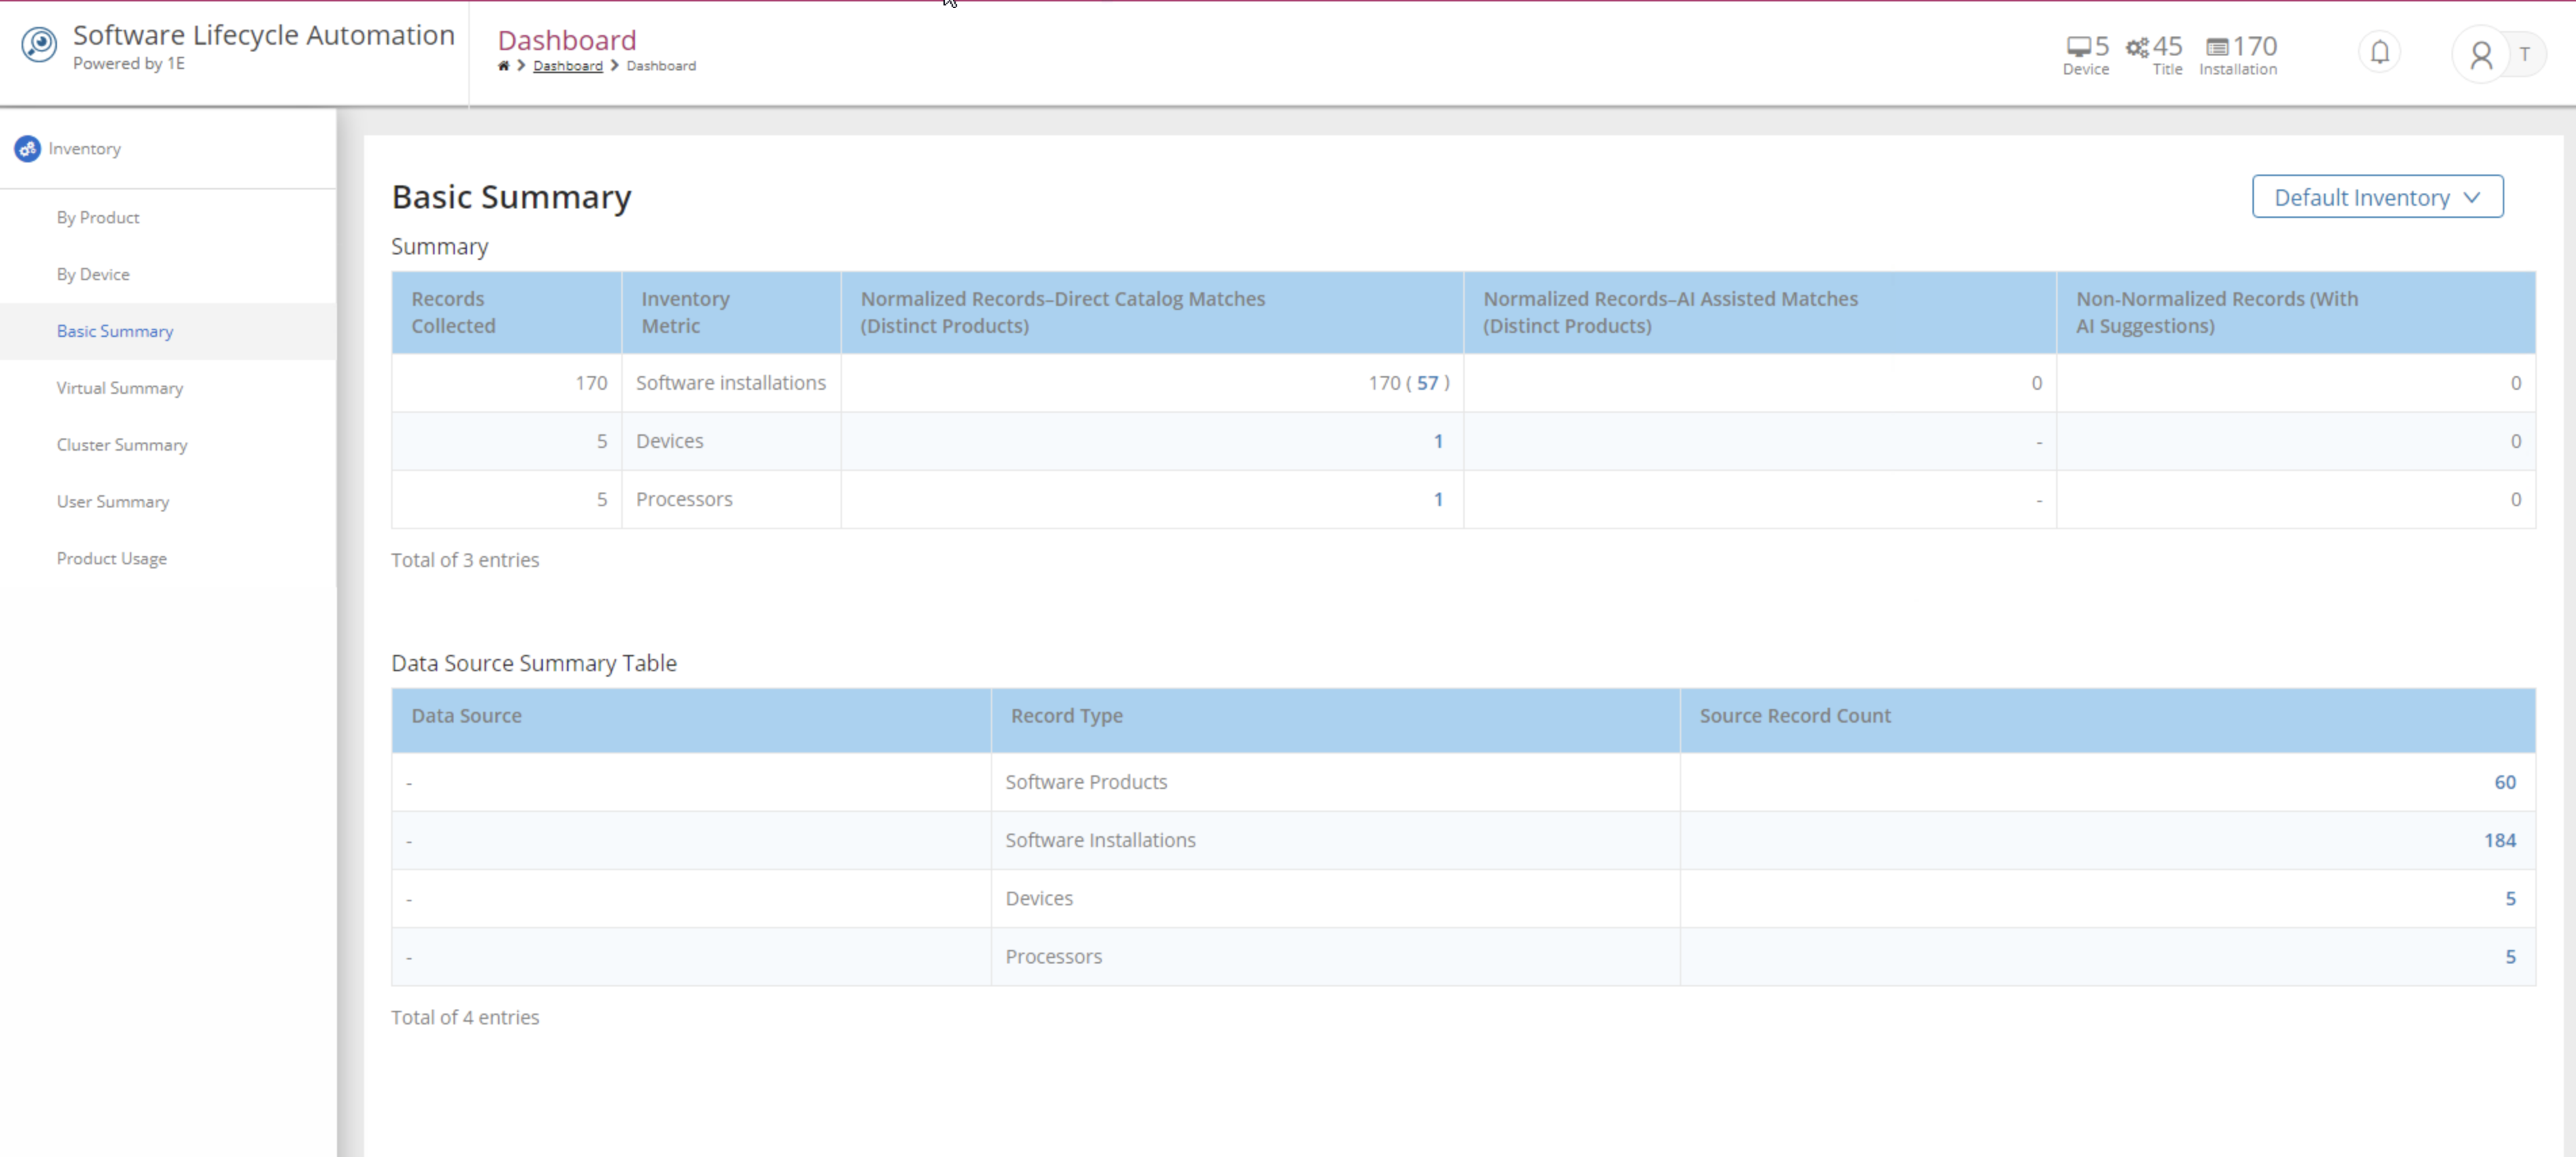
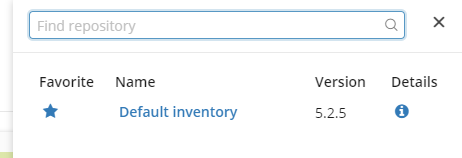
You’ll notice a Find repository box in the upper-right corner of the Software Lifecycle Automation screen, as shown below. This box allows you to browse all of your inventories.
If you click on an inventory, you’ll then be able to see a handy view at the database level, as shown below. You’ll see that this view shows metrics total database records collected for a specific metric, records for items like software, processors, etc.
Other than a better method of filtering and perhaps some views to inspect database record counts, the Software Lifecycle Automation page can be ignored.
Conclusion
Overall, I enjoyed the Inventory application and appreciated the way that 1E seems to have paid close attention to handling all of that inventory data. I also especially liked the data aggregation feature to bring in other sources of inventory data.
Through its obvious attention to detail on the backend and simple to use interface in the Tachyon Portal, the Inventory application is a great way to keep an eye on your endpoints’ hardware, software, and licensing.
Although 1E, in my opinion, could completely remove the Devices and Software Lifecycle Automation pages, the hardware and software inventory features were easy to navigate and provided great insight into many different areas of an organization’s device and software inventory.


