


With the increasing popularity of cybercrime, there is an urgent need for businesses to have better protection against hackers. An Intrusion Prevention System (IPS) is one of the best ways to defend against computer attacks. But before scouring the internet for an IPS, give Suricata a try.
In this tutorial, you will learn how to configure a fully-functional Suricata IPS on a Linux server to protect your network against online threats.
Ready? Read on and start protecting your network!
Prerequisites
This tutorial will be a hands-on demonstration. If you’d like to follow along, be sure you have the following:
- A Linux server – This demo uses Ubuntu 20.04 LTS, but any Linux distribution will work.
- A non-root user with sudo privileges.
- Depending on your network configuration and how you intend to use Suricata, you may need more or less CPU and RAM for your server. Generally, the more traffic you plan to inspect, the more resources you’ll allocate to Suricata. In a developer environment, plan to use at least 2 CPUs and 8GB of RAM to start with so that Suricata can perform its tasks without compromising the quality of service for all users.
Installing Suricata and Adding PPA Repository
Suricata doesn’t come installed by default on Ubuntu, but installing Suricata is similar to how you install other packages on your system.
1. Run the apt update command to update the available packages in your system.
sudo apt update -y
2. Next, run the add-apt-repository command to add the PPA repository maintained by the Open Information Security Foundation (OISF). By adding the PPA repository, you will get the latest and stable version of Suricata (ppa:oisf/suricata-stable).
sudo add-apt-repository ppa:oisf/suricata-stable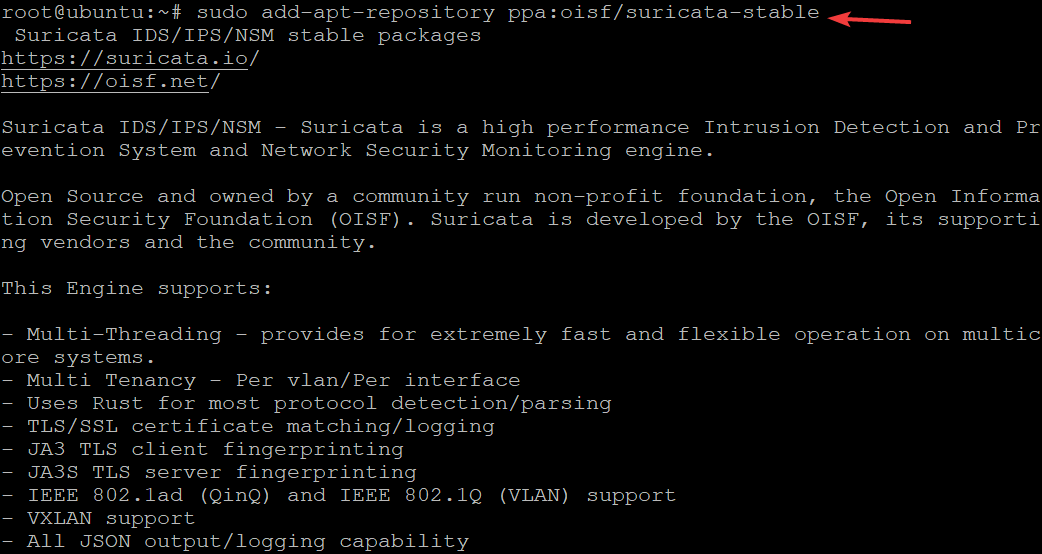
3. Rerun the sudo apt update command to load the newly added Suricata repository to your system’s package index.
sudo apt update -y4. Now, run the sudo apt policy command to verify that you’ve added the Suricata PPA correctly. Ensure that you see Suricata PPA in the list like shown below before installing Suricata
sudo apt policy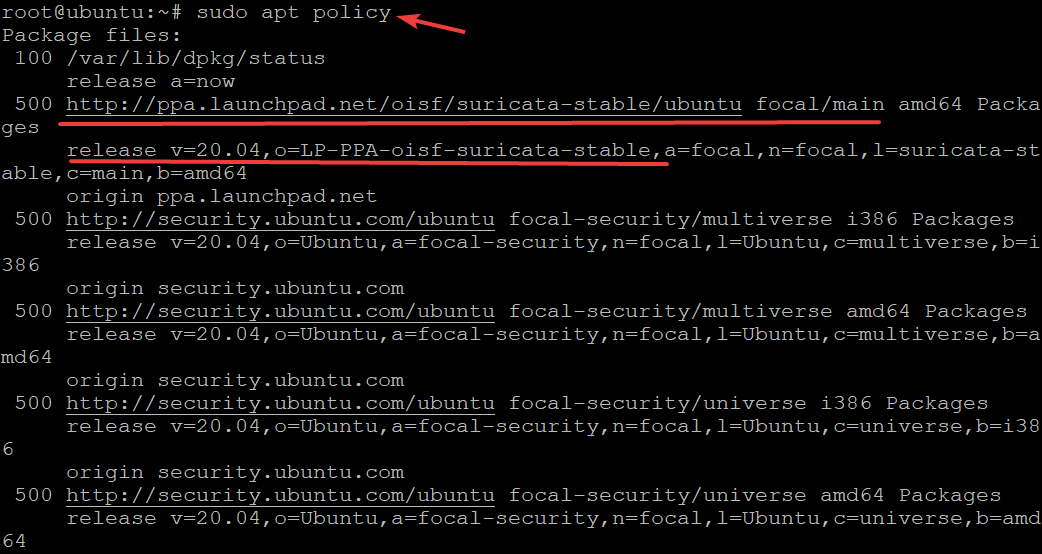
5. Run the following command to install suricata on your system.
sudo apt install suricata -y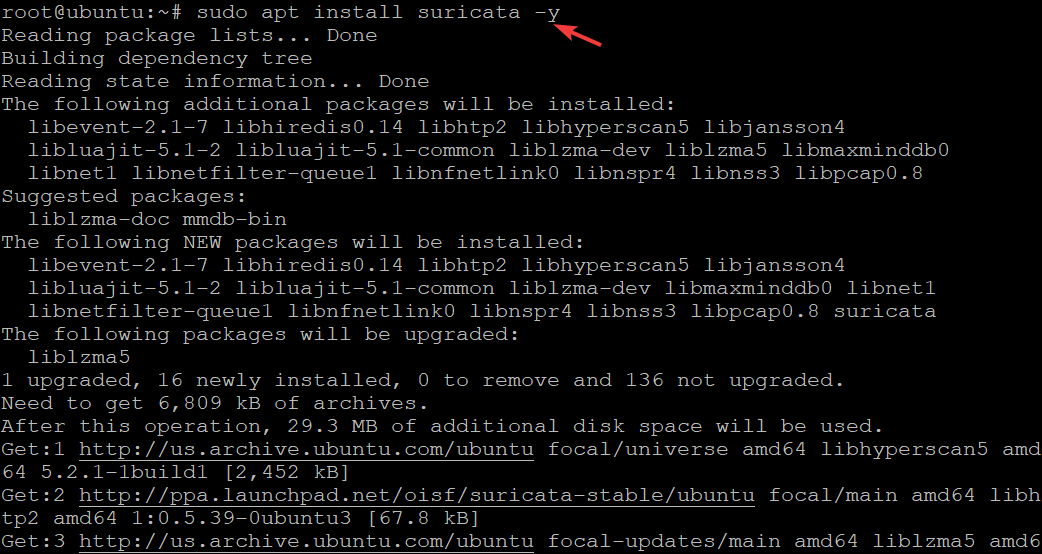
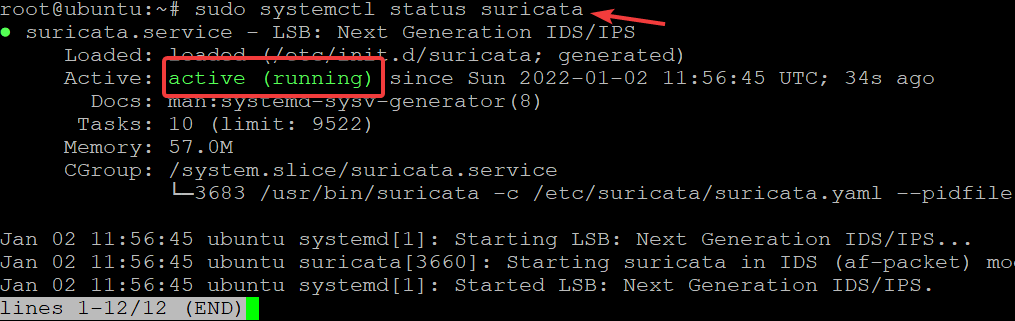
6. Once the installation completes, run the systemctl status command below to check the suricata service status.
sudo systemctl status suricataBelow, you can see that the Suricata service is active (running).
Configuring Suricata
The Suricata package ships with a configuration file named suricata.yaml located at /etc/suricata directory. This configuration file has many different settings for many other use cases. But mind you that there are a few settings in the default configuration file you need to tweak before using Suricata.
The default mode for Suricata is Intrusion Detection (IDS) mode, which logs, but doesn’t drop any traffic. This mode is used when configuring and getting acquainted with Suricata. Once you’re more comfortable with Suricata and better understand the types of traffic Suricata will alert you about, you can opt to turn on IPS mode.
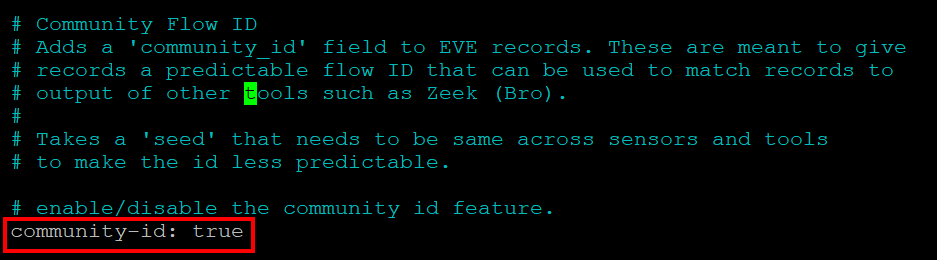
Suricata appends a field in its JSON format (community flow ID). The community flow ID is an 8-byte field that allows you to correlate records generated by other tools. This feature is handy when using Suricata in conjunction with other tools like Bro or Elasticsearch.
1. Open the /etc/suricata/suricata.yaml file in your favorite text editor.
2. Find a line that reads community-id: false and change it to community-id: true. Save the changes and exit from the text editor.
Each time you examine events, you’ll see the community flow ID in their JSON output.
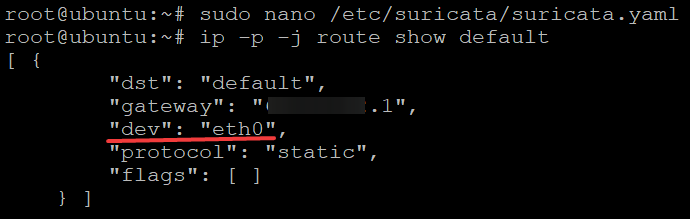
Next, run the following command to find a device with a default route on your system (route show default). The -p flag tells the ip command to print the device in a human-readable way, while the -j flag prints the JSON output.
Suricata is configured to sniff packets from any available network interface by default. But you can change this behavior and specify an interface for Suricata to listen to when it starts.
ip -p -j route show defaultAs you see below, the dev parameter specifies the interface that Suricata will use for sniffing packets. In this demo, the interface is eth0, but your interface may be different, like tun0, wlan0, and so on.
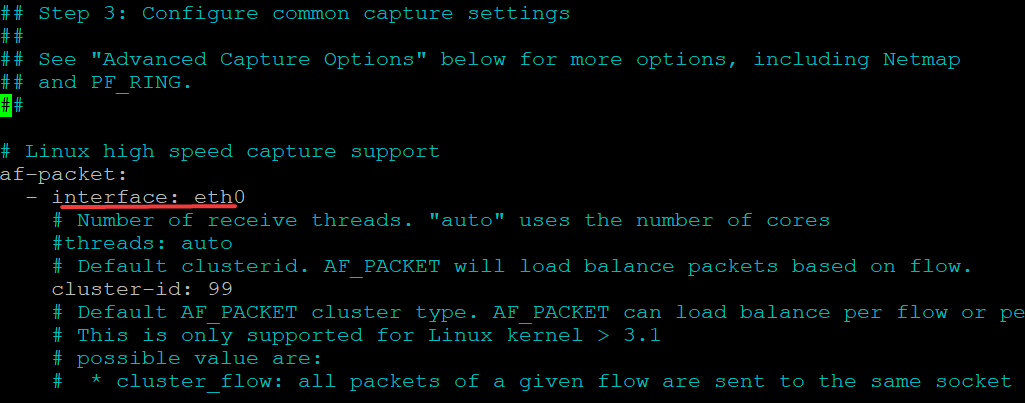
4. Finally, open the /etc/suricata/suricata.yaml configuration file, locate the interface parameter under the af-packet section and modify it accordingly. In this demo, eth0 is used as the interface for sniffing packets.
Save the changes, but keep your text editor open for now.
Setting up the Live Rule Reloading Feature
You’ve now configured Suricata, but that’s just the beginning of protecting your network. Typically, you’d want to add rules on the spot and automatically reload the rules. How? Suricata’s live rule reloading feature allows you to update rules on the fly. As a result, you don’t have to restart Suricata manually so that the new rules will take effect.
Open the /etc/suricata/suricata.yaml file, copy/paste the following directives to the bottom of the file’s content, and save the changes. These directives let you enable the live rule reloading feature.
With this setting in place, when you edit/update your rule sets, changes will take effect without restarting your Suricata service.
detect-engine:
  - rule-reload: true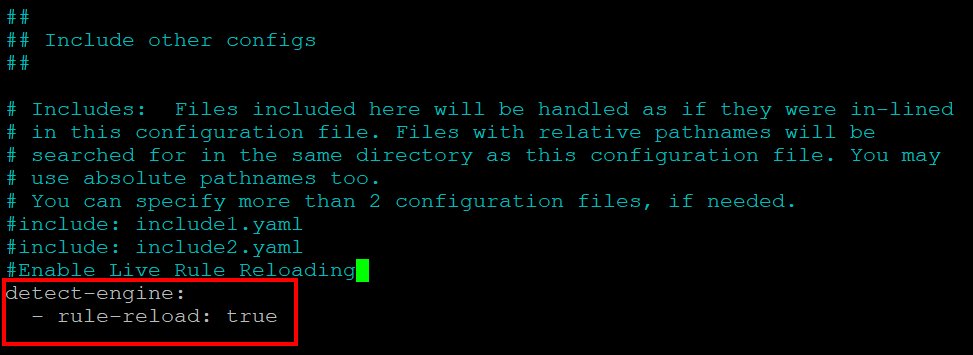
Now run the kill command below to notify your Suricata process ($(pidof suricata)) to update the rules without restarting.
The command sends a user-defined signal (-usr2) to the specified process ID, then Suricata performs the following automatically:
- Load new config to update rule variables and values.
- Load new rules
- Construct new detection engine
- Swap old and new detection engines
- Make sure all threads are updated
- Free up old detection engine
sudo kill -usr2 $(pidof suricata)Updating Suricata Rulesets
The live rule reloading feature is ready, but it won’t serve a purpose unless you update your rulesets. By default, the Suricata package has a limited ruleset that only detects the most common Internet Protocols located in the /etc/suricata/rules directory.
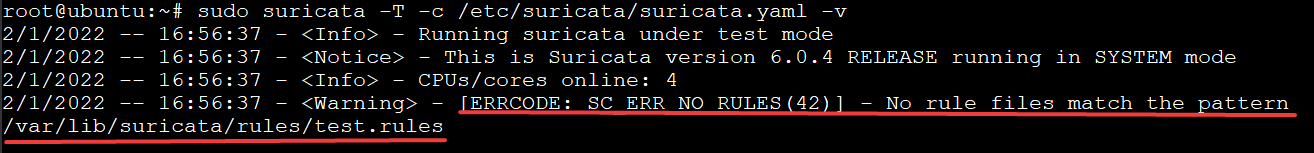
At this point, you will get a No rule files match the pattern error message, like the one below, whenever you try to start and use your Suricata service. This error message indicates that there are no rulesets for Suricata to use.
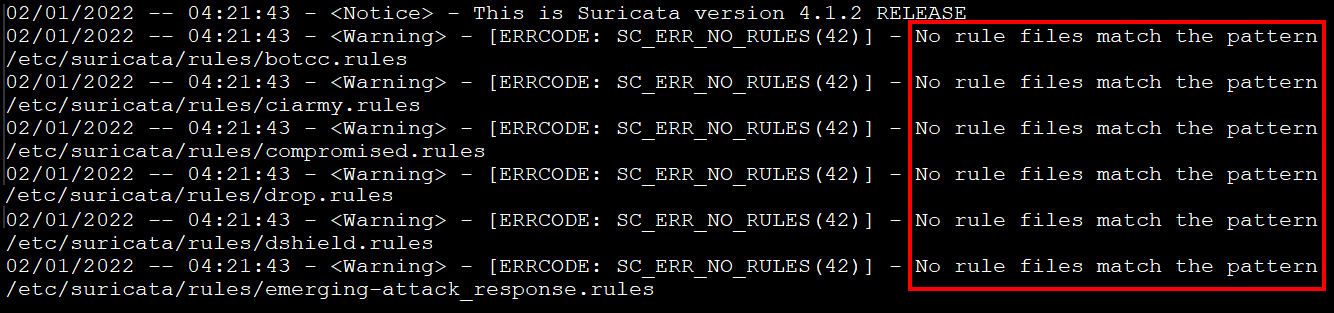
To fix this error, provide ruleset files to your Suricata instance. Luckily, Suricata has a tool named suricata-update that will assist you in fetching more rulesets from third-party providers.
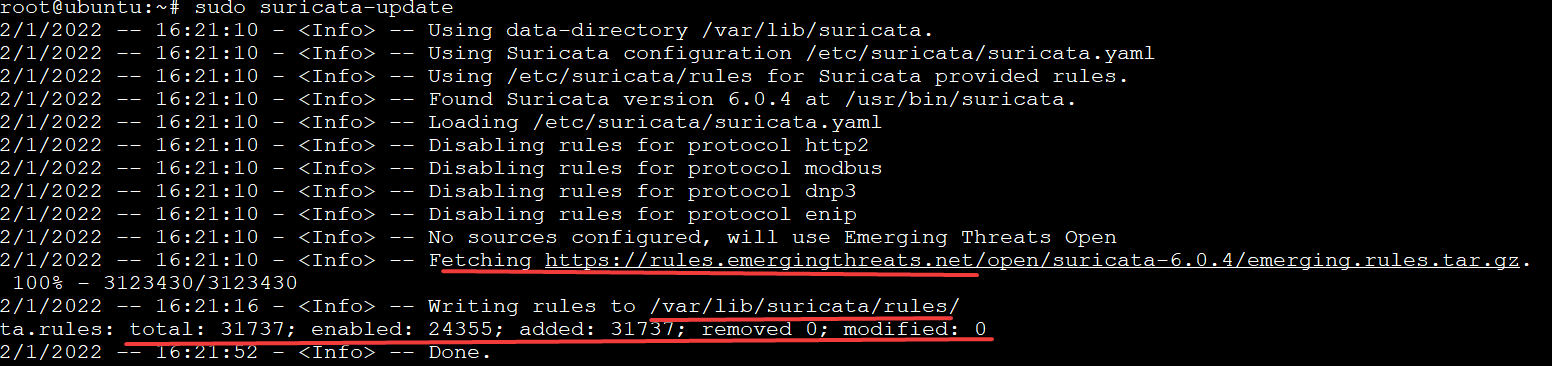
1. Run the command below to get an update for your Suricata instance.
sudo suricata-updateAs you can see below, the output indicates that the suricata-update command fetched the rules by connecting to https://rules.emergingthreats.net/open/. The command then saves the new rules to the /var/lib/suricata/rules/ directory.
The output also prints out the following:
- The total number(31737) of rulesets
- The number of rules that are enabled (24355)
- The number of how many are added(31737)/removed(0).
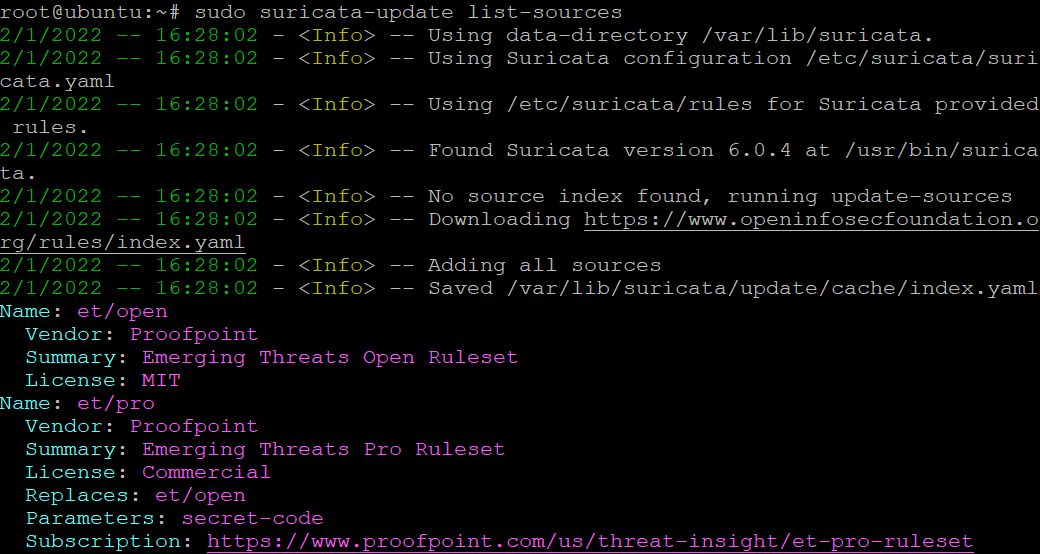
Next, run the command below to list all ruleset providers (list-sources).
The
suricata-updatecommand fetches rulesets from many providers, including free and commercial providers.
sudo suricata-update list-sourcesBelow, you can see a small part of the list. Note a ruleset name you want Suricata to fetch rulesets from specifically. This tutorial fetches et/open rulesets for demonstration (step three).
3. Run the command below to fetch and include (enable-source) the et/open rulesets to your Suricata rules.
sudo suricata-update enable-source et/open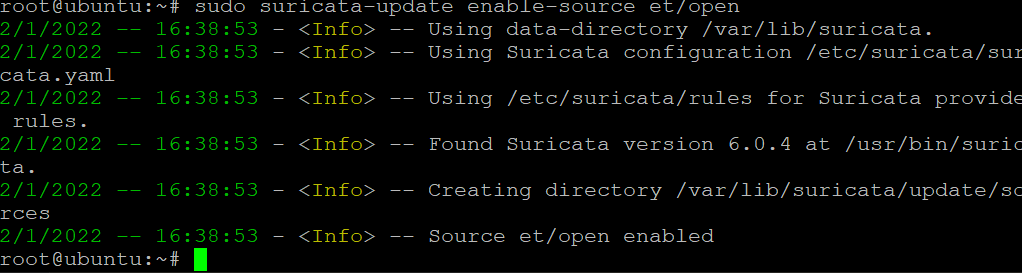
Finally, rerun the suricata-update command to load the newly picked ruleset.
sudo suricata-updateValidating the Suricata Configuration
You’ve configured Suricata and even added rulesets, so it’s time to validate your changes and ensure everything works as expected. The Suricata package has a built-in validation service that allows you to see any deviations from the current configuration.
Run the suricata command below to validate the changes in the Suricata configuration file (-c /etc/suricata/suricata.yaml). The command also displays all validation messages (-v).
The -T flag tells Suricata to run in “test mode” and “top down” mode. Both modes have more strict rules for matching packets and are less likely to make a false positive.
sudo suricata -T -c /etc/suricata/suricata.yaml -vSince Suricata is a highly configurable firewall, the test may take several minutes to complete. If there are no errors, you’ll see an output similar to the one below that shows a complete message.
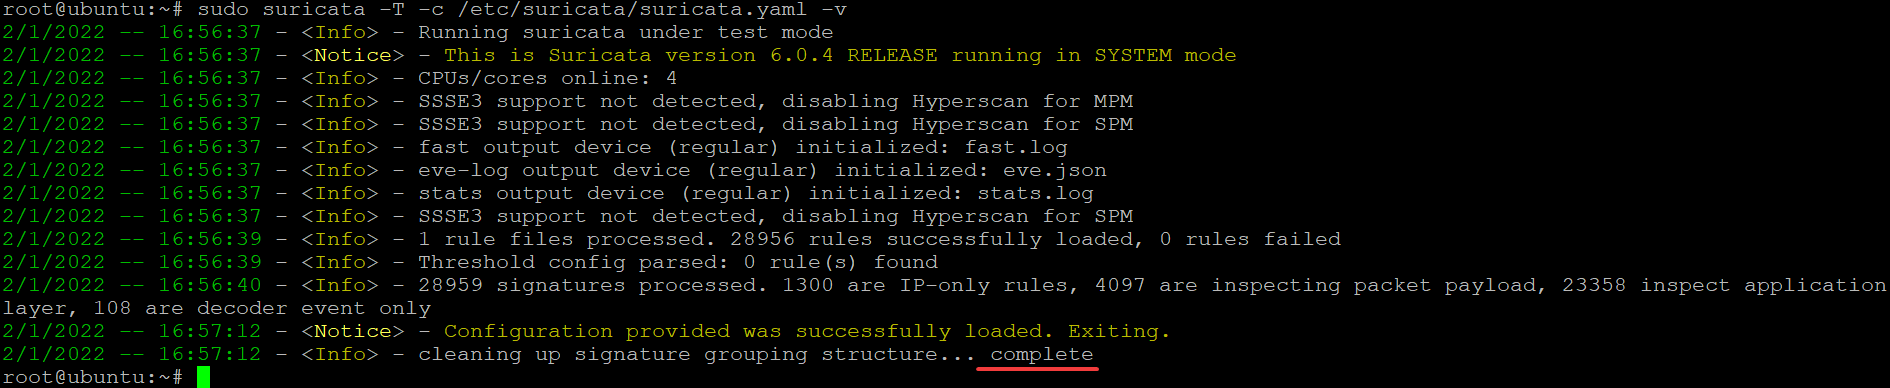
If your configuration file has errors similar to the one below, Suricata will print out each error, indicating specific lines causing problems. If you get these errors, fix each configuration issue one by one until the validation is successful.
Testing the Suricata Rules
Now that your Suricata configuration files are validated, you can run Suricata to see they are working correctly. You’ll use Suricata to test the ET Open (2100498) with the curl command to detect suspicious activity/traffic.
Right now, your Suricata instance has over 30,000 rules that Suricata fetched from various rulesets. So a full test of all the rules with their explanation won’t fit in this tutorial.
1. Run the curl command below to generate some traffic/HTTP requests/activities from the TestMyNIDS website. TestMyNIDS is an e-learning project dedicated to supporting NIDS tests, validation, and comparison. The website provides a unique platform for comparative analysis of NIDS and related tools.
You can use this website to test any suspicious activity/traffic to see if your configured ruleset is working as expected.
curl http://testmynids.org/uid/index.htmlThe response data is designed to trigger a false alert pretending to be a Linux/Unix root user. And this root user is on a system that might be compromised.

Next, run the grep command below to examine the fast.log file in the /var/log/suricata/ directory for a matching alert message 2100498. This command checks the log file for user alert.
Apart from the fast.log file, another log file to look out for is the eve.log in the same directory.
grep 2100498 /var/log/suricata/fast.logYou’ll see an output similar to the one below that shows your system’s public IPv4 address.

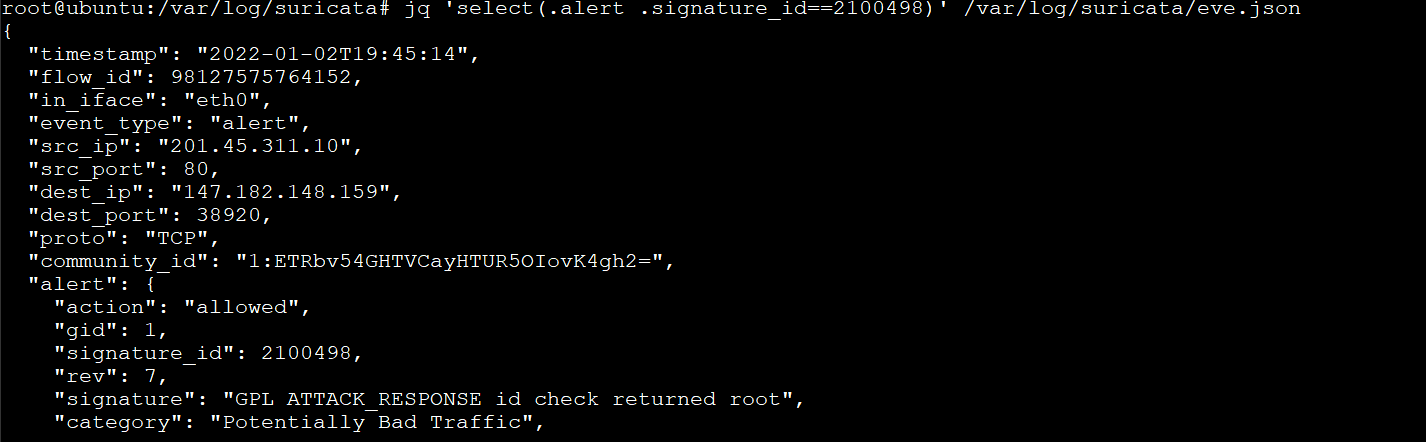
3. Now, run the jq command below to examine the eve.log file. The eve.log file is also used for logging events but in JSON format (/var/log/suricata/eve.json). It is the eve.json and fast.log files that you will reference for suspicious traffic and blocked attempts. Once found, take action as necessary.
jq 'select(.alert .signature_id==2100498)' /var/log/suricata/eve.jsonBelow, you can see “signature_id”: 2100498 in the output, which is the alert signature ID you specified in the command.
You can also see the “community_id”: “1:ETRbv54GHTVCayHTUR5OIovK4gh2=” in the output, which is the Community Flow ID you set up in the /etc/suricata/suricata.yaml file.
This community_id is handy when you use Suricata in conjunction with other tools like Elasticsearch to get a full “security monitoring stack” for a reasonably low cost.
Conclusion
Throughout this tutorial, you’ve learned how to install and configure Suricata with rulesets to protect your network. You’ve also gone through testing if the rulesets are working by generating traffic on your network.
At this point, Suricata is running perfectly with your custom ruleset to detect suspicious activities/traffic on your network.
Now, why not build on this newfound knowledge? Perhaps begin with installing and configuring Suricata, Zeek, the Elasticsearch stack to set up a full “security monitoring stack”?


