


Microsoft SQL Server can be one of the most resource-intensive server applications out there. You should build a SQL Server performance monitor script with PowerShell to help keep tabs on it!
SQL Server can also run on Linux but, unfortunately, you don’t have the performance counter system that you do on Windows.
Windows has had built into it a great resource for getting insights into various performance metrics for the operating system itself as well as many other applications known as performance counters.
The Windows Performance Monitor is a staple of many IT professionals out there. Although the Windows Performance Monitor is a great tool to visually see performance statistics, it’s not necessarily great for automation. This is where PowerShell comes in.
By using PowerShell to query performance statistics you can use these numbers as triggers for other functions like making decisions to automatically move databases to faster storage, automatically add an additional CPU, memory, etc.
In this article, let’s go over some of the most common performance metrics for SQL and how to query them with PowerShell.
Using Get-Counter
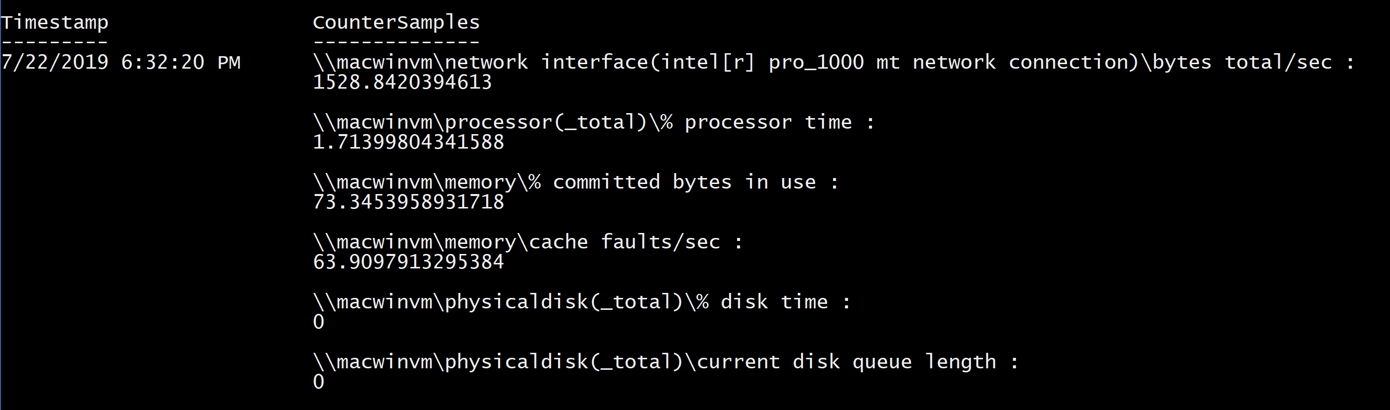
The PowerShell cmdlet you’re going to get the most comfortable with is Get-Counter. Get-Counter is a cmdlet that allows you to query any number of performance metrics from Windows. Run it by itself and you’ll get a list of various common performance counters and their current values.
Get-Counter, used without parameters queries the local computer. We’re going to be querying a SQL server so use the ComputerName parameter to specify your remote SQL server.
PS> Get-Counter -ComputerName SQLSRVWhen you run Get-Counter by just using the ComputerName parameter, the cmdlet returns a default set of counters which is probably not what you want to see.
Finding SQL Server Performance Counters
Get-Counter will return the same counter values. However, we’re going to look for some counters that are important to SQL server. We’ll be querying:
- Avg. CPU Queue Length
- Avg. Disk Queue Length
- Memory Pages/Sec
- Latch Wait Time
- Buffer Page Life Expectancy
- Average Lock Wait Time.
To get the current values for each of these counters, we’ll first need to determine which set they are in and their proper name. In any metric where multiple instances can be used, I’m using an asterisk to get an average across all available instances or using _total to get a sum of all instances.
- Avg. CPU Queue Length = \System\Processor Queue Length
- Avg. Disk Queue Length = \PhysicalDisk()\Avg. Disk Queue Length
- Memory Pages/Sec = \Memory\Pages/sec
- Latch Wait Time = \SQLServer:Latches\Average Latch Wait Time (ms)
- Buffer Page Life Expectancy = \SQLServer:Buffer Manager\Page lifeexpectancy
- Average Lock Wait Time = \SQLServer:Locks(_total)\Average WaitTime (ms)
Now that we have the correct counter names defined and the counter sets the counters are a part of, we can now begin to put together some PowerShell code to create a SQL Server performance monitor.
Querying the SQL Performance Counters
To get an overall picture of performance and remove the possibility of a one-time spike in any of the counters, I’m going to query each of the counters ten times. I’ll use the default sample interval of one second which means I’m going to query each counter ten times over ten seconds.This should give me a more realistic number than simply querying eachcounter a single time.
To do this, I’ll use the MaxSamples parameter on Get-Counter. This will allow me to specify the maximum number of times each counter will be queried. I’ll gather up all of these figures and then take an average of each when I’m finished.
Because I just want the values and don’t necessarily care about the formatting, I’ll specify the CounterSamples property directly and the CookedValue property as part of that. This gives me only the actual integer values.
Because I’ll be querying multiple performance counters, it’s good practice to group them up into array. I’ve done so below and assigning it the variable $counters. I’ve chosen to use hashtables with the”friendly” name of the counter and the actual counter name. I then have something I can read with a foreach loop.
$counters = @(
    @{
        'Name' = 'Avg. CPU Queue Length'
        'CounterName' ='\System\Processor Queue Length'
    }
    @{
        'Name' = 'Avg. Disk Queue Length'
        'CounterName' ='\PhysicalDisk()\Avg. Disk Queue Length' }
    @{
        'Name' = 'Memory Pages/Sec'
        'CounterName' = '\Memory\Pages/sec'
    }
    @{
        'Name' = 'Latch Wait Time'
        'CounterName' ='\SQLServer:Latches\Average Latch Wait Time (ms)'     }
    @{
        'Name' = 'Buffer Page Life Expectancy'
        'CounterName' ='\SQLServer:Buffer Manager\Page life expectancy'     }
    @{
        'Name' = 'Average Lock Wait Time'
        'CounterName' ='\SQLServer:Locks(_total)\Average Wait Time (ms)'
    }
)
Once I have the array of hashtables defined, I’ll then begin to read each counter, gather up all ten samples and add the average value to the counter instance itself.
Finally, I’m creating a PowerShell custom object so the output can be easily used for other purposes, if necessary.
$sqlServerName = 'LABSQL'
foreach ($counter in $counters) {
    $values = (Get-Counter -ComputerName $sqlServerName -Counter $counter.CounterName -MaxSamples 10).CounterSamples.CookedValue
    $counter.Add('Value', ($values | Measure-Object -Average).Average)
    [pscustomobject]$counter
}
When you run the above code snippet, you’ll see that Get-Counter will query each of the counters defined in the $counters array and return the values. Since each iterator ($counter) is a hashtable, the script is then adding a property called Value and averaging out the values.
What you end up with with a single pscustomobject object with a single property Value representing an average of each counter value.
This ends up getting us a nice report showing performance counter statistics for our SQL server!
Summary
You can see that working with performance counters in PowerShell is pretty straightforward. The hardest part for me was just trying to find the counter names themselves! Now take that the start of the SQL Server performance monitor script shown here and extend it!


