

Does your management want to know everything about your company’s finance and productivity but won’t spend a dime on top-shelf IT management tools? Don’t end up turning to different tools for inventory, billing, and ticketing systems. You only need one central system. Why not consider Power BI Python?
Power BI can turn tedious and time-consuming tasks into an automated process. And in this tutorial, you’ll learn how to slice and combine your data in ways you could not imagine.
Come on, and save yourself the stress of eyeballing through complex reports!
Prerequisites
This tutorial will be a hands-on demonstration. If you’d like to follow along, be sure you have the following:
- Power BI subscription – The free trial will suffice.
- A Windows Server – This tutorial uses a Windows Server 2022.
- Power BI Desktop installed on your Windows Server – This tutorial uses Power BI Desktop v2.105.664.0.
- MySQL Server installed – This tutorial uses MySQL Server v8.0.29.
- An on-premises data gateway installed on external devices planning to use a Desktop version.
- Visual Studio Code (VS Code) – This tutorial uses VS Code v17.2
- Python v3.6 or later installed – This tutorial uses Python v3.10.5.
- DBeaver installed – This tutorial uses DBeaver v22.0.2.
Building a MySQL Database
Power BI can beautifully visualize data, but you need to fetch and store it before you get to the visualization of the data. One of the best ways to store data is in a database. MySQL is a free and powerful database tool.
1. Open command prompt as administrator, run the mysql command below and input the root username (-u) and password (-p) when prompted.
By default, only the root user has permission to make changes to the database.
mysql -u root -p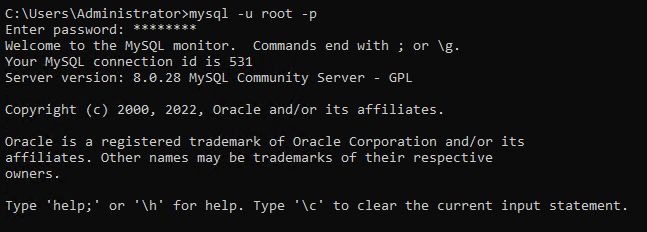
2. Next, run the query below to create a new database user (CREATE USER) with a password (IDENTIFIED BY). You can name the user differently, but this tutorial’s choice is ata_levi.
CREATE USER 'ata_levi'@'localhost' IDENTIFIED BY 'Password';
3. After creating a user, run the below query to GRANT the new user permissions (ALL PRIVILEGES), such as creating a database on the server.
GRANT ALL PRIVILEGES ON . TO 'ata_levi'@'localhost' WITH GRANT OPTION;
4. Now, run the \q command below to log out of MySQL.
5. Run the mysql command below to log in as the newly-created database user (ata_levi).
mysql -u ata_levi -p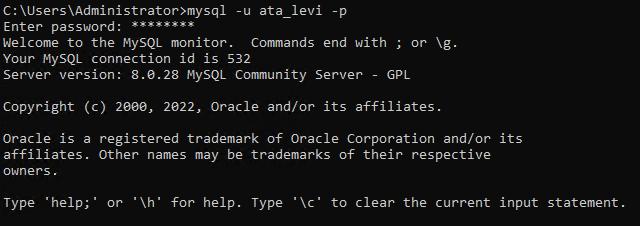
6. Lastly, run the following query to CREATE a new DATABASE called ata_database. But of course, you can name the database differently.
CREATE DATABASE ata_database;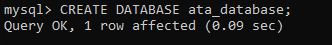
Managing MySQL Databases with DBeaver
In managing databases, you usually need to have SQL knowledge. But with DBeaver, you have a GUI to manage your databases in a few clicks, and DBeaver will take care of the SQL statements for you.
1. Open DBeaver from your Desktop or the Start menu.
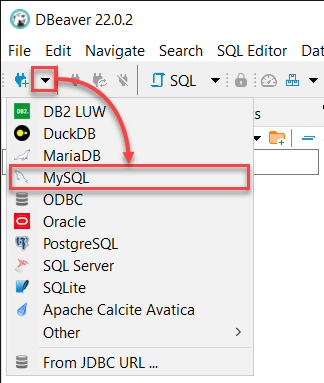
2. When DBeaver opens, click on the New Database Connection dropdown and select MySQL to initiate connecting to your MySQL server.
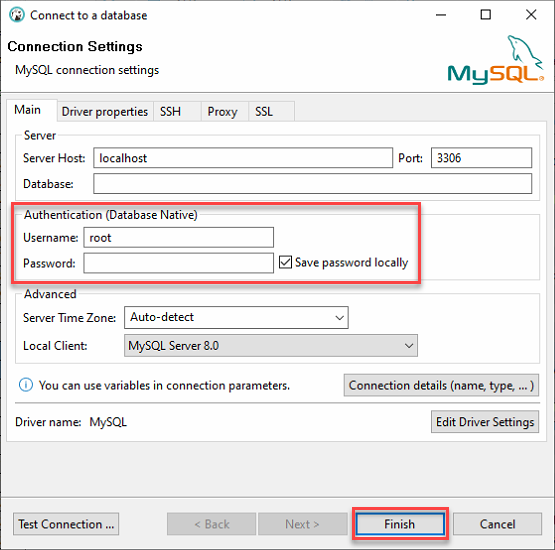
3. Log in to your local MySQL server with the following:
- Keep the Server Host as localhost and Port at 3306 since you’re connecting to a local server.
- Provide the ata_levi user’s credentials (Username and Password) from step two of the “Building a MySQL Database” section, and click on Finish to login to MySQL.
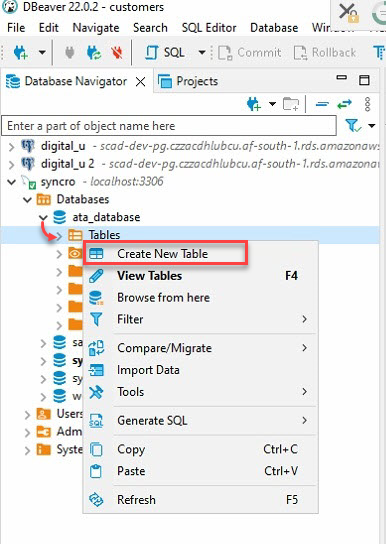
4. Now, expand your database (ata_database) under the Database Navigator (left-panel) → right-click on Tables, and select Create New Table to initiate creating a new table.
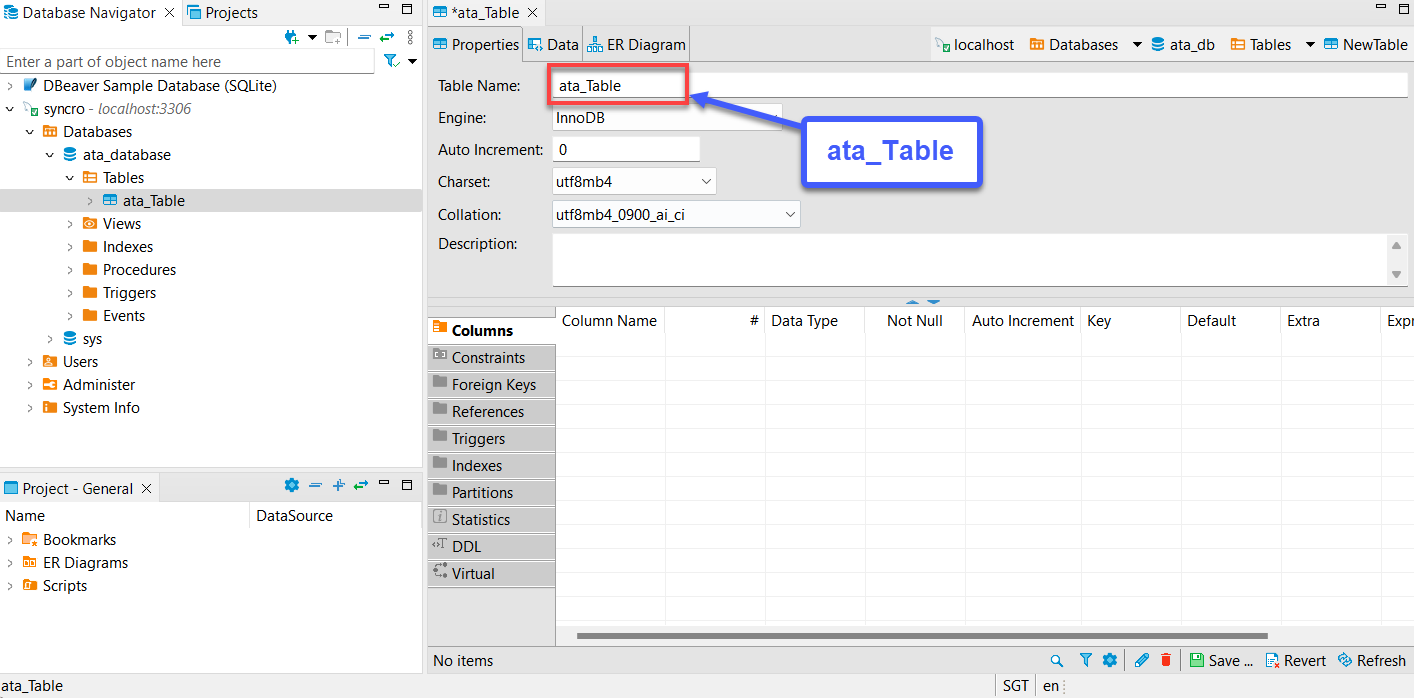
5. Name your new table, but this tutorial’s choice is ata_Table, as shown below.
Make sure the table name matches the table name you’ll specify on the to_sql (”Table name”) method in step seven of the “Getting and Consuming API Data” section.
6. Next, expand the new table (ata_table) → right-click Columns → Create New Column to create a new column.
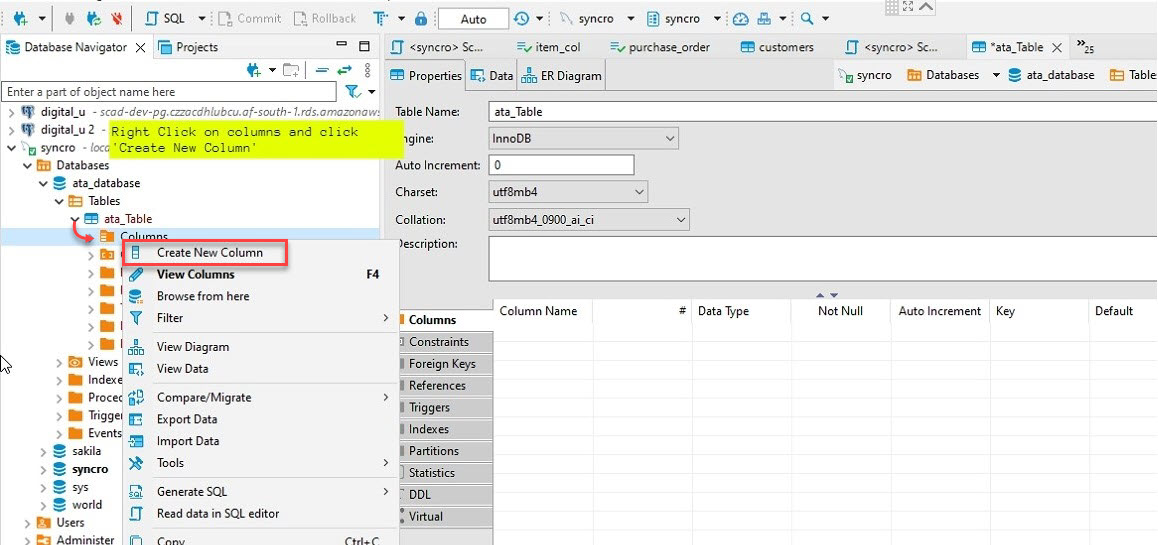
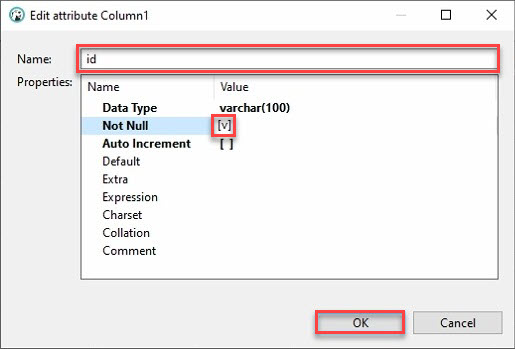
7. Provide a column Name, as shown below and tick on the Not Null box, and click OK to create the new column.
Ideally, you’d want to add a column called “id.” Why? Most APIs will have an id, and Python’s pandas data frame will automatically fill the other columns.
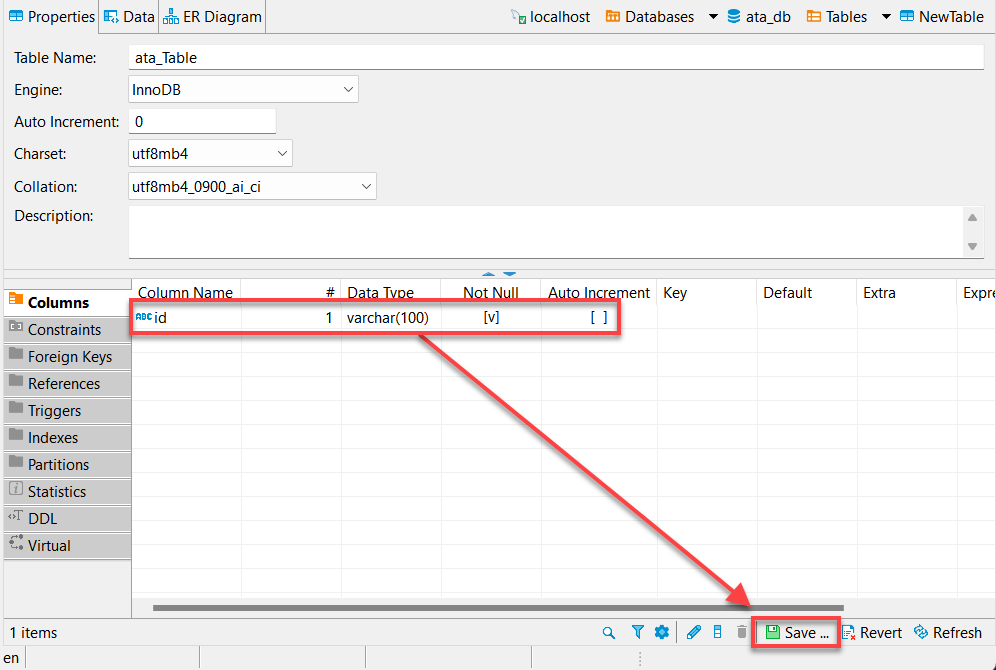
8. Click on Save (bottom-right) or press Ctrl+S to save the changes once you’ve verified your newly-created column (id), as shown below.
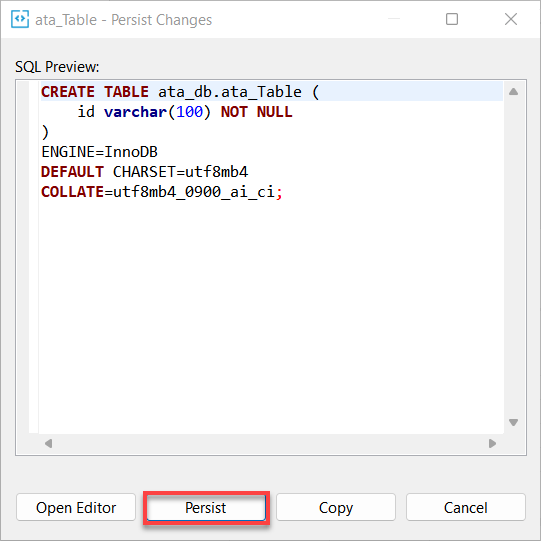
9. Lastly, click on Persist to persist the changes you made to the database.
Getting and Consuming API Data
Now that you’ve created the database to store data, you need to fetch the data from your respective API provider and push it to your database using Python. You’ll source your data to be visualized on Power BI.
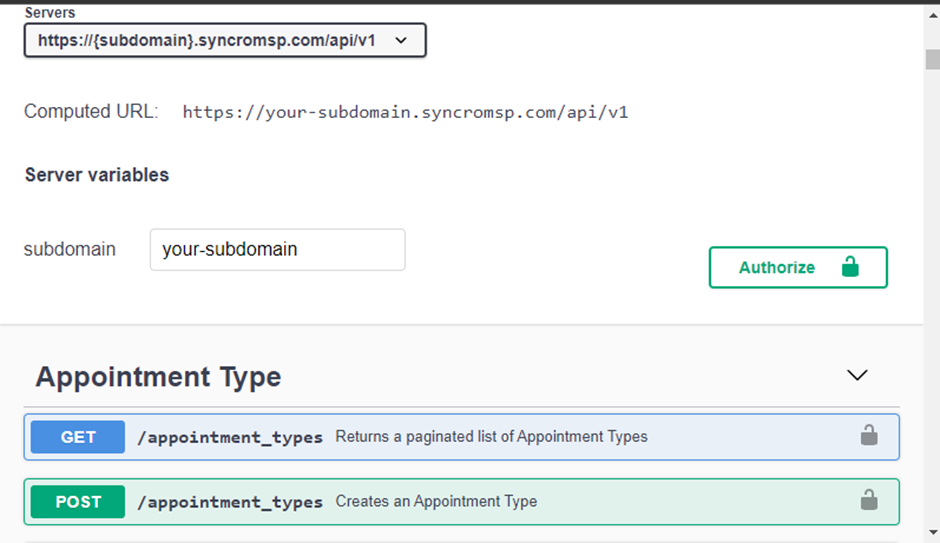
To connect to your API provider, you’ll need three key pieces of information; the authorization method, API base URL, and API endpoint. If in doubt about or how to obtain this information, visit your API provider’s documentation site.
Below is a documentation page from Syncro.
1. Open VS Code, create a Python file and name the file according to the API data expected from the file. This file will be responsible for fetching and pushing the API data to your database (database connection).
Multiple Python libraries are available to help with the database connection, but you’ll use SQLAalchemy in this tutorial.
Run the below pip command on VS Code’s terminal to install SQLAalchemy on your environment.
pip install SQLAlchemy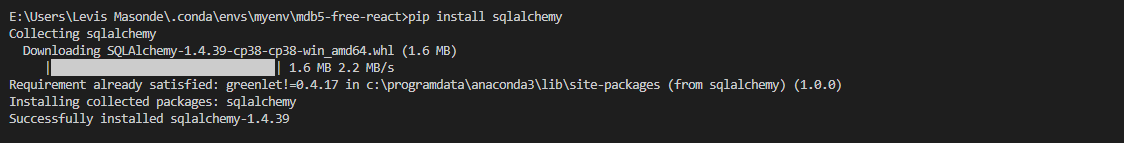
2. Next, create a file called connection.py, populate the code below, replace the values accordingly, and save the file.
Once you start writing scripts to communicate with your database, a connection to the database must be established before the database accepts any command.
But instead of rewriting the database connection string for every script you write, the code below is dedicated to making this connection to be called/referenced by other scripts.
# Importing modules
# Connection engine from sqlalchemy
from sqlalchemy import create_engine
import sqlalchemy as db
from sqlalchemy.exc import SQLAlchemyError

# Using try/except logic to create a MySQL database connection
# Provide the MySQL server credentials below:
# db: database name
# user: username
# pw: password
try:
    engine = create_engine("mysql+pymysql://{user}:{pw}@localhost/{db}"
    .format(
        db="ata_database",
        user="ata_levi",
        pw="password"
    ))
    print("Connected")
except SQLAlchemyError as e:
    error = str(e.dict['orig'])
print(error)
3. Open Visual Studio’s terminal (Ctrl+Shift+`), and run the below commands to install pandas and requests.
pip install pandas
pip install requests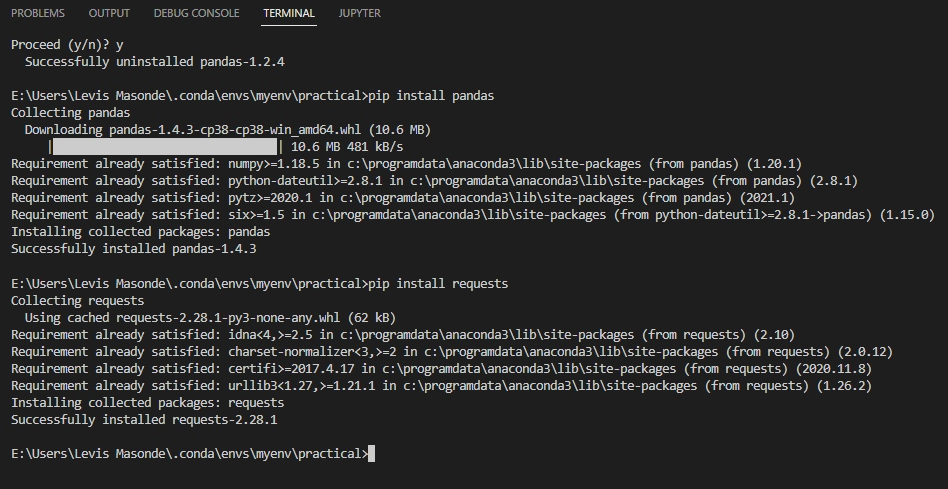
4. Create another Python file called invoices.py (or name it differently), and populate the code below to the file.
You’ll add code snippets to the invoices.py file on each subsequent step, but you can view the complete code on ATA’s GitHub.
The invoices.py script will be run from the main script described in the following section, which pulls your first API data.
The code below performs the following:
- Consumes data from your API and writes it to your database.
- Replaces the authorization method, key, base URL, and API endpoints with your API provider credentials.
# Importing essential modules
import pymysql
from pandas.core.frame import DataFrame
import requests
import pandas as pd
from requests.api import get
from sqlalchemy.dialects.mysql import LONGTEXT

import os
import schedule
import time
import asyncio

# Importing the connection string from connection.py
from connection import engine
5. Add the code snippet below to the invoices.py file to define the headers, for example:
- The type data format you expect to receive from your API.
- The base URL and endpoint should accompany the authorization method and respective key.
Ensure to change the values below with your own.
# Defining request parameters.
headers = {
'accept':'application/json',
'authorization':'Bearer *Your-bearer-code if the authentication is Bearer*'
}
baseurl = 'https://*your base url*'
endpoint  = 'your endpoint'
6. Next, add the following async function to the invoices.py file.
The code below uses AsyncIO to manage your multiple scripts from one main script covered in the following section. When your project grows to include multiple API endpoints, it’s good practice to have your API consumption scripts have their own files.
# Wrap the code with an async function to make it asynchronous.
async def get_invoices():
	print("Going through the invoices")
	def main_request(baseurl,endpoint,x,headers):
	# Using request's get method to pull data using defined parameters.
	# Using f string to iterate pages when the function is called.
	r = requests.get(baseurl + endpoint + f'?page={x}',headers=headers)
	return r.json()
7. Finally, add the code below to the invoices.py file, where a get_pages function handles the pagination of your API.
This function returns the total number of pages in your API and helps the range function iterate through all the pages.
Contact the developers of your API about the pagination method used by your API provider.
  def get_pages(response):
			return response['meta']['total_pages']

	def parse_json(response):
	    charlist =[]
	    for item in response['invoices']:
	        charlist.append(item)
	    return charlist
	# Calling the main function with pre-defined parameters.
	data = main_request(baseurl=baseurl,endpoint=endpoint,x=1,headers=headers)

	main_invoices = []
	# Iterating/paginating through API data.
  # Your API provider might be using a different
	# Method for paginating.
	for x in range(1,get_pages(data)+1):

	    print(x)
	    main_invoices.extend(parse_json(main_request(baseurl,endpoint,x,headers)))
	df_invoices = pd.DataFrame(main_invoices)

	# Write new data to sql database.
	# Note: Ensure the database's table name matches the table name provided here.
	df_invoices.to_sql('invoices',con=engine,if_exists='replace',index=False)

  # This function awaits the get_invoices function,
	# runs the get_invoices() function when called,
	# and will be called by an external file to envoke your API call.

async def call_invoices():
	await get_invoices()
If you prefer to add more API endpoints to your data:
- Repeat steps four to six of the “Managing MySQL Databases with DBeaver“ section.
- Repeat all steps under the “Getting and Consuming API Data” section.
- Change the API endpoint to another one you wish to consume.
Synchronizing API Endpoints
You now have a database and API connection, and you’re ready to start the API consumption by running the code in the invoices.py file. But doing so would limit you to consuming one API endpoint simultaneously.
How to go beyond the limit? You’ll create another Python file as a central file that calls API functions from various Python files and runs the functions asynchronous using AsyncIO. This way, you keep your programming clean and allow you to bundle multiple functions together.
1. Create a new Python file called central.py and add the code below.
Similar to the invoices.py file, you’ll add code snippets to the central.py file on each step, but you can view the complete code on ATA’s GitHub.
The code below imports essential modules, and scripts from other files using the from <filename> import <function name> syntax.
from datetime import datetime
from numpy import product
# Importing the invoice fetching API function from invoices.py
from invoices import call_invoices
import asyncio
import time
import schedule
from apscheduler.schedulers.asyncio import AsyncIOScheduler
from datetime import datetime
import os
2. Next, add the following code to control the scripts from invoices.py in the central.py file.
You need to reference/call the call_invoices function from invoices.py to an AsyncIO task (invoice_task) in central.py.
# Creating the main function
async def chain():
	def _handle_task_result(task: asyncio.Task) -> None:
		try:
				task.result()
		except asyncio.CancelledError:
				pass
		except Exception:
				logging.exception('Exception raised by task %r',task)
	start = time.perf_counter()
	# Creating task for the imported function from invoices.py
	invoice_task = asyncio.create_task(call_invoices())
3. After creating the AsyncIO task, await the task to fetch and execute the call_invoices function from invoice.py once the chain function (in step two) starts running.
	# Awaiting the task created
	await invoice_task
	# Keeping track of the task's times
	end = time.perf_counter()-start
	l_time =  time.localtime()
	human_time = time.asctime(l_time)
	print (f"chained result took {end:0.2f} seconds")
	print(f"Current time is {human_time}")
4. Create an AsyncIOScheduler to schedule a job for the script to perform. The job added in this code runs the chain function in one-second intervals.
This job is important to ensure your program keeps running your scripts to keep your data up to date.
if name == "main":
# Scheduler enables the code to loop forever and take sleep breaks between the loops.
    scheduler = AsyncIOScheduler()
scheduler.add_job(chain,'interval',seconds=1)
scheduler.start()
print('Press Ctrl+{0} to exit'.format('Break' if os.name == 'nt' else 'C'))

try:
	asyncio.get_event_loop().run_forever()
except (KeyboardInterrupt,SystemExit):
    pass
5. Lastly, run the central.py script on VS Code, as shown below.
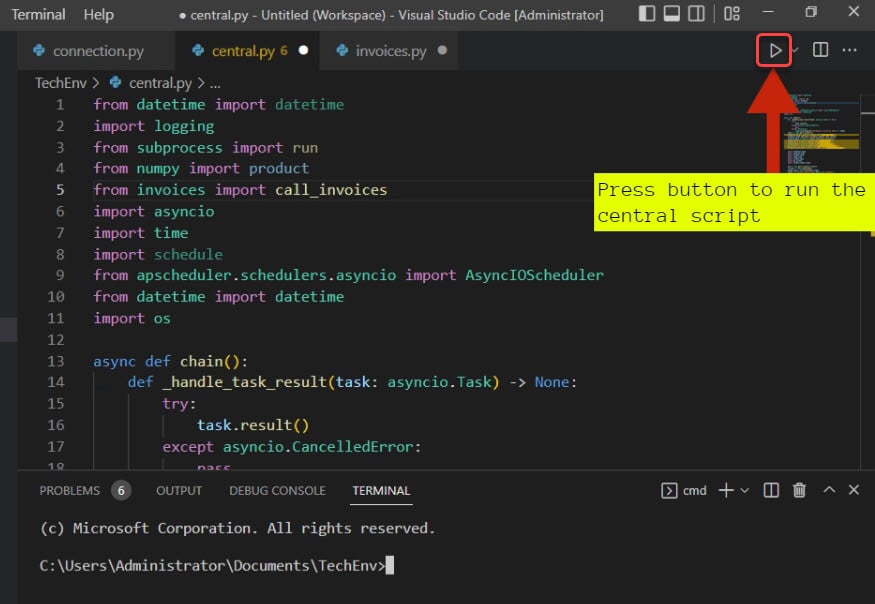
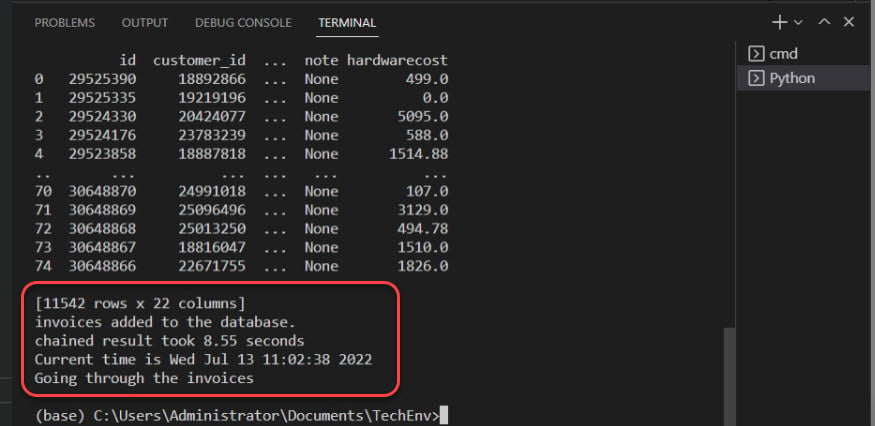
After running the script, you’ll see the output on the terminal like the one below.
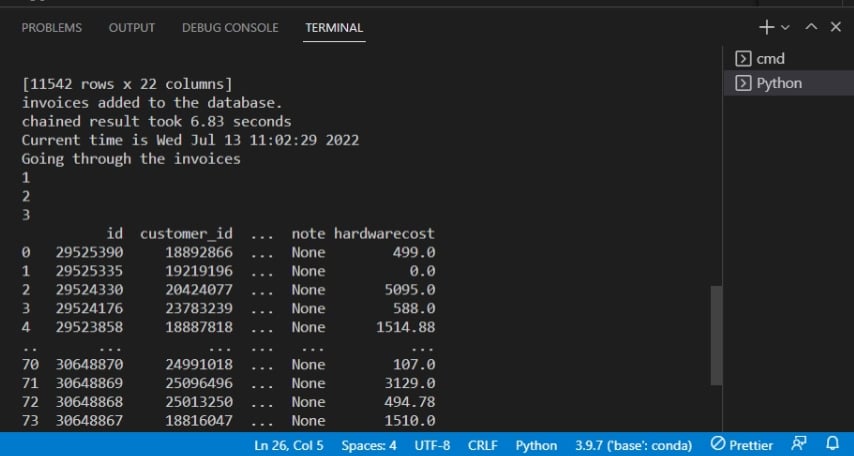
Below, the output confirms invoices are added to the database.
Developing Power BI Visuals
After coding a program that connects to and consumes API data and pushes this data to a database, you’re almost ready to reap your data. But first, you’ll push the data in the database to Power BI for visualization, the endgame.
Plenty of data is useless if you cannot visualize data and make deep connections. Luckily, Power BI visuals are like how graphs can make complicated mathematics equations seem simple and predictable.
1. Open Power BI from your Desktop or Start menu.
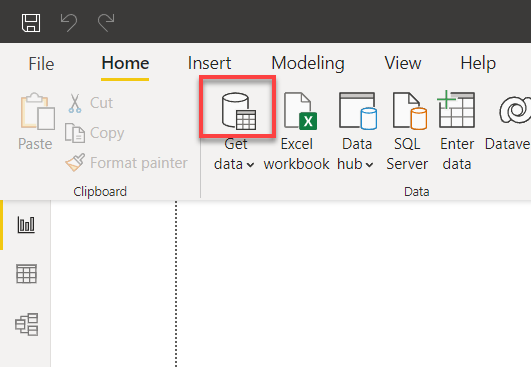
2. Click the data source icon above the Get data dropdown on Power BI’s main window. A pop-up window appears where you can select the data source to use (step three).
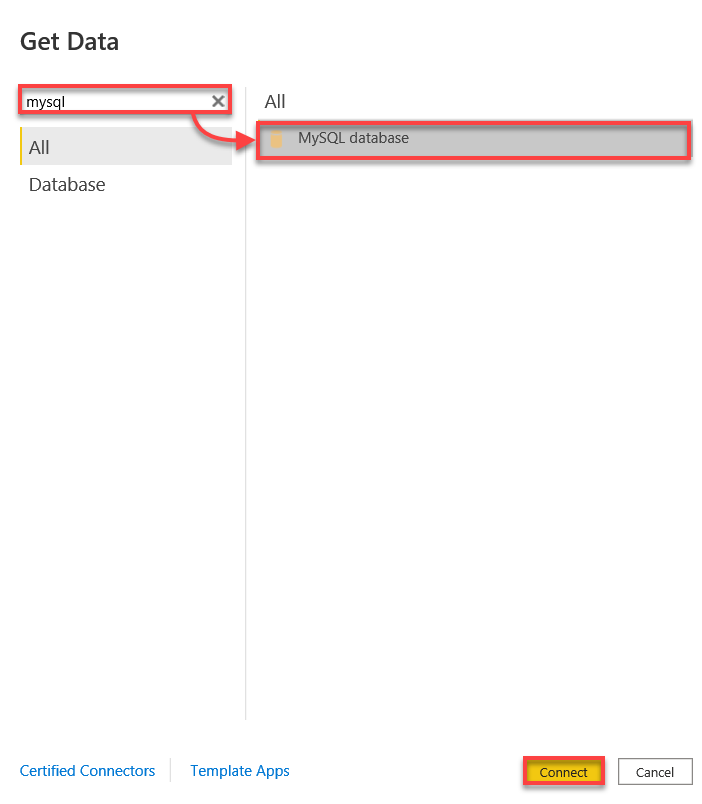
3. Search for mysql, select MySQL database, and click on Connect to initiate connecting to your MySQL database.
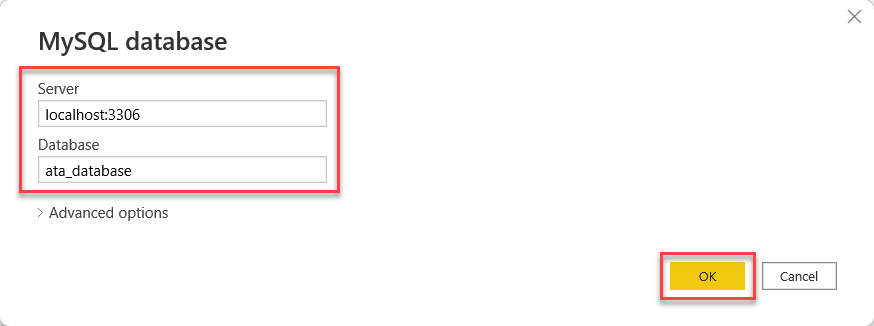
4. Now, connect to your MySQL database with the following:
- Input localhost:3306 since you’re connecting to your local MySQL server on port 3306.
- Provide the name of your database, in this case, ata_db.
- Click OK to connect to your MySQL database.
5. Now, click on Transform Data (bottom-right) to see the data overview in Power BI’s Query editor (step five).
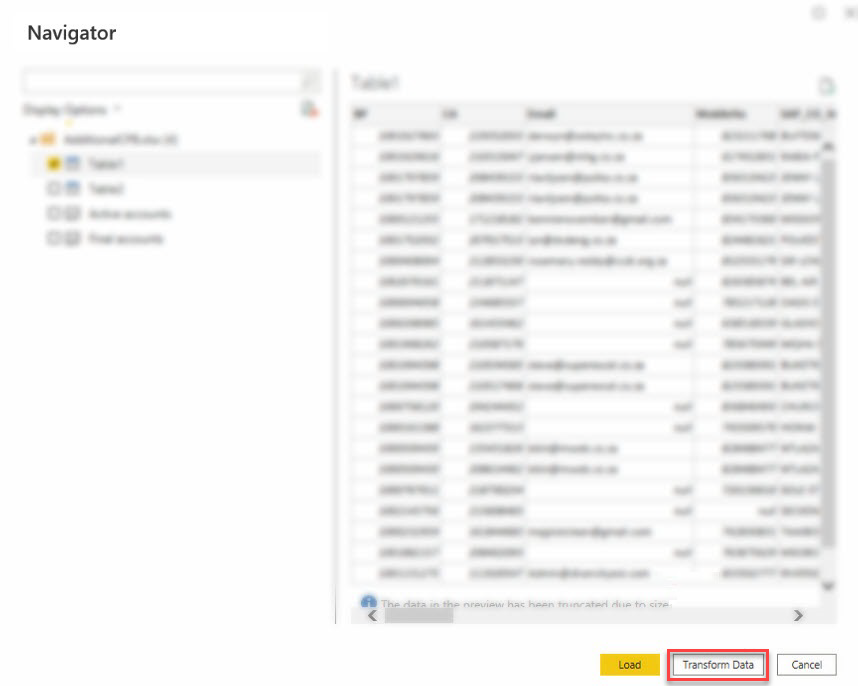
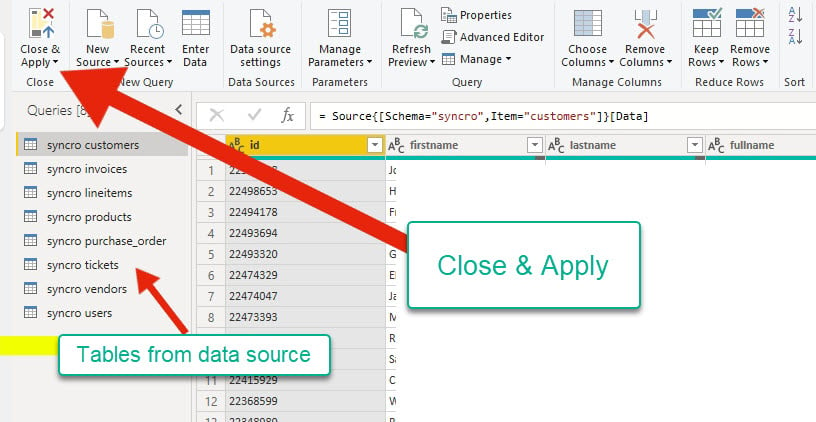
6. After previewing the data source, click on Close & Apply to go back to the main application and confirm if any changes were applied.
The query editor shows tables from your data source on the far left. At the same time, you can check the data’s format before proceeding to the main application.
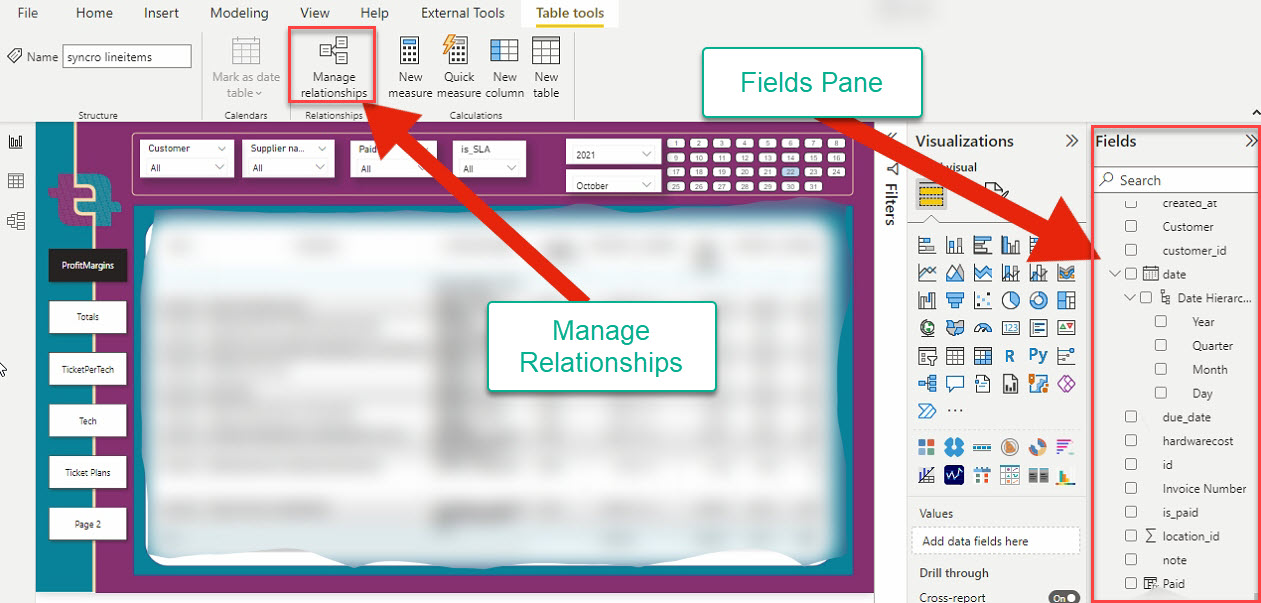
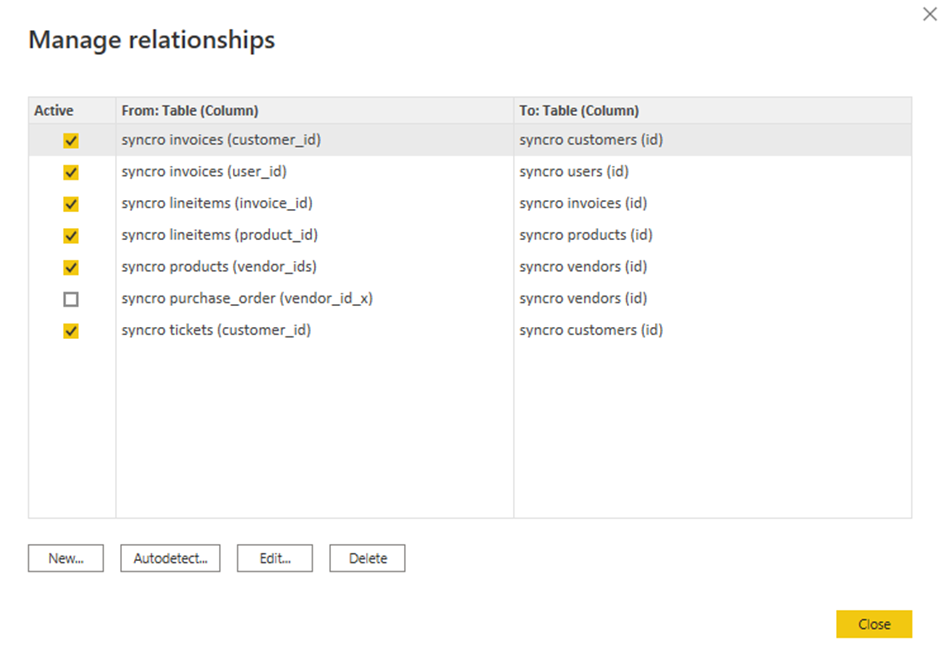
7. Click on the Table tools ribbon tab, select any table on the Fields’ Pane and click on Manage relationships to open the relationship wizard.
Before creating visuals, you must ensure your tables are related, so specify any relationship between your tables explicitly. Why? Power BI does not detect complex table correlation automatically yet.
8. Tick on the boxes of existing relationships to edit, and click on Edit. A pop-up window appears, where you can edit the selected relationships (step nine).
But if you prefer to add a new relationship, click on New instead.
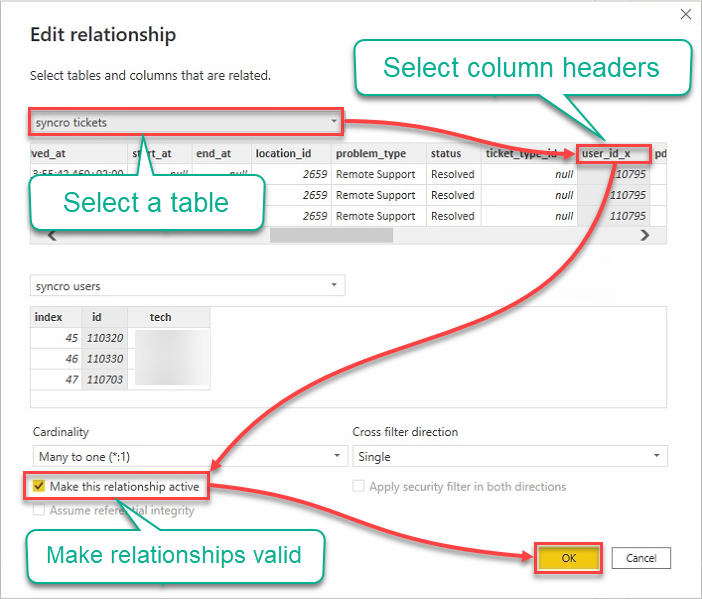
9. Edit relationships with the following:
- Click the tables dropdown field, and select a table.
- Click on headers to select columns to be used.
- Tick on the Make this relationship active box to ensure the relationships are valid.
- Click OK to establish the relationship and close the Edit relationship window.
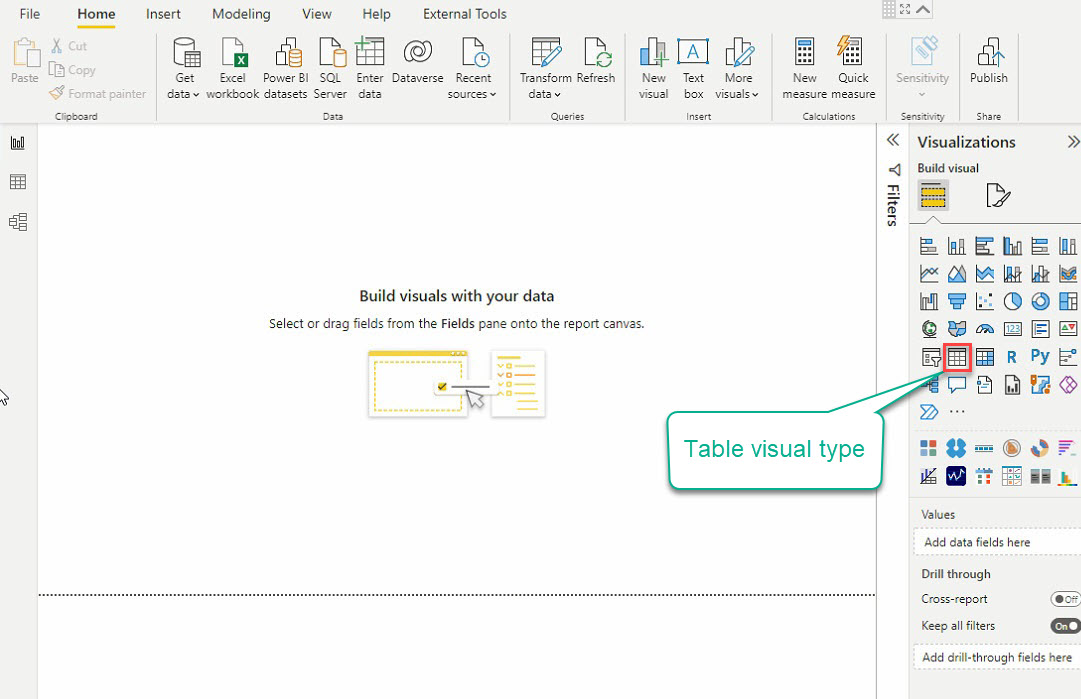
10. Now, click on the Table visual type under the Visualizations pane (right-most) to create your first visual, and an empty table visual appears (step 11).
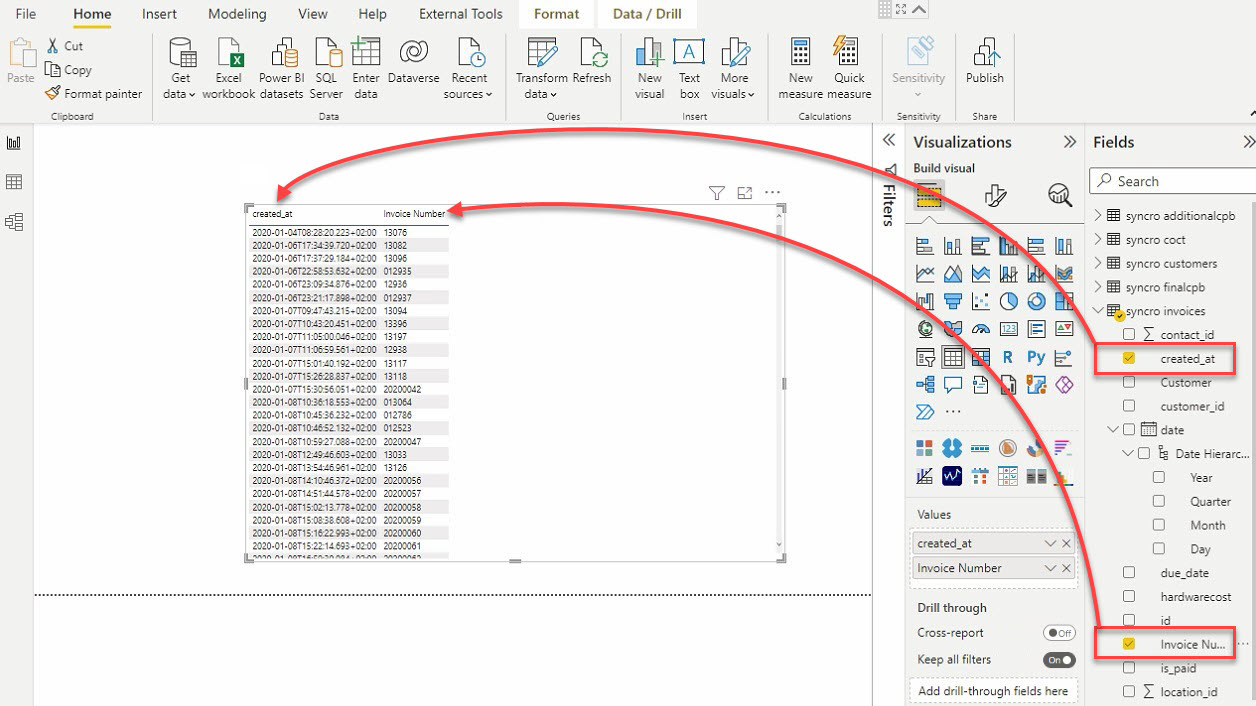
11. Select the table visual and the data fields (on the Fields pane) to add to your table visual, as shown below.
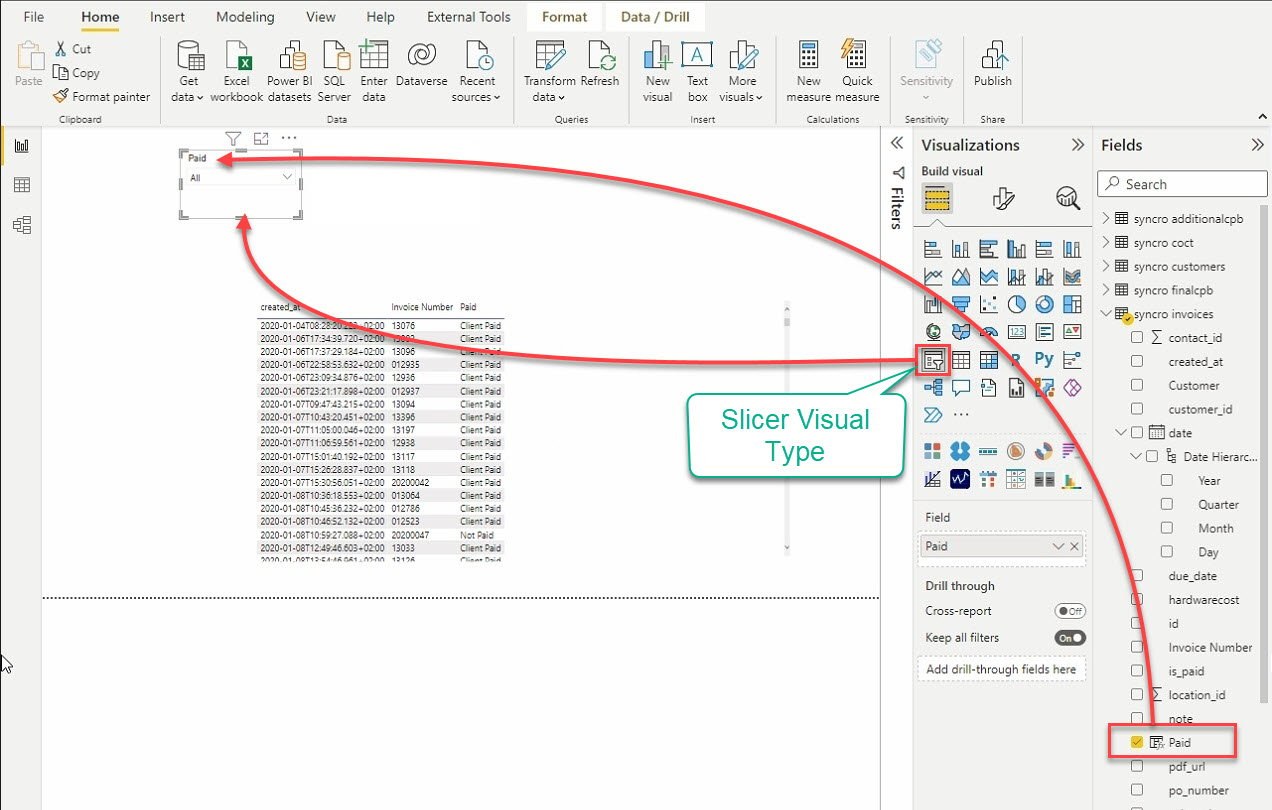
12. Finally, click on the Slicer visual type to add another visual. As the name suggests, the slicer visual slices data by filtering other visuals.
After adding the slicer, select data from the Fields pane to add to the slicer visual.
Changing Visualizations
The default looks of the visuals are pretty decent. But wouldn’t it be great if you could change the visuals look to something not so bland? Let Power BI do the trick.
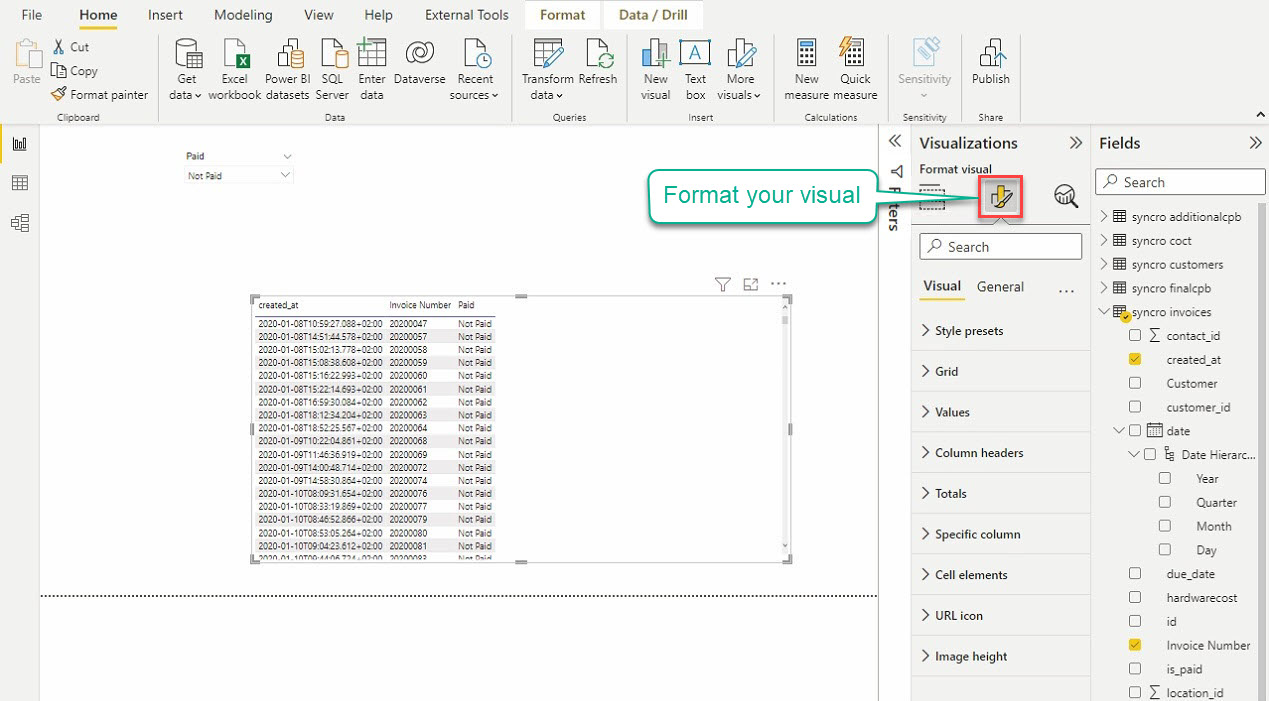
Click on the Format your visual icon under visualization to access the visualization editor, as shown below.
Spend some time playing with the visualization settings to get your desired look for your visuals. Your visuals will correlate as long as you establish a relationship between the tables you involve in your visuals.
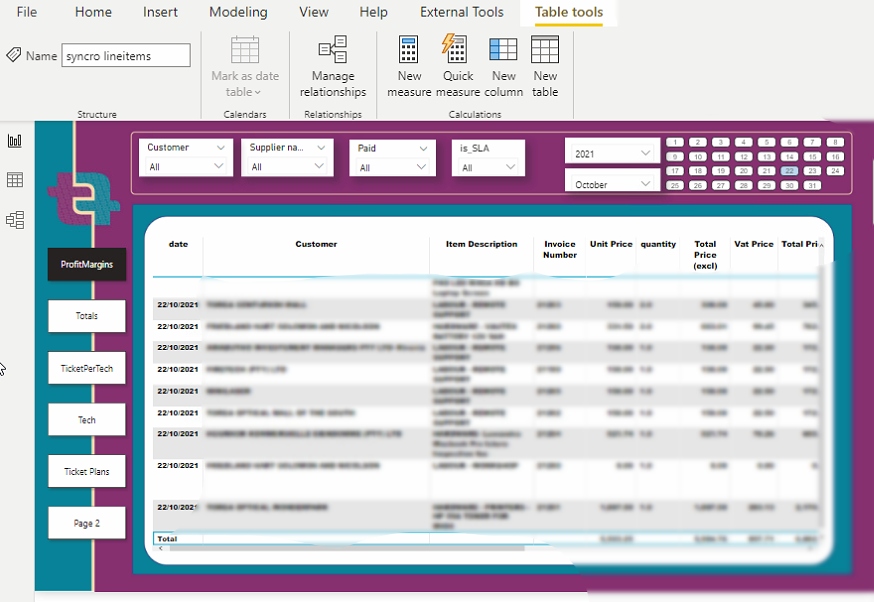
After changing the visualization settings, you can pull reports like the ones below.
Now, you can visualize and analyze your data without complexity or hurting your eyes.
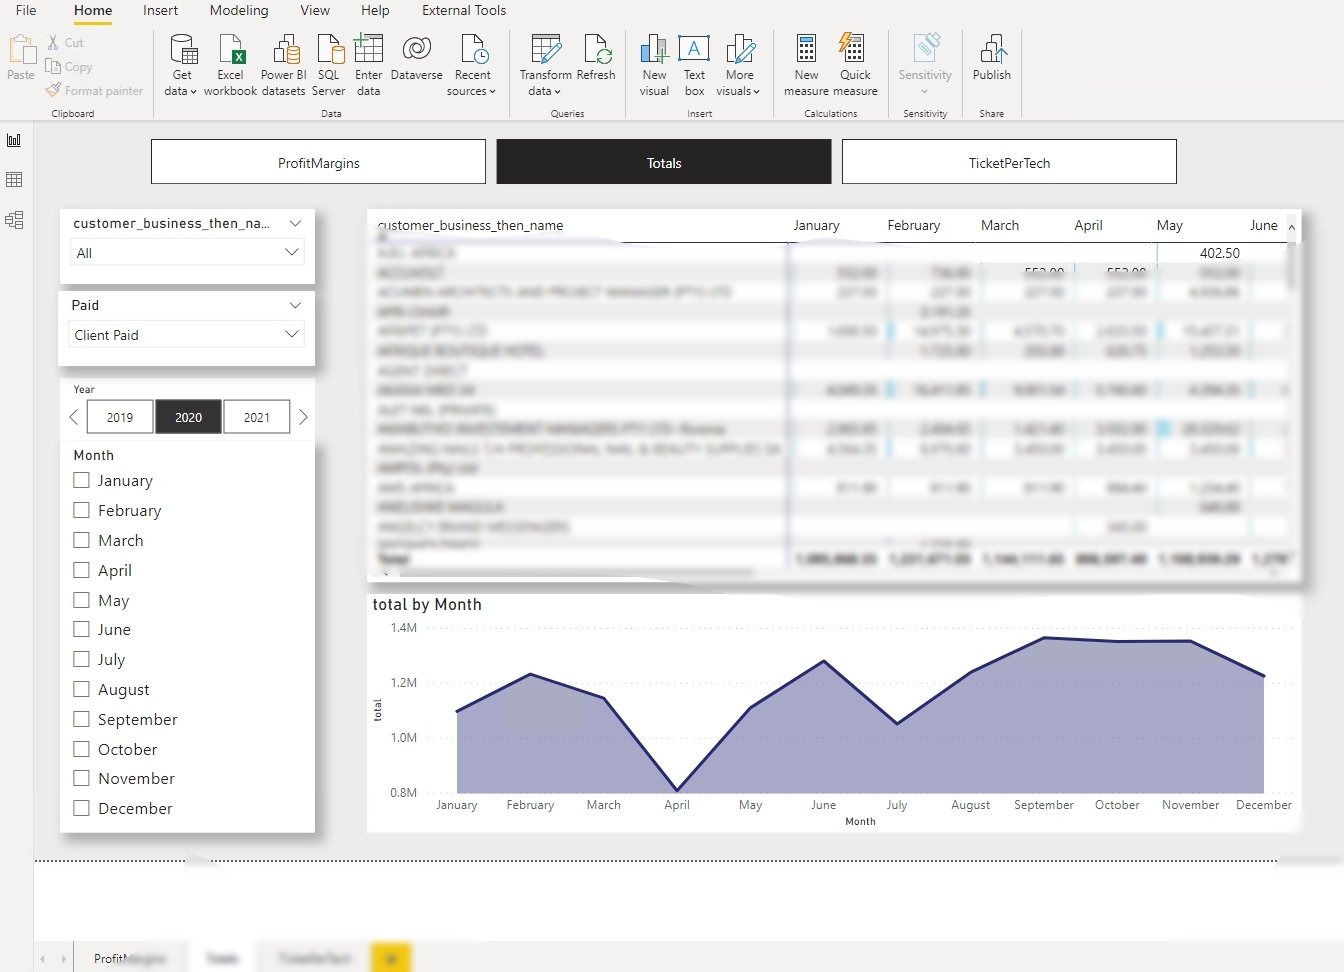
In the following visualization, looking at the trends graph, you’ll see that something went wrong in April 2020. That time was when Covid-19 lockdowns initially hit South Africa.
This output only proves Power BI’s prowess in providing spot-on data visualizations.
Conclusion
This tutorial aims to show you how to establish a live dynamic data pipeline by fetching your data from API endpoints. Additionally, processing and pushing data to your database and Power BI using Python. With this newfound knowledge, you can now consume API data and create your own data visualizations.
More and more businesses are creating Restful API web apps. And at this point, you’re now confident with consuming APIs using Python and making data visuals with Power BI, which can help influence business decisions.


