


NGINX logging is often overlooked as a critical part of the web service and is commonly referenced only when an error occurs. But it’s important to understand from the beginning how to configure NGINX logs and what information is considered most important.
Within NGINX there are two types of logs available, the error log and the access log. How then would you configure the error and access logs and in what format should be used? Read on to learn all about how NGINX logging works!
Prerequisites
To follow along with this tutorial, it is necessary to have a recent working NGINX installation, ideally version 1.21.1 or higher. In this tutorial, Ubuntu is used to host the NGINX installation. To view formatted JSON log file output in the terminal you may want to install the jq utility
Learning the NGINX Logging System
The NGINX logging system has quite a few moving parts. Logging is made up of log formats (how logs are stored) and an NGNIX configuration file (nginx.conf) to enable and tune how logs are generated.
First, let’s cover the NGINX configuration file. An NGNIX configuration file defines a hierarchy of sections that are referred to as contexts within the NGINX documentation. These contexts are made up of a combination of the following, although not all available contexts are listed below.
- The “main” context is the root of the nginx.conf file
- The
httpcontext - Multiple
servercontexts - Multiple
locationcontexts
Inside one or more of these contexts is where you can define access_log and error_log configuration items, or directives. A logging directive defines how NGINX is supposed to record logs under each context.
NGINX Logs Logging Directive Structure
Logging directives are defined under each context with the log name, the location to store the log, and the level of log data to store.
<log name> <log location> <logging level>;- Log Location – You can store logs in three different areas; a file e.g.
/var/log/nginx/error.log, syslog e.g.syslog:server=unix:/var/log/nginx.sockor cyclic memory buffer e.g.memory:32m. - Logging Levels – The available levels are
debug,info,notice,warn,error,crit,alert, oremergwith the default beingerror. Thedebuglevel may not be available unless NGINX was compiled with the--with-debugflag.
Allowed Logging Directive Contexts
Both the error_log and access_log directives are allowed in only certain contexts. error_log is allowed in the main, http, mail, stream, server, and location contexts. While the access_log directive is allowed in http, server, location, if in location, and limit_exept contexts.
Logging directives override higher-up directives. For example, the
error_logdirective specified in alocationcontext will override the same directive specified in thehttpcontext.
You can see an example configuration below that contains various defined directives below.
# Log to a file on disk with all errors of the level warn and higher
error_log /var/log/nginx/error.log warn;

http {
  access_log /var/log/nginx/access.log combined;

  server {
		access_log /var/log/nginx/domain1.access.log combined;

		location {
			# Log to a local syslog server as a local7 facility, tagged as nginx, and with the level of notice and higher
		error_log syslog:server=unix:/var/log/nginx.sock,facility=local7,tag=nginx notice;
		}
  }

  server {
		access_log /var/log/nginx/domain2.access.log combined;

		location {
			# Log all info and higher error messages directly into memory, but max out at 32 Mb
			error_log memory:32m info;
		}
  }
}
Log Formats and the Access Log Directive
Beyond just NGINX error logs, each access request to NGINX is logged. An access request could be anything from requesting a web page to a specific image. As you might surmise, there is a lot of data that can be included in the logged requests.
To record general NGINX request activity, NGNIX relies on access logs using the access_log directive. Unlike the error_log directive which has a standard format, you can configure NGINX access logs to store in a particular format.
The Default access_log Log Format
NGNIX can record access log data in many different ways through log formats. By default, that log format is called combined. When you don’t specify a log format in the NGINX configuration file, NGNIX will log all requested according to the following schema.
'$remote_addr - $remote_user [$time_local] '
'"$request" $status $body_bytes_sent '
'"$http_referer" "$http_user_agent"'
Below, you can see an example of the combined format in practice.
127.0.0.1 - - [10/Oct/2020:15:10:20 -0600] "HEAD / HTTP/1.1" 200 0 "<https://example.com>" "Mozilla/5.0..."Defining Custom access_log Formats via log_format Directive
The default combined NGINX log format may work perfectly well for your needs, but what if you would like to add additional data, such as upstream service information, or use this in JSON format instead? You’ll need to define a custom log format using the log_format directive.
The log_format directive allows you to define multiple different access_log formats to be used across the various contexts in the configuration file.
An example of defining a log format is below which specifies many different fields and variables. This example defines a JSON logging format, you may choose to display various fields.
Check out all available variables via the NGINX documentation.
The json text displayed after the log_format directive is merely the name that is referenced by any access_log directive that wishes to use this format. By using log_format, multiple logging output formats may be defined and used by any combination of access_log directives throughout the NGINX configuration file.
log_format json escape=json '{ "time": "$time_iso8601", '
	'"remote_addr": "$remote_addr", '
	'"remote_user": "$remote_user", '
	'"ssl_protocol_cipher": "$ssl_protocol/$ssl_cipher", '
	'"body_bytes_sent": "$body_bytes_sent", '
	'"request_time": "$request_time", '
	'"status": "$status", '
	'"request": "$request", '
	'"request_method": "$request_method", '
	'"http_referrer": "$http_referer", '
	'"http_x_forwarded_for": "$http_x_forwarded_for", '
	'"http_cf_ray": "$http_cf_ray", '
	'"host": "$host", '
	'"server_name": "$server_name", '
	'"upstream_address": "$upstream_addr", '
	'"upstream_status": "$upstream_status", '
	'"upstream_response_time": "$upstream_response_time", '
	'"upstream_response_length": "$upstream_response_length", '
	'"upstream_cache_status": "$upstream_cache_status", '
	'"http_user_agent": "$http_user_agent" }';
The
log_formatmay only be used in thehttpcontext, but referenced by anyaccess_logdirective regardless of location.
Escaping Log Output
When you define log format via JSON, for example, you’ll sometimes need to escape variables defined in JSON to be treated as literal elements in the NGNIX configuration file. To do that, you can use various escape formats such as default, json, and none. If the escape command is omitted, the default format is used.
default– Double-quotes, “\”, and all characters with ISO values less than 32 and greater than 126 will be escaped as “\x##”. If no variable value is found, then a hyphen (-) will be logged.json– All disallowed characters in the JSON string format will be escaped.none– All escaping of values is disabled.
You’ll see a great example of NGNIX escaping all JSON variables in the example above using the json escape format (escape=json).
Configuring access_log Directives
For NGNIX to become recording access activity using the fancy log format you defined earlier, you must enable it using the access_log directive
Once you’ve defined the log format, you must enable the log inside of the NGINX configuration file much like the error_log directive.
An example of a typical access_log directive is shown below where it sends access logs in the json log_format, as previously defined, and to a file (/var/log/nginx/access.log). Then the special off parameter disables access logging in a specific context where the directive is included.
access_log /var/log/nginx/domain.access.log json;
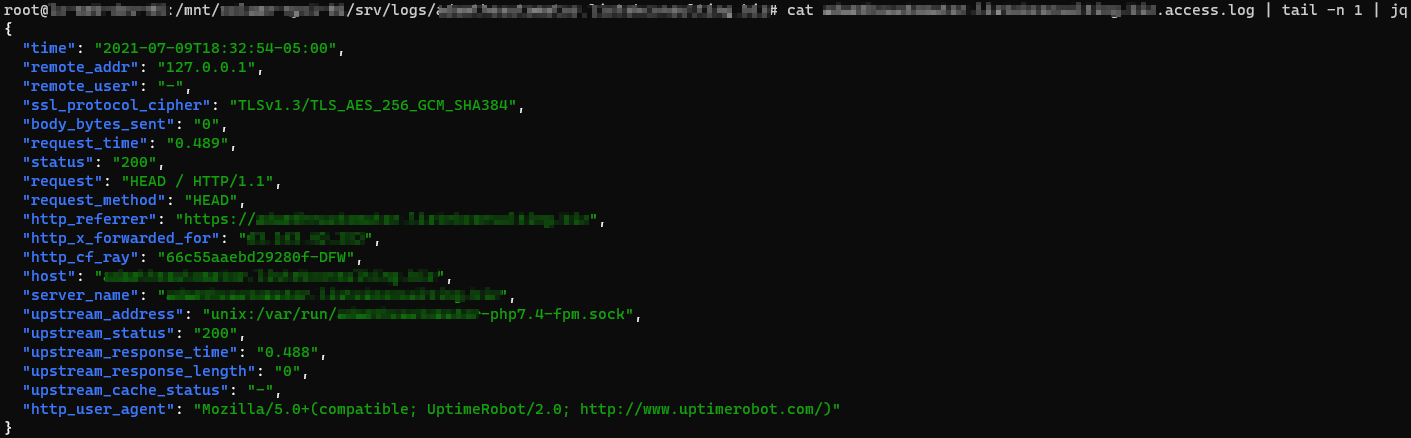
access_log off;Perhaps you have defined an access_log for a domain. How would you go about seeing the output from the below directive?
access_log /var/log/nginx/domain.access.log json;To demonstrate NGINX sending log output as defined by the access_log directive, first run the Linux cat command to grab the file contents and pipe the output to the tail command to show only a single line. Then finally, pass the single line to the jq utility to nicely format the JSON output.
cat /var/log/nginx/domain.access.log | tail -n 1 | jqLike the
error_log, both thememoryandsyslogformats work in addition to the standard file output.
Configuring NGINX to Buffer Disk Writes
Since there is typically far more information output from access logging than error logging, additional abilities for compression and buffering of the log data to disk writes are included, but enabled by default. To avoid constant disk writes and potential request blocking of the webserver while waiting for disk IO, tell NGINX to buffer disk writes.
An example of an access_log directive defining the gzip, buffer, and flush parameters is shown below.
access_log /var/log/nginx/domain.access.log gzip=7 buffer=64k flush=3m;buffer– A buffer temporarily stores data, before sending it elsewhere. The default buffer size is64kwhich you can redefine by specifying a size along with the directive, i.e.buffer=32kinstead of justbuffer.gzip– Defines a level of GZIP compression to use from1to9, with 9 being the slowest but highest level of compression. For example,gzipdefaults to1but you will set (gzip=9) the compression to the highest.
If you use
gzipbut notbuffer, you’ll buffer the writes by default. Since the nature of GZIP compression means log entries cannot be streamed to disk, disk buffering is required.
flush– To avoid holding on to in-memory logs indefinitely for infrequently accessed sites, you’ll specify aflushtime to write any logging data to disk after that time threshold is met. For example, withflush=5myou force all logged data to be written to disk, even if the buffer has not filled.
Logging Access Entries Conditionally
There are times when you will only want to log a particular access request. For example, instead of logging all requests including HTTP/200 (successful requests), perhaps you’d like to only log HTTP/404 (file not found requests). If so, you can define a logging condition in the access_log directive using the if parameter.
The if= parameter of the access_log directive looks for values passed in by the associated variable that are not “0” or an empty string to continue with logging.
As an example, perhaps you’d like to force NGNIX to only log only HTTP access requests starting with a 4 for the HTTP code.
In the NGINX configuration file:
Define a map directive to assign a variable with the value of either 0 or 1 depending n the evaluated condition. The first regular expression looks for all HTTP statuses that do not start with 4. The default condition is the fallback for all values that do not meet that requirement.
map $status $logged {
    ~^[1235] 0;
    default  1;
}
The
mapdirective must be defined at thehttpcontext level. You may use themapdirective output variable, shown below as$logged, further in the configuration file and not confined to thehttpcontext level.
Once you have defined the map directive which will assign a value of 0 or 1 to the $logged variable, you can then use this variable in conditions as shown below. Here, using the if parameter, you’re telling NGINX to only log activity to the access_404.log file if it sees a request starting with 4.
access_log /var/log/nginx/access_404.log json if=$logged;Conclusion
Now that you know how to log errors and access requests in a variety of ways, you can start monitoring your NGINX installation for issues and also for user-facing problems.
What’s next? Try taking the results of the logs and ingesting those into a SIEM application for analysis!


