If you’re a VPS (Virtual Private Server) owner and seeking a VPS monitoring tool, give Netdata a try. Netdata automatically monitors servers and applications installed on your server in real-time.
In this article, you’ll learn how to set up Netdata on the Linux server so you can monitor your system and application in real-time.
Read on to start monitoring your Linux server!
Prerequisites
This post will be a step-by-step tutorial. To follow along, be sure you have the following:
A Linux server – This tutorial uses the Ubuntu 20.04 server.
Netdata is a flexible monitoring tool that you can install on your Linux server, which detects services and monitor your system automatically — good deal, huh? But how do you set up Netdata? By running a one-line command installer script.
The main advantage of installing Netdata from the official repository is you can always get the latest version with the latest features and patches
1. Open your terminal and SSH to your server.
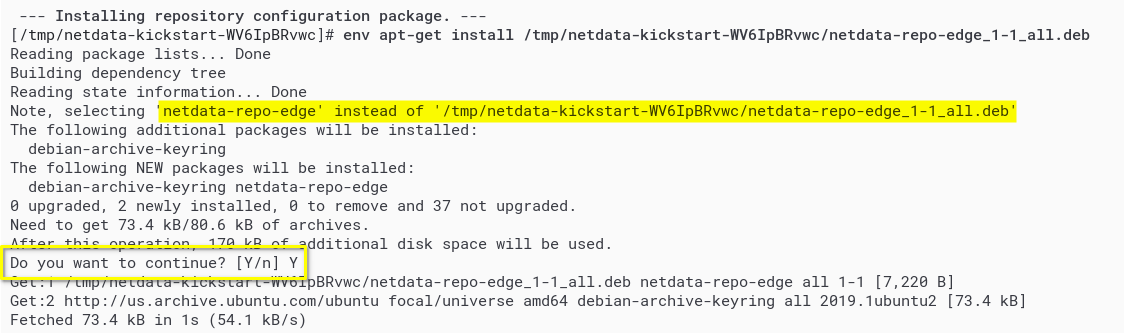
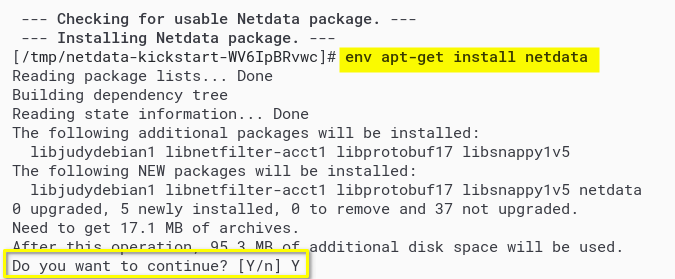
2. Next, run the below command to download and run the Netdata installer script (https://my-netdata.io/kickstart.sh) to install Netdata on your system.
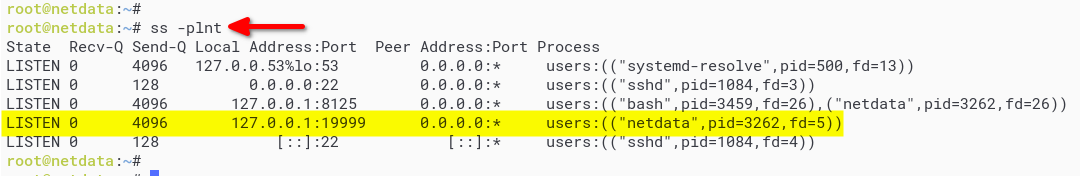
Additionally, run the below command to get the list of open ports on your Linux system.
ss -plnt
You should see that port 19999 is on the LISTEN state and is used by the netdata service.
Checking Open Ports
Setting up NGINX as a Reverse Proxy for Netdata
After installing Netdata on your Linux server, you’ll now set up NGINX as a reverse proxy for Netdata. Doing so prevents Netdata from being exposed to the internet directly, securing your Netdata installation.
If you’ve already installed NGINX on your server, you can skip the installation part (step one) and continue to the following steps. But, you may follow the Netdata Documentation if you prefer to use Apache for reverse proxy.
1. Run the apt command below to install nginx packages on your server.
sudo apt install nginx -y
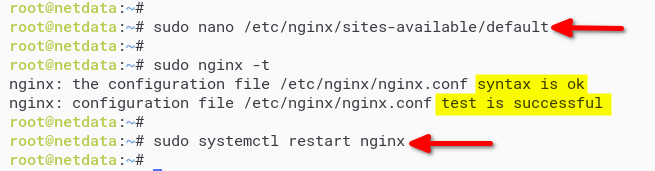
2. Next, edit the server block configuration /etc/nginx/sites-available/default using your preferred editor and populate the following configuration.
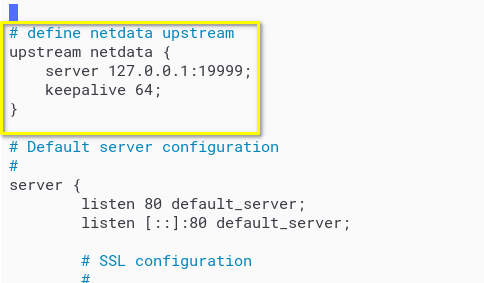
Put the upstream {..} section on top of the server {..} block. Doing so defines the netdata proxy_pass to 127.0.0.1:19999;.
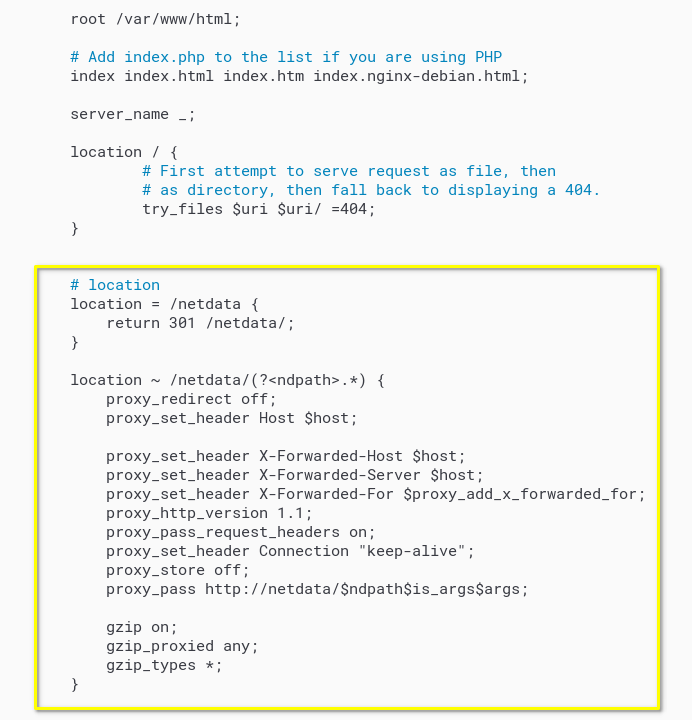
3. Now put the location {..} section inside the server {..} block configuration. This configuration makes the Netdata accessible in path URL /netdata/.
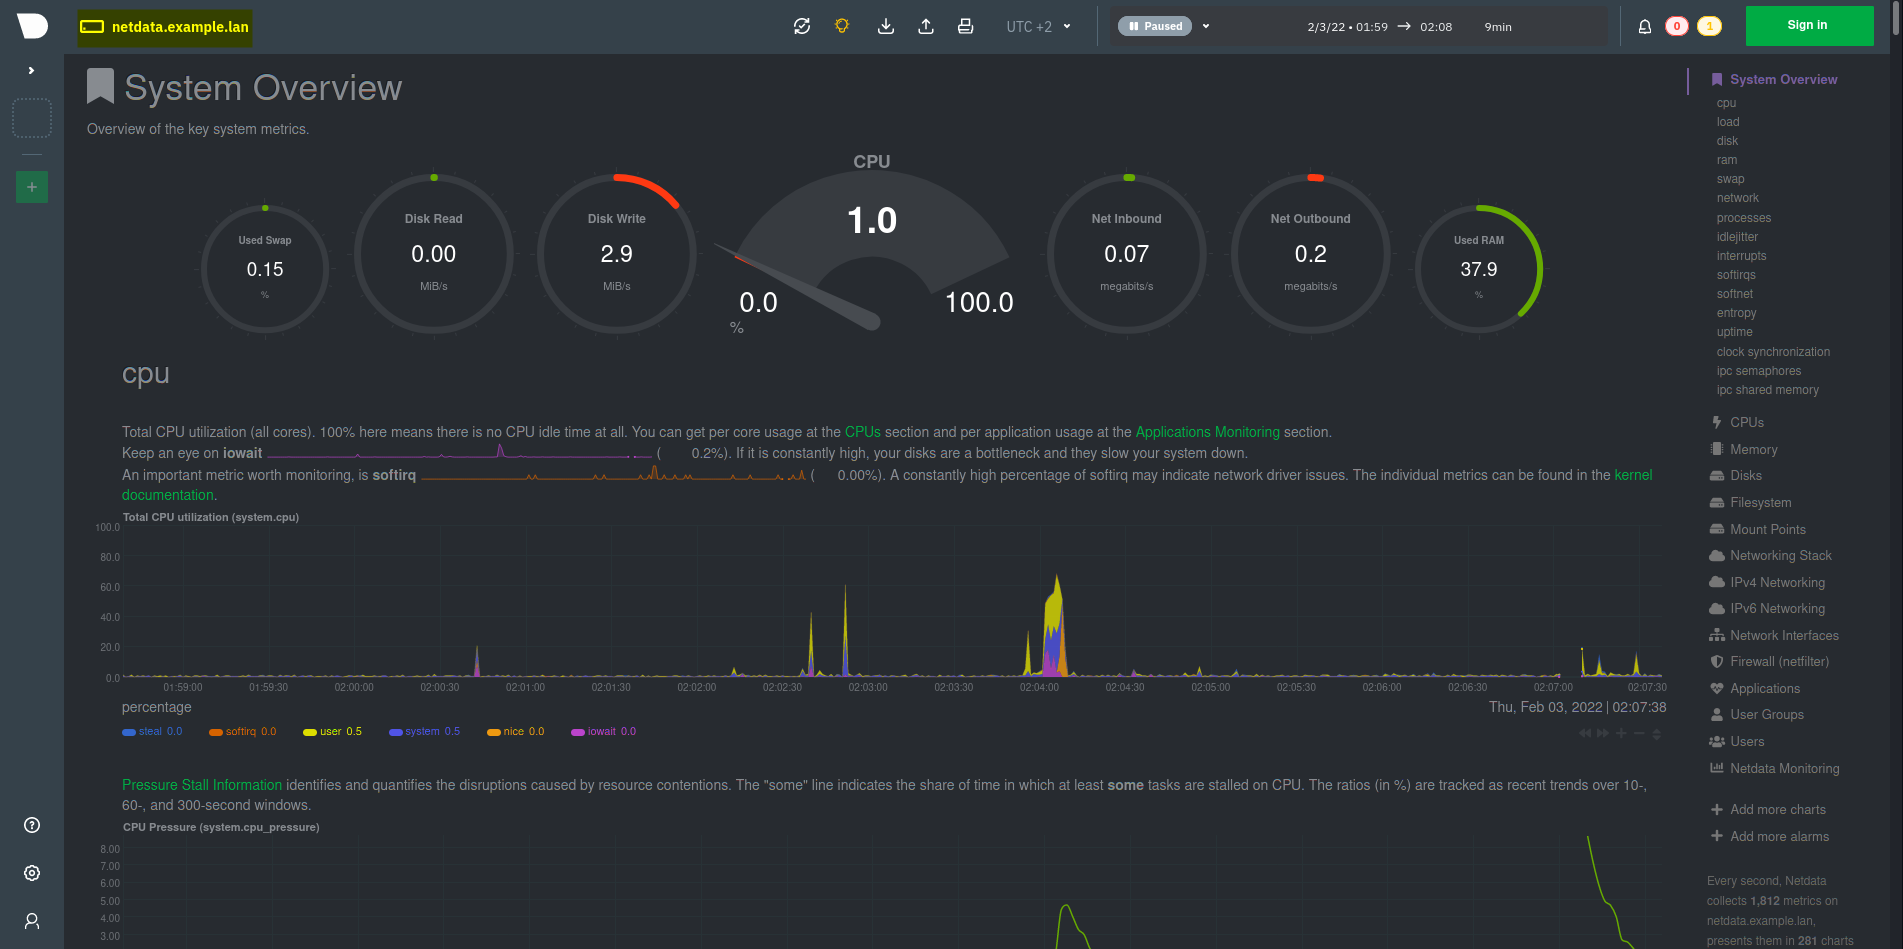
5. Lastly, open your web browser, and navigate to your server IP address followed by the path URL /netdata (i.e., http://172.16.1.20/netdata*) to access the Netdata monitoring dashboard.
Accessing the Netdata Dashboard
Setting up Slack Notification for Netdata
Apart from an informative dashboard, Netdata also supports alerting/notifications with Slack. Notification is one of the most critical aspects of monitoring as they warn you of any problem that occurs on your server.
So after you’ve configured NGINX reverse proxy, you’ll set up a notification for Netdata using Slack. Setting up Slack as a notification for Netdata allows you to organize notifications about your server in a specific channel.
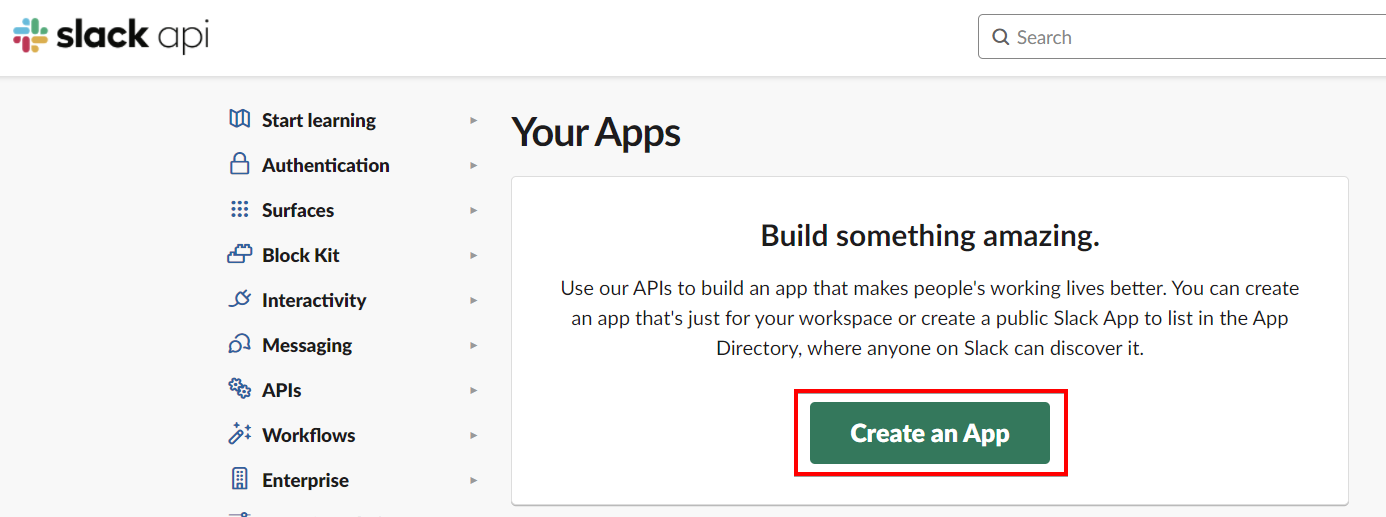
1. Navigate to Slack API on your web browser and click on Create App to choose how you want to start creating an app.
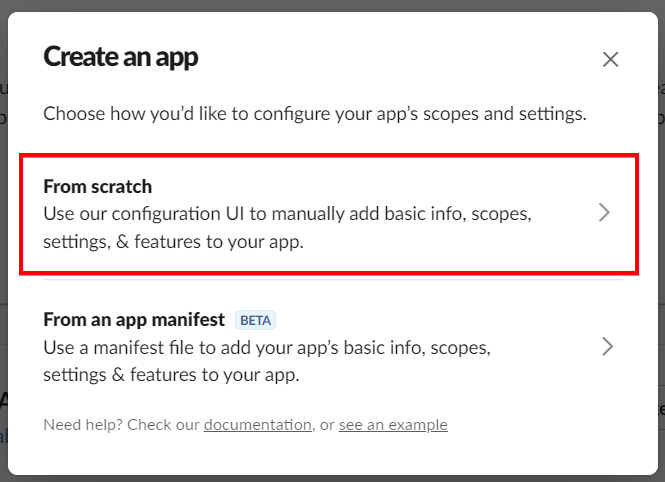
2. Next, choose the From scratch option, and a pop-up window appears where you’ll name the app and choose a workspace.
Choosing to create an app from scratch
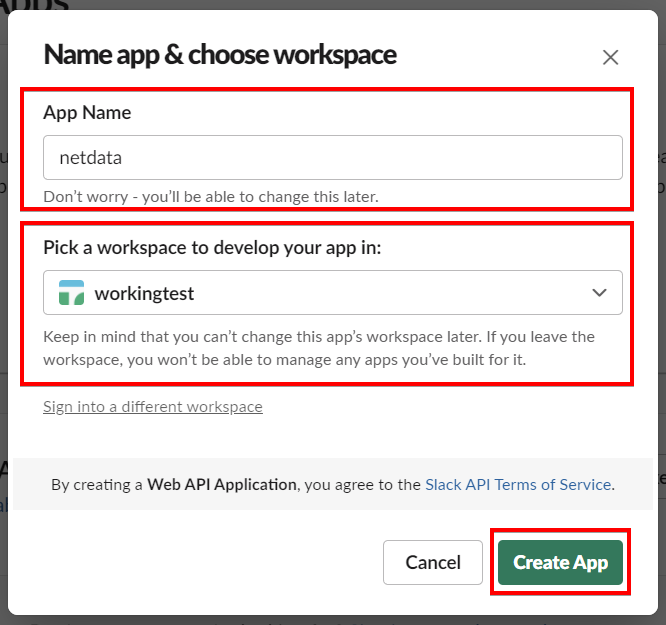
3. Enter a name for the app, select your workspace, and click on Create App to create the app.
For this demo, the app is netdata, while the workspace is set to workingtest, as shown below.
Setting Name and Workspace for the new app in Slack
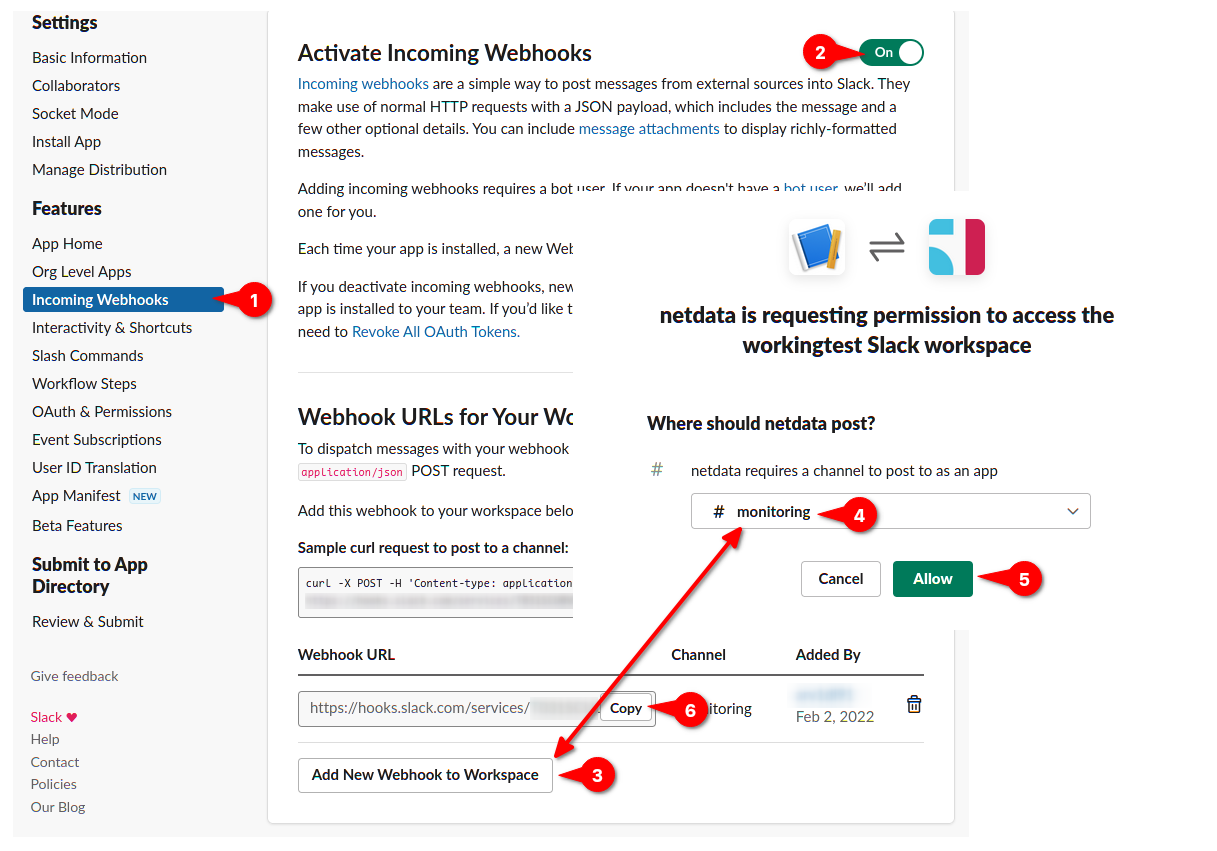
4. After creating the app, configure incoming webhooks with the following:
Click the Incoming Webhook menu under Features
Activate the webhook, then click the Add New Webhook to Workspace button. Your browser automatically redirects to a new page asking where Netdata should post notifications.
Select the channel target for notification and click Allow. This example uses the monitoring slack channel for notification.
Copy the webhook URL to your note, and you’ll use it in the next step.
Enabling and Creating Webhook
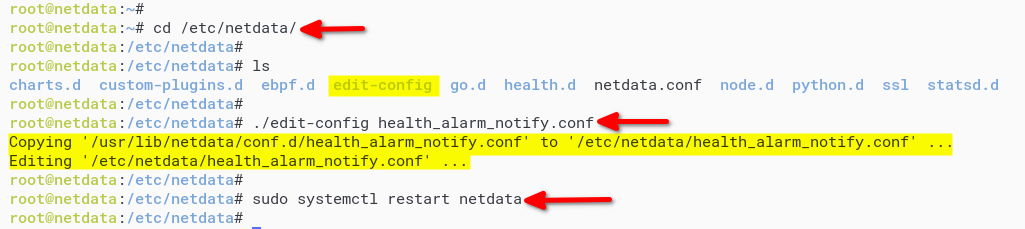
5. Now, move back to your terminal and run the commands below to create a new notification configuration named health_alarm_notify.conf using the edit-config script. The edit-config script is a helper provided by Netdata for editing its configuration.
The edit-script is available at the /etc/netdata directory. The script automatically copies configurations from the /usr/lib/netdata/conf.d directory to the target file you want to create, then opens the file with your default editor.
# Navigate to /etc/netdata
cd /etc/netdata/

# Creates notification configuration file
# Opens the config file to your default text editor
./edit-config health_alarm_notify.conf
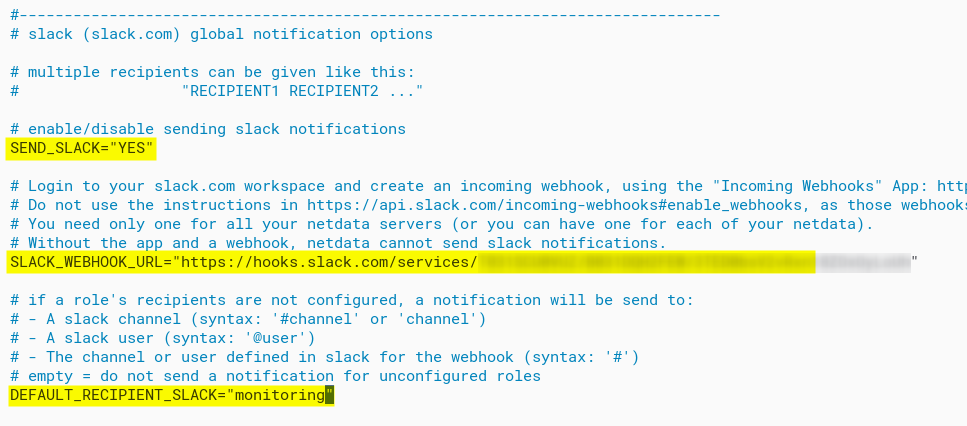
6. Configure the health_alarm_notify.conf file with the following to set the app’s notification behavior:
Ensure the SEND_SLACK option’s value is set to YES to enable slack notification.
Input your slack webhook URL you noted previously (step four) to the SLACK_WEBHOOK_URL option.
Input the channel for notification at the DEFAULT_RECIPIENT_SLACK option.
Save the changes and exit the editor.
# Enable slack notification
SEND_SLACK="YES"

# Select the slack webhook
SLACK_WEBHOOK_URL="https://hooks.slack.com/services/xxxxxxx"

# Default channel for notification
DEFAULT_RECIPIENT_SLACK="monitoring"
Setting up Slack notification for Netdata
7. Now, run the below command to restart the netdata service and apply the new configuration from the health_alarm_notify.conf file.
# Restart Netdata
sudo systemctl restart netdata
Setting up Slack Notification for Netdata and Restarting Netdata Service
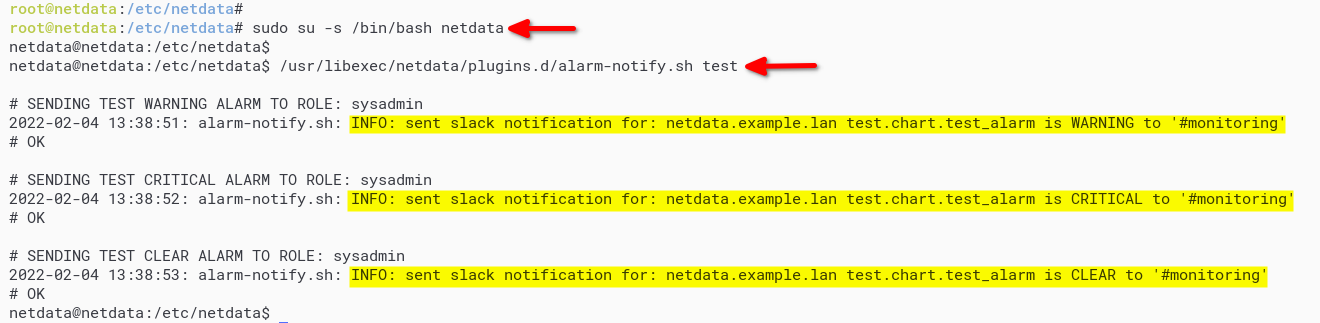
8. Lastly, run the commands below to test if the new configuration works. The alarm-notify.sh script sends a test message to the Slack channel for notification.
# Login to netdata user
sudo su -s /bin/bash netdata

# Executes alarm-notify.sh script to test notification
# The script sends a test message to the Slack channel for notification
/usr/libexec/netdata/plugins.d/alarm-notify.sh test
You’ll get an output on the terminal screen similar to the one below if your configuration works correctly.
Testing Slack Notification
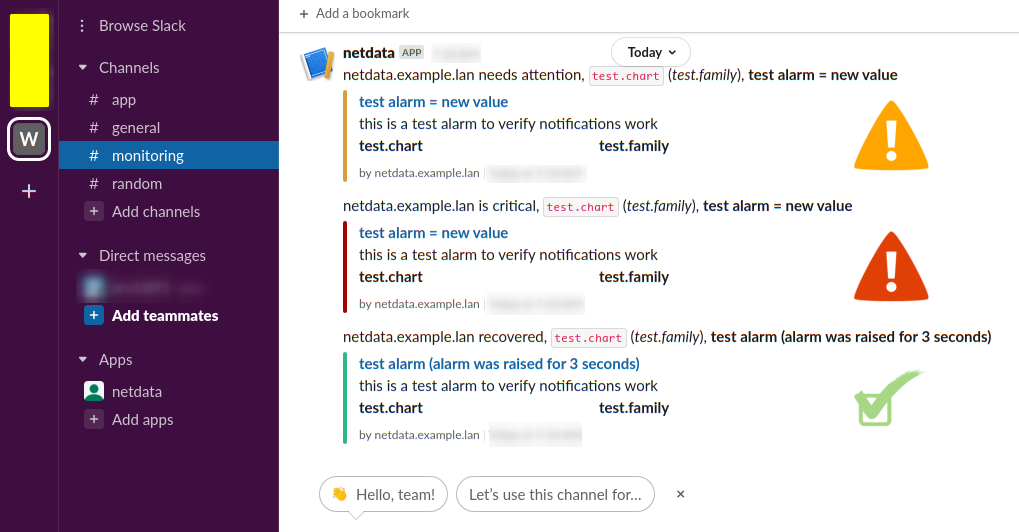
You’ll receive a message on the slack channel like in the screenshot below.
Testing Netdata notification to Slack Channel
Setting up Notifications for your Application
You’ve already configured Slack notification, but is that enough to monitor your application? Why not set up notifications for your application? For instance, setting up notifications for your application notifies you in Slack whenever CPU usage reaches a certain point.
1. Run the commands below to create a new configuration file called health.d/cpu.conf using the edit-config script.
# Navigate to /etc/netdata
cd /etc/netdata/

# Create custom CPU notification
# Copy the cpu.conf file from the /usr/lib/netdata/conf.d/health.d directory
# to your new file (health.d/cpu.conf).
./edit-config health.d/cpu.conf
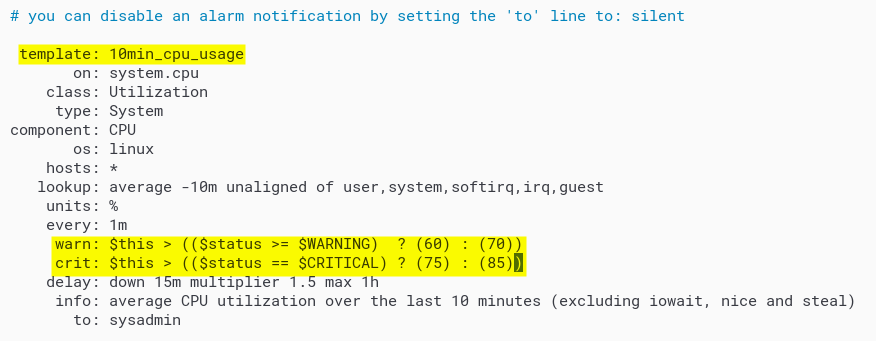
In the cpu.conf file, change the value of the warn and crit options with the following lines, save the changes and exit the editor.
With this configuration, whenever the server CPU usage is between 60% – 70% in the last 10 minutes, you’ll get the warning notification. But when the CPU usage is 75% – 85%, you’ll get the critical notification instead.
2. Next, run the below command to restart the netdata service and apply the new configuration from the cpu.conf file.
sudo systemctl restart netdata
3. Run the below command to install the stress tool, which you’ll use to test your CPU usage notification.
sudo apt install stress -y
4. Now, run the stress command below to get max usage on your CPU. Be sure to change the number (2) with your CPUs. This command lets you test if the high CPU usage notification works.
Leave this command running for two to three minutes until you get a notification on the Slack channel, then stop the command by pressing Ctrl+C.
# running cpu stressing tool
stress --cpu 2
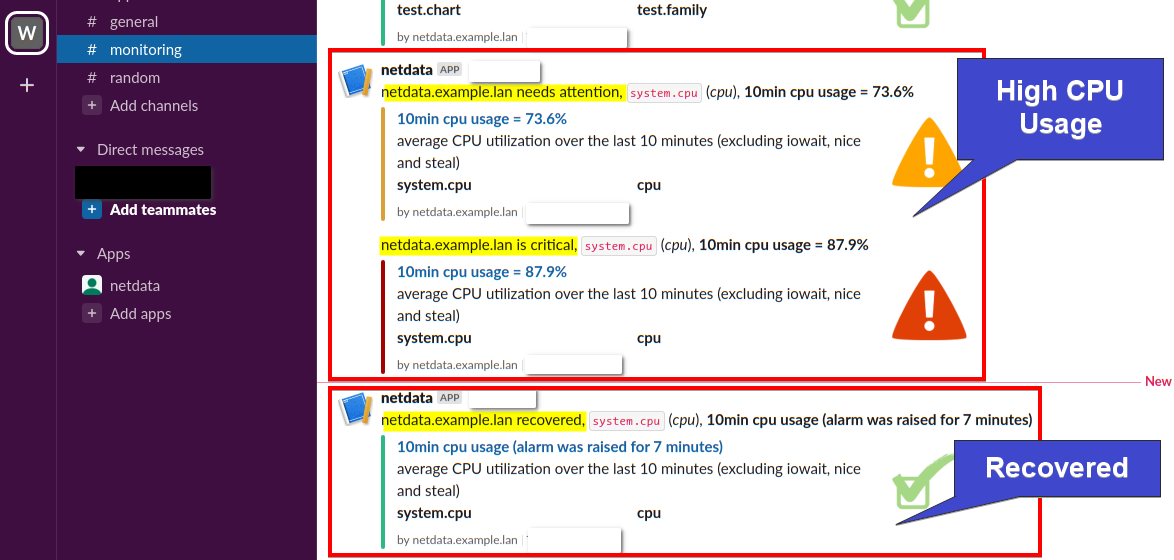
5. Lastly, check your Slack channel, and you’ll see a notification from your server about the high CPU usage. After a few minutes, you’ll get the notification that the server has recovered.
Viewing Sent Notification to Slack about High CPU Usage
Setting up Monitoring for NGINX Service
Apart from setting up a notification for CPU usage, you can also set up monitoring for the NGINX service using Netdata. You’ll set up the ngx_http_stub_status_module NGINX module, then Netdata automatically detects to monitor the NGINX service’s performance.
Netdata uses different types of plugins to monitor your system automatically. These plugins are the internal plugin to gather system metrics, the external plugins to gather non-system metrics, and the orchestrator. Some Netdata plugins are written in Go, Bash, Python, and NodeJS.
1. Open the default virtual host configuration (/etc/nginx/sites-available/default) in your preferred editor.
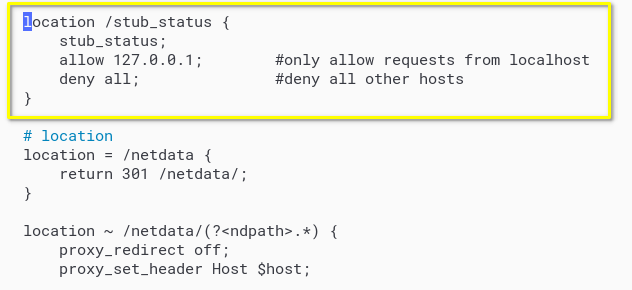
Populate the following configuration inside the server {…} section. This configuration enables ngx_http_stub_status_module and allows Netdata to gather metrics to monitor NGINX.
# Enable module stub_status
location /stub_status {
		stub_status;
    allow 127.0.0.1;        #only allow requests from localhost
    deny all;               #deny all other hosts
}
Enabling NGINX stub_status Module
2. Next, run the below commands to verify the NGINX configuration and restart the NGINX service and the netdata service.
# Verify NGINX configuration
sudo nginx -t

# Restart nginx
sudo systemctl restart nginx

# Restart Netdata
# Makes the Netdata service re-discover services on your system
# and monitor the NGINX service.
sudo systemctl restart netdata
3. Lastly, switch back to your web browser and reload the Netdata dashboard.
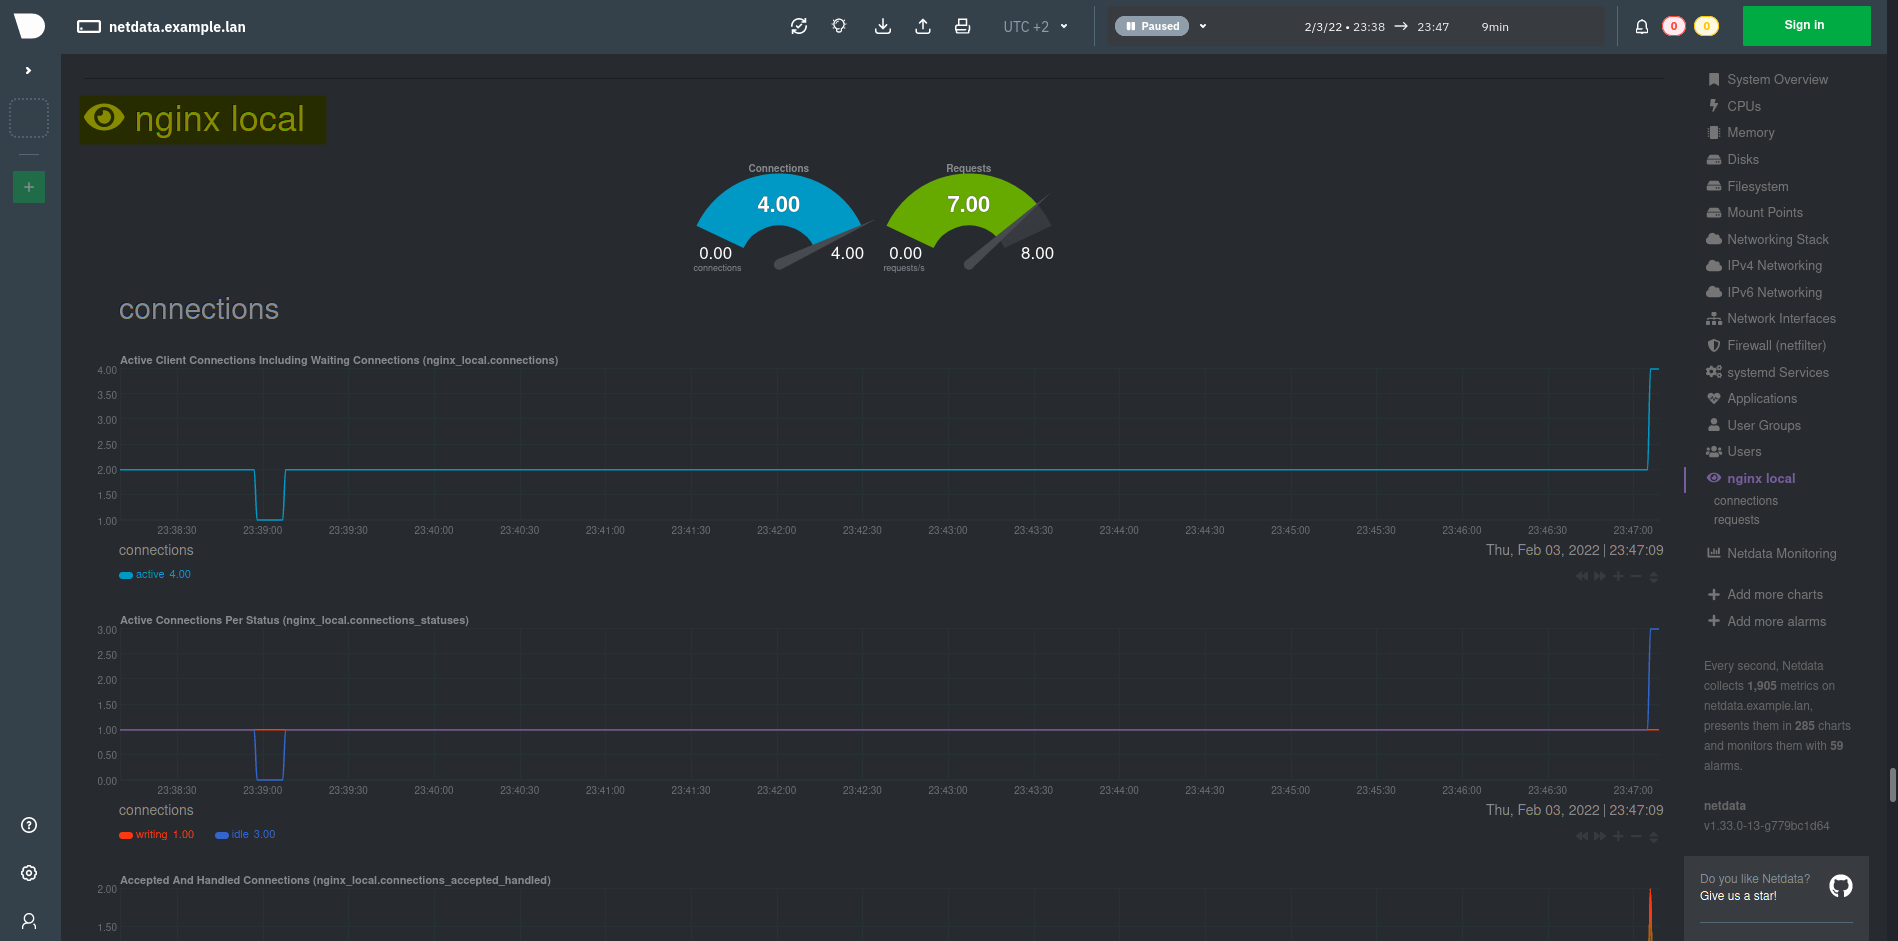
If all goes well, you’ll see the new nginx local monitoring section on the Netdata dashboard, as shown below.
Monitoring NGINX Service with Netdata
Setting up Monitoring for MariaDB Server
Databases are a vital element for applications. Measuring and monitoring the database backend allows you to get statistics about your database performance and minimize your application’s downtime. Database performance also always affects application performance, speed, and availability.
You’ll take advantage of the Netdata Python plugins to monitor the MariaDB server, but you’ll first install the mysqlclient Python driver.
1. Run the following apt command to install some packages dependencies for installing the mysqlclient Python driver.
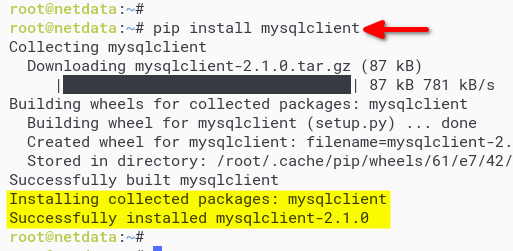
2. Next, run the pip command below to install the mysqlclient module.
pip install mysqlclient
Installing mysqlclient Module for Python
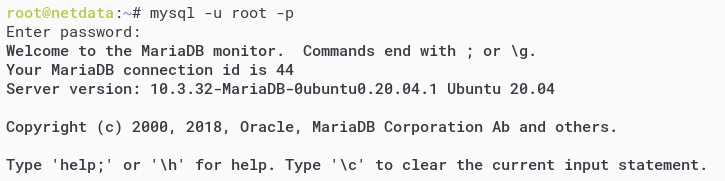
3. Run the mysql command below to log in to the MariaDB server.
mysql -u root -p
Logging in to MariaDB Server
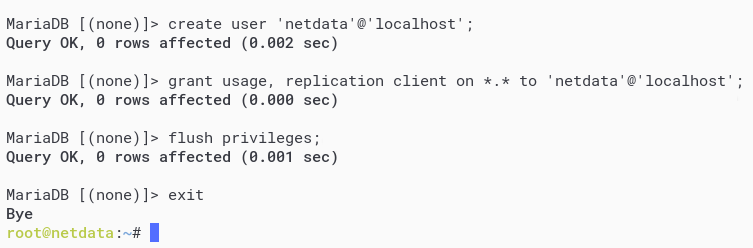
4. Execute the MariaDB queries below to create a new user netdata with permissions for monitoring the MariaDB server. After running the queries, the netdata user cannot alter any databases on the MariaDB server.
# create new MariaDB user netdata
create user 'netdata'@'localhost';

# grant permission for user netdata to collecting MariaDB statistics
grant usage, replication client on *.* to 'netdata'@'localhost';

# reload tables privileges to apply new changes
flush privileges;

# log out from MariaDB shell
exit
Creating new MariaDB user for Netdata
5. Now, run the following command to restart the netdata service.
sudo systemctl restart netdata
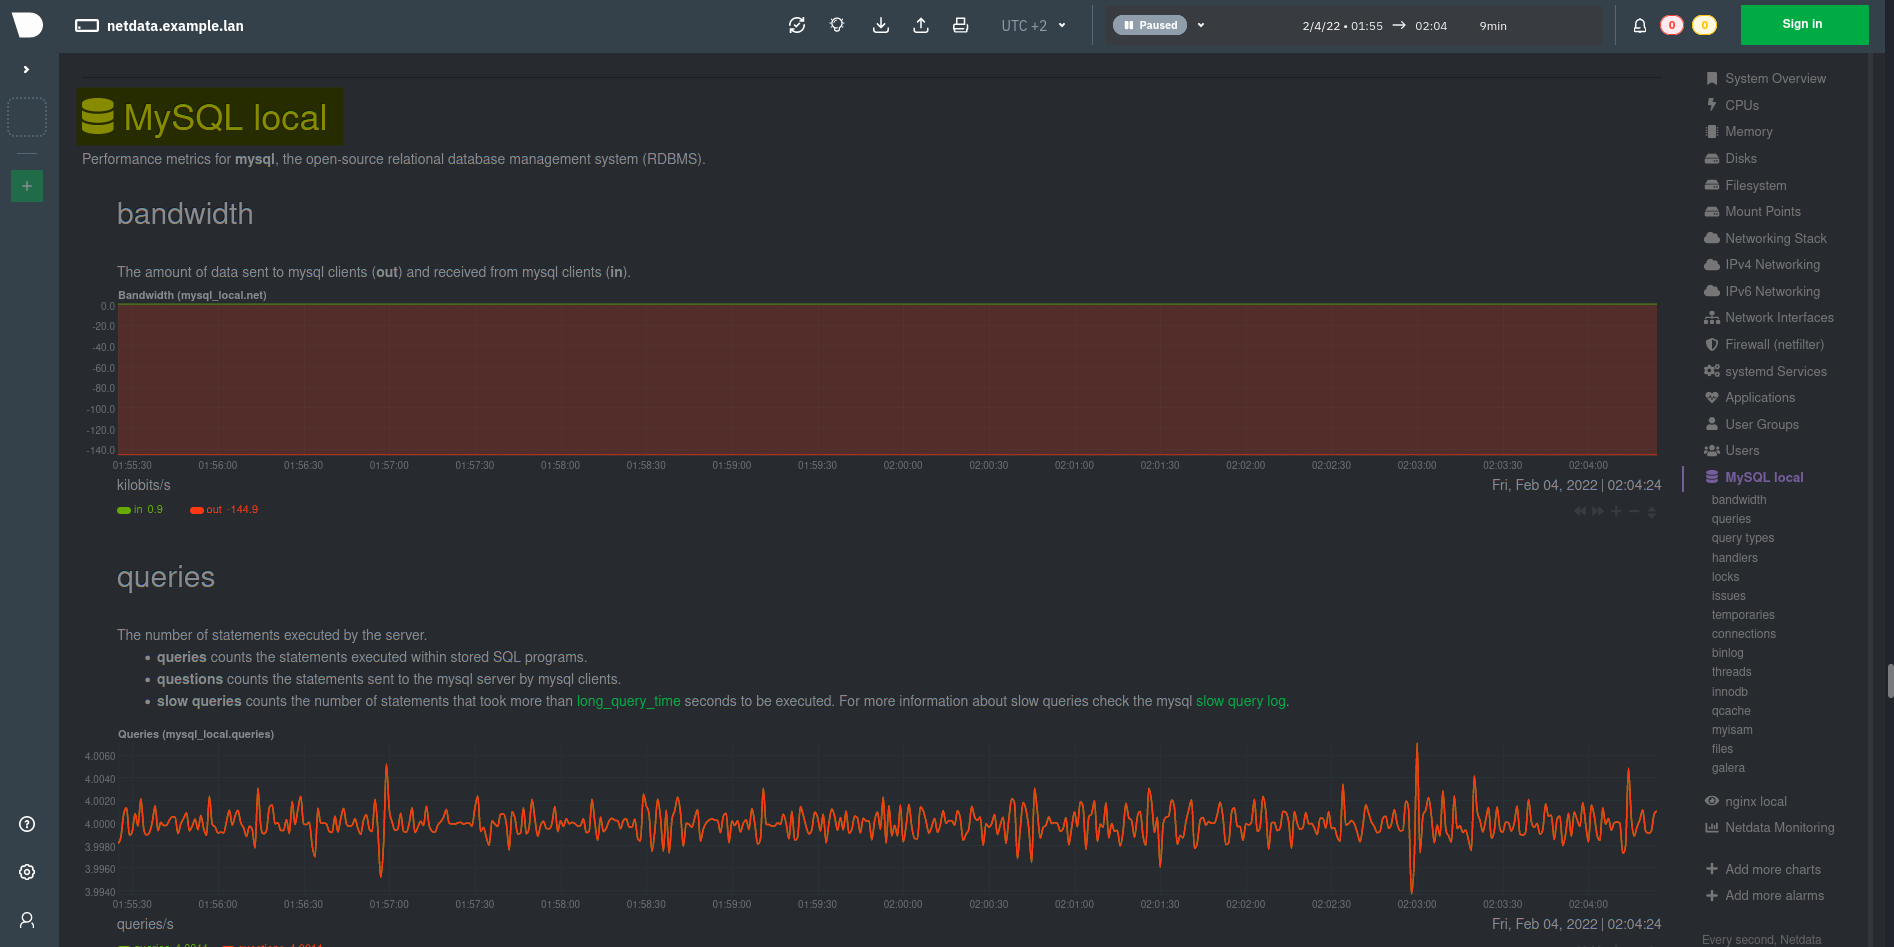
6. Lastly, switch back to your web browser and refresh the Netdata dashboard. You’ll see the MySQL local menu on the right panel, which indicates Netdata is already monitoring your MariaDB server.
Monitoring MariaDB with Netdata
Monitoring PHP-FPM with Netdata
Monitoring the PHP-FPM service allows you to track the PHP-FPM that handles your PHP applications’ active connection, requests, and performance.
You’ll be setting up the PHP-FPM status page to monitor the PHP-FPM with the Netdata.
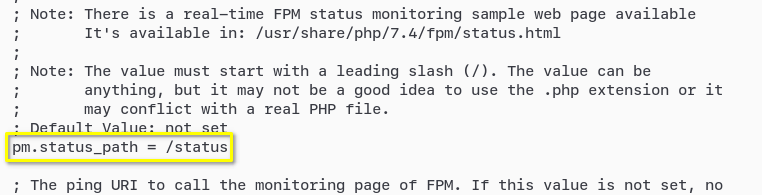
1. Open the /etc/php/7.4/fpm/pool.d/www.conf configuration using your preferred editor and uncomment the pm.status_path = /status option. Doing so enables the PHP-FPM status.
Enabling PHP-FPM monitoring status
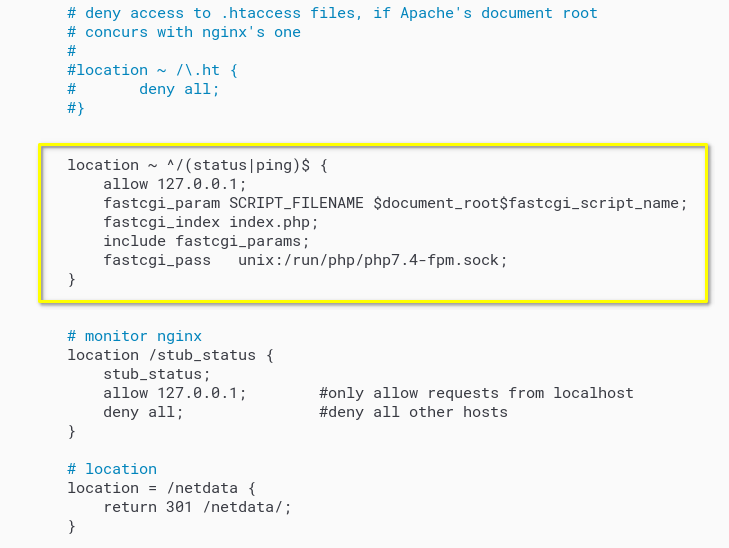
2. Next, edit the default NGINX server block (/etc/nginx/sites-available/default) using your preferred editor and populate the following configuration inside the server {...} section.
This configuration allows Netdata to discover the PHP-FPM status page on the http://localhost/status URL.
4. Now, run the following command to restart the netdata service. Netdata will automatically re-discover services for monitoring.
sudo systemctl restart netdata
5. Lastly, switch back to your web browser and reload the Netdata dashboard.
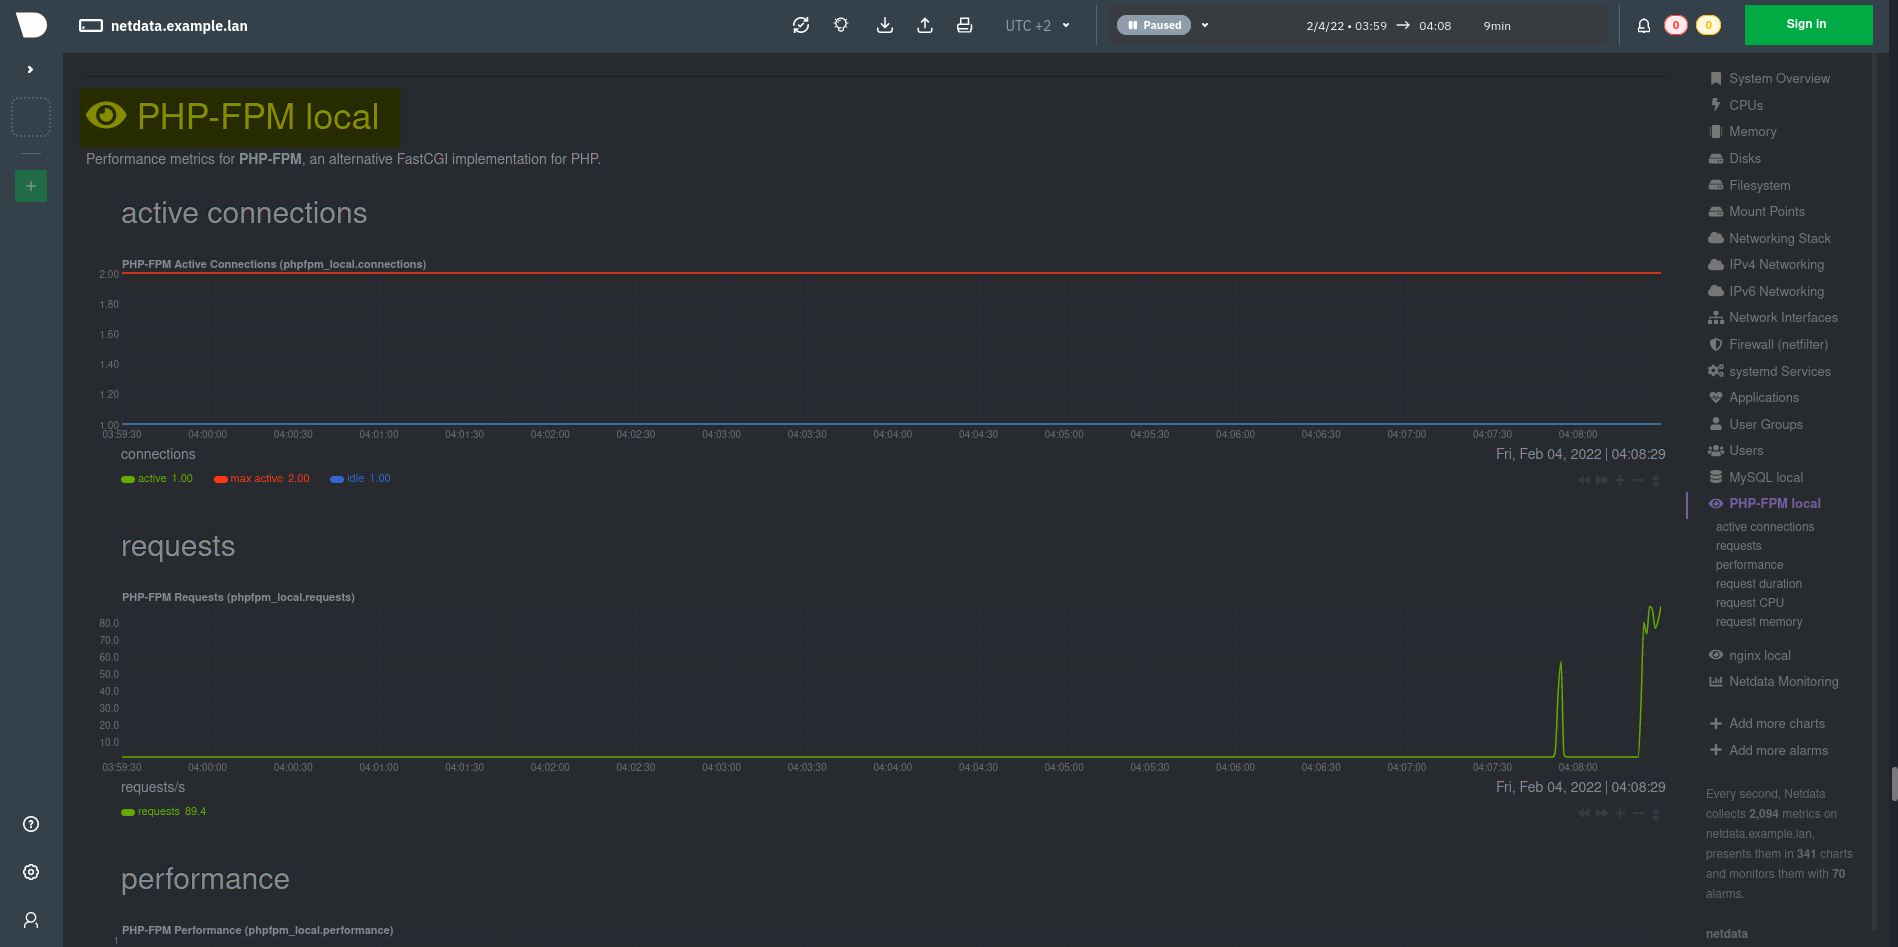
If your configuration is correct, you’ll see the PHP-FPM local menu, which details monitoring for PHP-FPM service.
Monitoring PHP-FPM Netdata
Conclusion
Throughout this tutorial, you’ve learned how to install Netdata on the Ubuntu Linux system. You’ve also learned how to integrate Slack notification for Netdata monitoring for the NGINX web server, MariaDB database, and PHP-FPM.
At this point, you’ve fully configured the Netdata monitoring tool to keep a close watch on your application and services. What’s next for you? Perhaps set up a notification for your application monitoring?
Hate ads? Want to support the writer? Get many of our tutorials packaged as an ATA Guidebook.