

Just because you’re not getting errors on your system doesn’t mean everything’s working fine. Why not read and analyze your Linux system logs to see what’s going on with your system? Not sure how? Lucky for you, Journalctl is up to the task!
In this tutorial, you’ll learn how to keep a close watch on how your system behaves with the journalctl tool by reading and analyzing the systemd’s journal log files.
Read on and keep your system at its prime!
Prerequisites
This tutorial will be a hands-on demonstration. If you’d like to follow along, be sure you have the following.
- A Linux machine – This demo uses Ubuntu 20.04 LTS, but you can use any distro.
Setting the Correct System Time
Before you may use Journalctl, you’ll need to set your system time. The timestamps logged in the systemd journal are in UTC, so you need to select the correct time zone. If your time is off by just a few seconds, some of the log entries may not show up correctly when you use them later on.
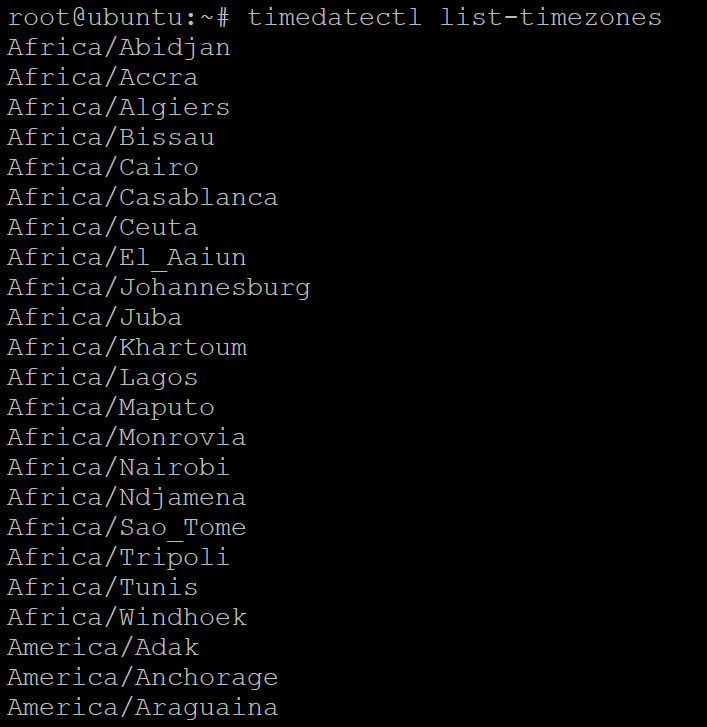
1. Open your terminal, and run the timedatectl command below to get a list of available time zones.
timedatectl list-timezonesPick and note one from the list shown below that matches your region. For example, if you live in America, choose the time zone that matches your city’s closest.
2. Next, run the below command to set your time zone (set-timezone). Replace your-zone with the name of the time zone you previously picked (step one). This command sets your system time to your chosen time zone.
From now on, every log entry will be logged as your local time.
sudo timedatectl set-timezone your-zone
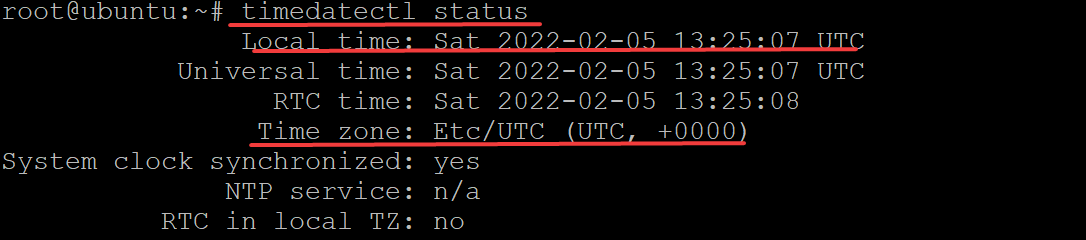
3. Finally, run the following command to verify that you’ve correctly set the time zone.
timedatectl statusAs shown below, the current system date and time should match your selected region and time zone.
Showing All The Logs
Now setting the time zone is out of the way, you can start viewing logs in your system. The systemd System and Service Manager provides centralized management of log daemons, which collects logs from various parts/tools on the system.
But how do you view the logs? The journalctl utility lets you view your machine’s logs. And the first thing you typically want to do is show everything that has happened since the last boot.
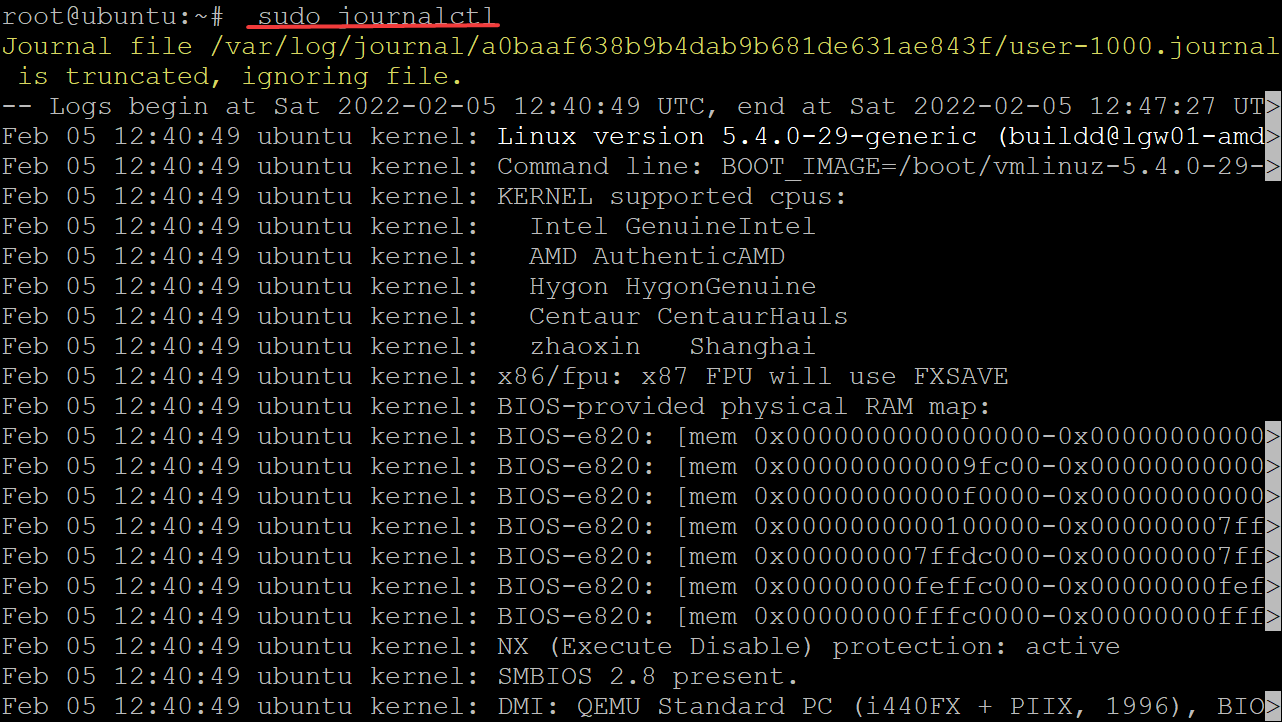
Run the journalctl command below to show all the journald daemon’s logs.
The journalctl utility implements the journald daemon’s command-line interface for collecting and viewing the systemd journal. The journalctl utility allows users to introspect the activity and status of any systemd-managed unit (service, process, and so on).
sudo journalctl
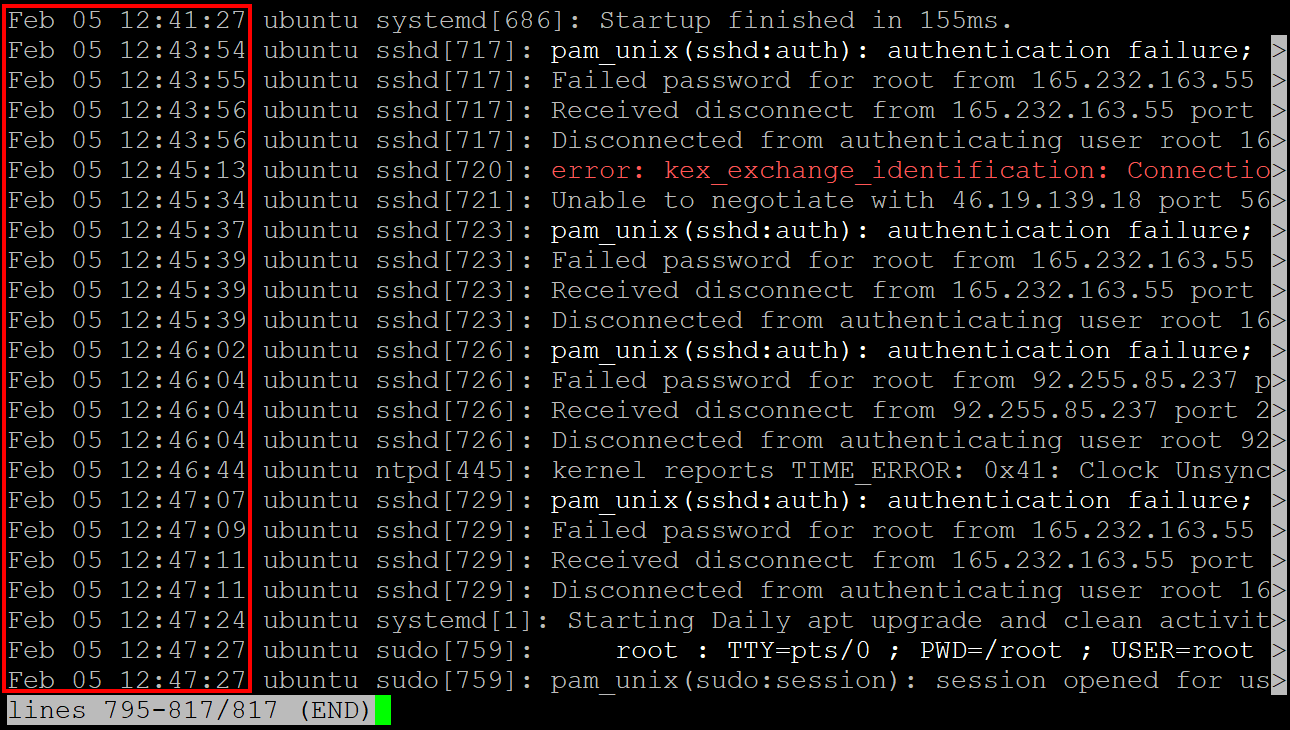
The command displays the entire journal shown below, and it’s a bit hard to read. The oldest logs are at the top of the list, while the most recent logs are at the bottom.
You will likely have hundreds or thousands of entries if the systemd journal has been recording logs long enough.
You can use other parameters to filter the logs, but you won’t get into those filters here as that topic is beyond this tutorial.
Since you likely want to browse through the list more selectively, a page up/down arrows would be nice. Press K to jump up a page and J to jump down a page. Press END to jump to the last page.
Notice the timestamps at the beginning of each entry are your local time since you’ve previously set your time zone in the “Setting the Correct System Time” section (step two).
Making the Journal Persistent
You’ve seen how to view all logs, but you’d typically want to keep logs around for a longer period, so you have more chances to find data about problems that rarely happen. How? By making the journal persistent.
The /run/log/journal/ directory is the default location of log data and is not persistent by default. As soon as you reboot the system, all logs are gone. The idea of persistent logging is to keep all log files, but older logs get archived when they grow too large.
To make the journal persistent between boots, you’ll edit the /etc/systemd/journald.conf file and configure it to use a persistent storage location.
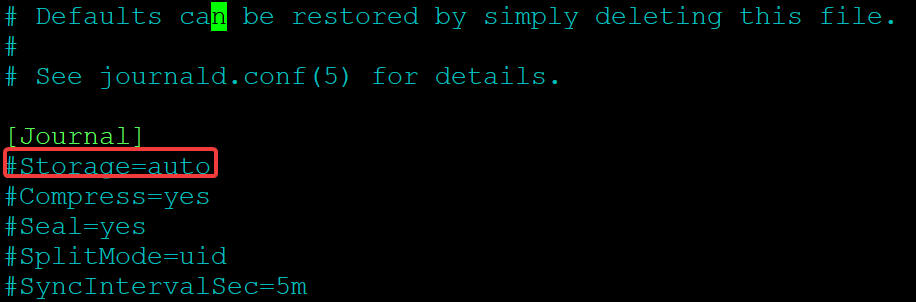
1. Open the /etc/systemd/journald.conf file with your preferred text editor and look for Storage=auto directive, as shown below.
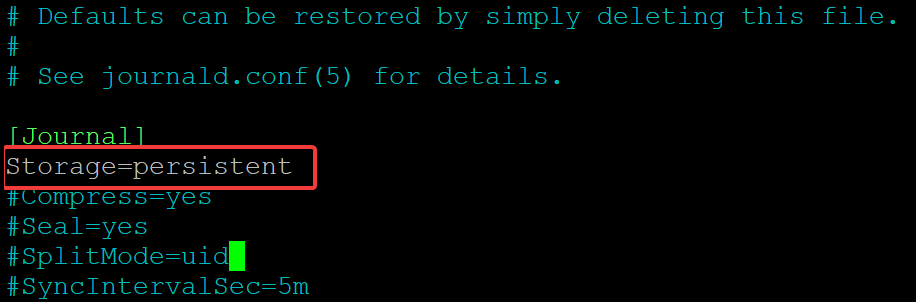
2. Next, change the Storage directive’s value from auto to persistent, then save the changes and close the editor. Keep the Storage directive in one line and no spaces between the directive and the value, or else the configuration won’t work.
3. Run the following command to restart the systemd-journald service to activate all the changes. This command doesn’t print output, but reboot your machine and open another terminal once this command completes.
At this point, systemd will ignore /run/log/journal and instead store the journal data in the /var/log/journal directory, so your log journal becomes persistent between boots.
When you start the
systemd-journaldservice, it automatically creates the /var/log/journal directory if it doesn’t exist.
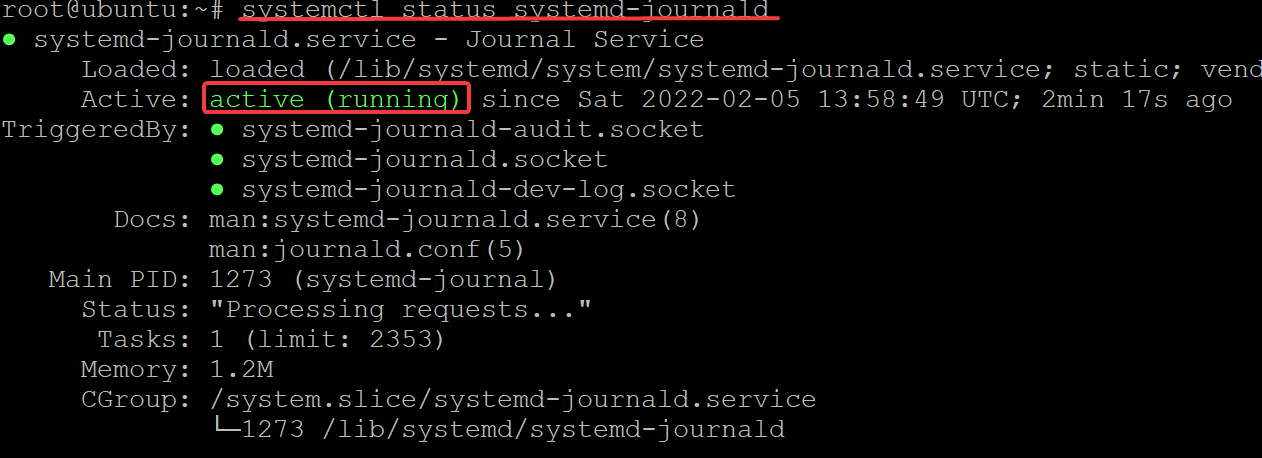
sudo systemctl restart systemd-journald4. Now, run the below command to check the status of the systemd-journald.service.
sudo systemctl status systemd-journald.serviceYou’ll see an active (running) status if your configuration works, as shown below. The output below confirms that the journal is running as intended.
5. Run the ls command below to see if the /var/log/journal directory exists.
ls /var/log/journalYou will see the following output, which is the UUID of the persistent journal. This UUID does not have any particular meaning and is just a random unique string generated during the boot process. This string is an identifier you can use to reference the data in /var/log/journal.
Note the UUID as you’ll use it to list log journals (step six).

6. Finally, run the below command to list the log journals. Be sure to replace myUUID with your previously noted UUID (step five).
ls /var/log/journal/myUUIDSimilarly below, you’ll see the journal from your last boot. And at this point, you now have a persistent logging system!

Listing Journal Entries from the Current Boot
You have learned how to display all the log entries. But perhaps you prefer to filter out specific types of logs. If so, you may want to view only the kernel log entries.
The journalctl tool has a powerful filtering syntax that lets you display specific types of log entries. Or even show related information like the process ID (PID) or unit name of the originating service.
There are different ways to filter out logs, but perhaps you’re only interested in viewing journals from your current boot. If so, the basic journalctl command will do the trick.
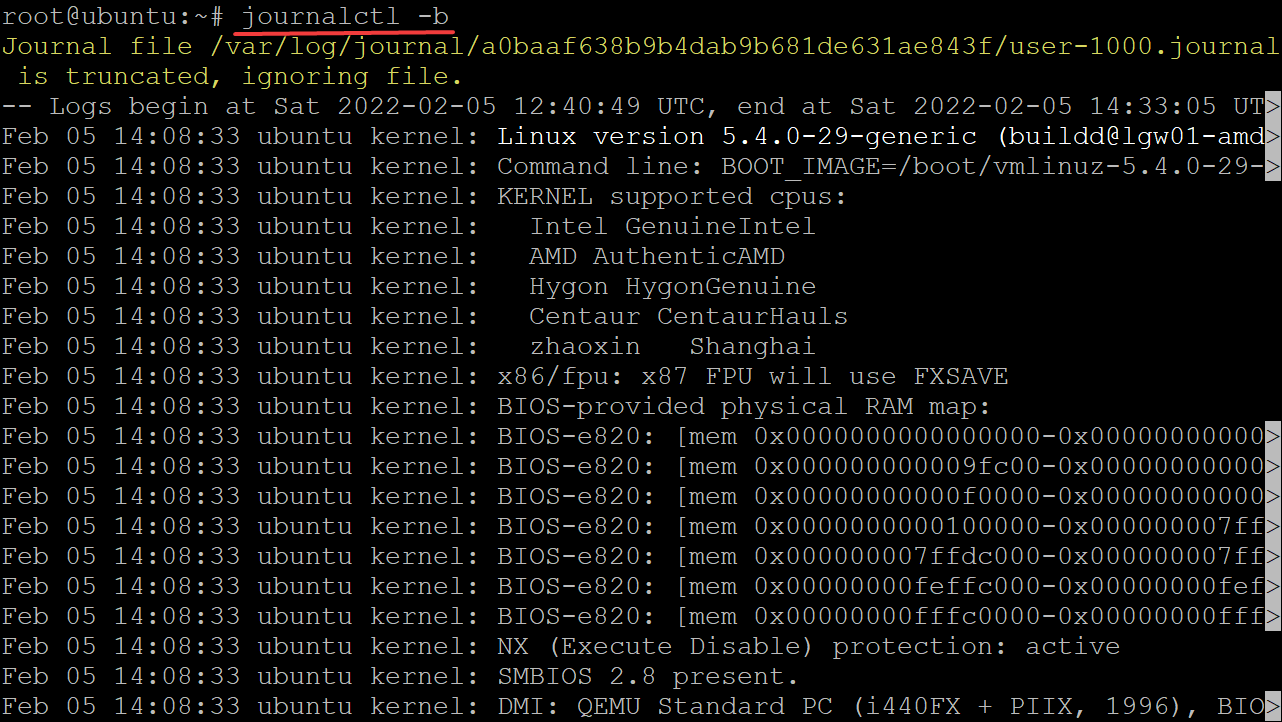
Run the journalctl command below to list all journal entries from your current boot (-b) pertinent to your current system/environment. The -b flag tells the journalctl command to display logs stored by journald since the last system boot.
journalctl -b
Listing Logs of Past Boots
While using journalctl for troubleshooting, you may also need to display the log entries of a specific past boot. Perhaps you have a service that starts in one boot but fails in another. In that case, you must isolate the log entry from the second boot to see what went wrong.
1. Run the below command to display the list of past boots (–list-boots).
journalctl --list-bootsAs shown below, since you have configured persistent logging in the previous section, journalctl displays all the past boots.
- Each line in the list indicates a past boot log entry. The first column is the offset of the boot, which you can use to reference each entry. The offsets are shown as numbers (-1, 0).
- You can also use the second column, the boot ID, as an absolute reference to a boot entry.

2. Next, run the journalctl -b -1 command to display the journal entries from boot 1 (the previous boot). But you can also display journal entries from other boots by changing the boot number (i.e., boot 2, boot 3…)
journalctl -b -1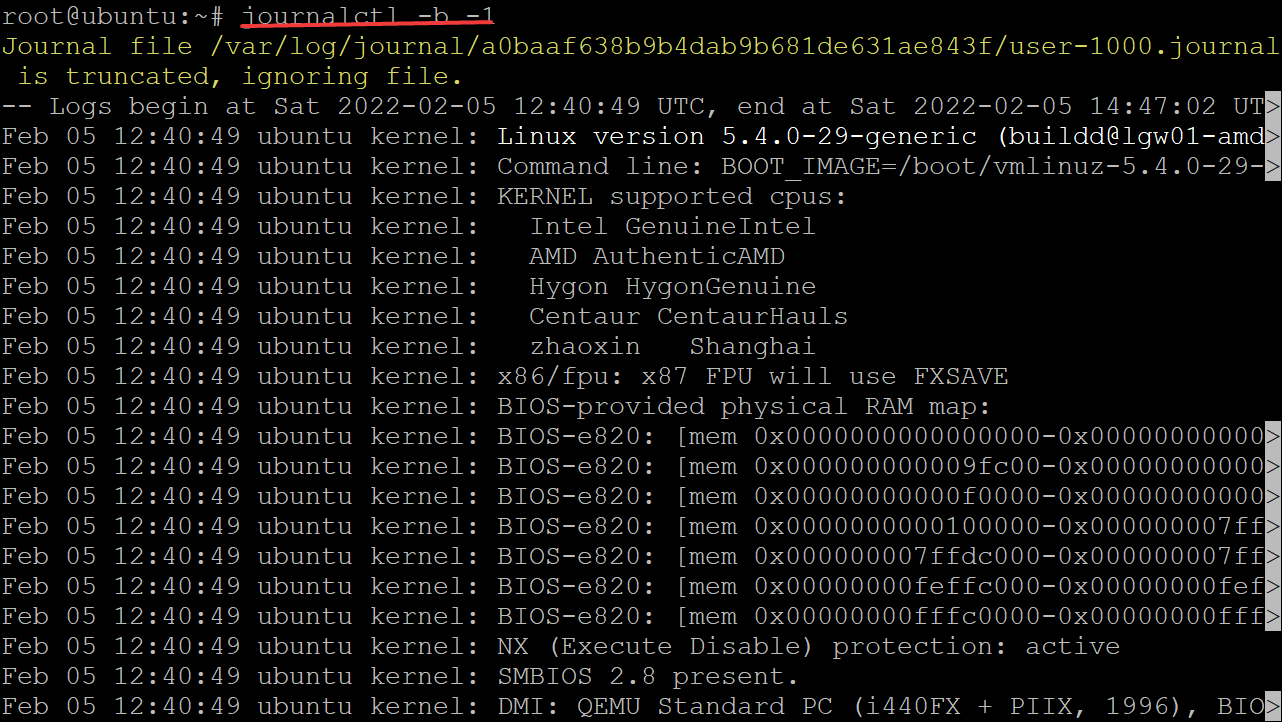
3. Finally, run the below command to display the journal entries from the same boot but referenced by its boot ID (boot_id). Be sure to replace boot_id with the boot ID you noted in step one.
journalctl -b boot_id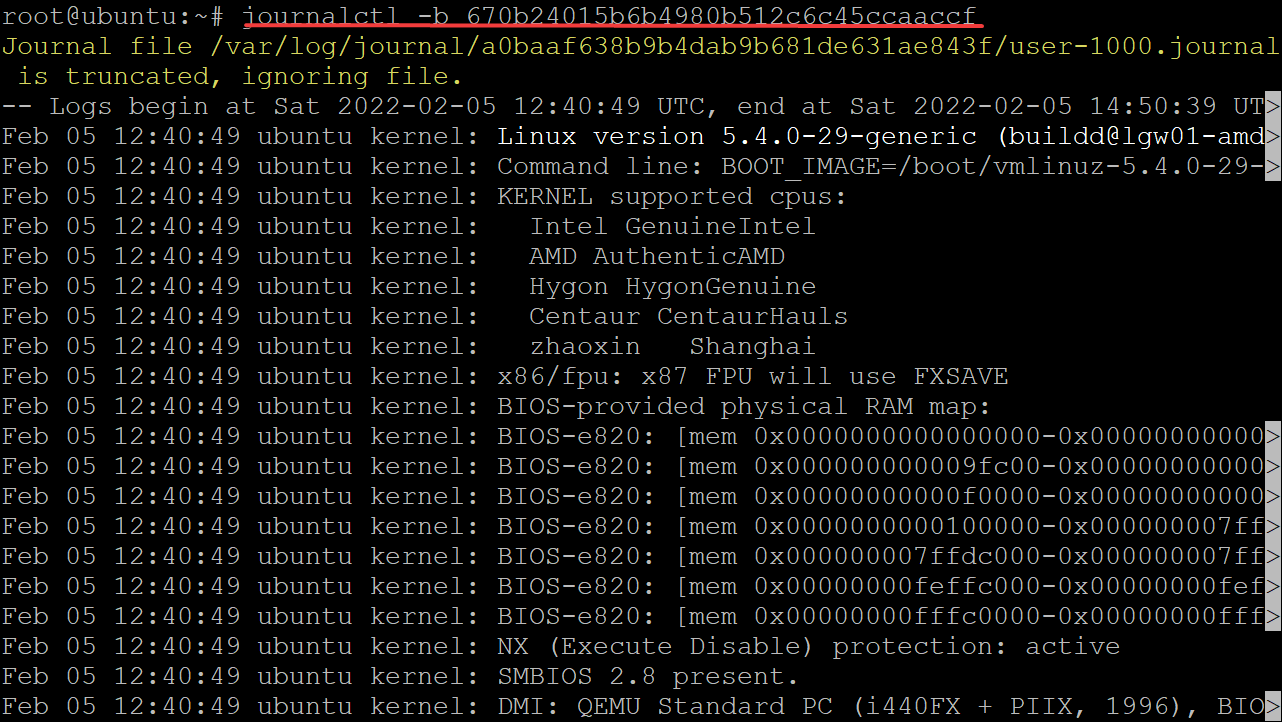
Listing Logs Based on Time Windows
You’ve seen how to view all logs from past boots, but what if you need to view specific logs by time? Appending the --since and --until options filter journal log entries based on time windows.
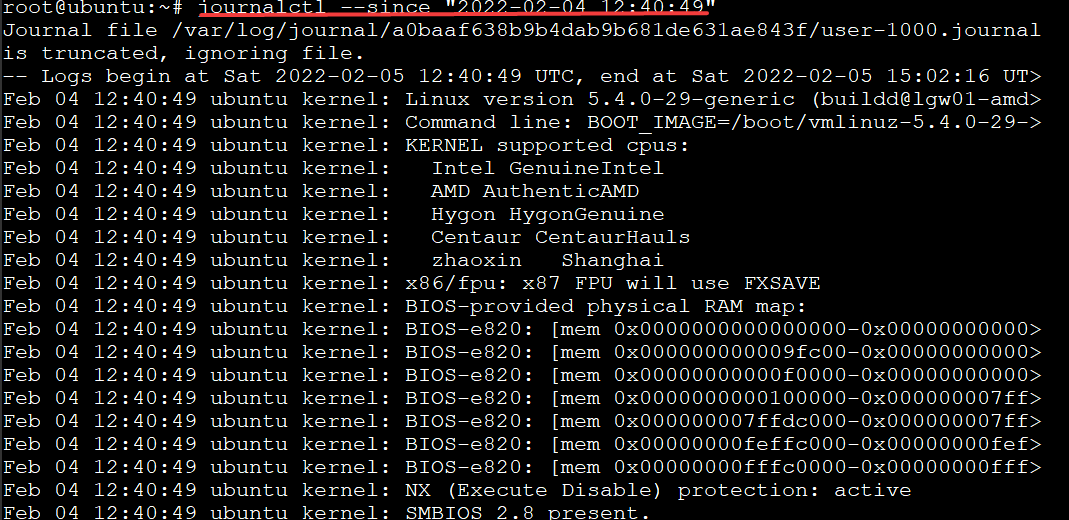
Run the journalctl command below to find all journal entries generated 24 hours ago from a specific date and time (--since "2022-02-04 12:40:49”).
journalctl --since "2022-02-04 12:40:49”
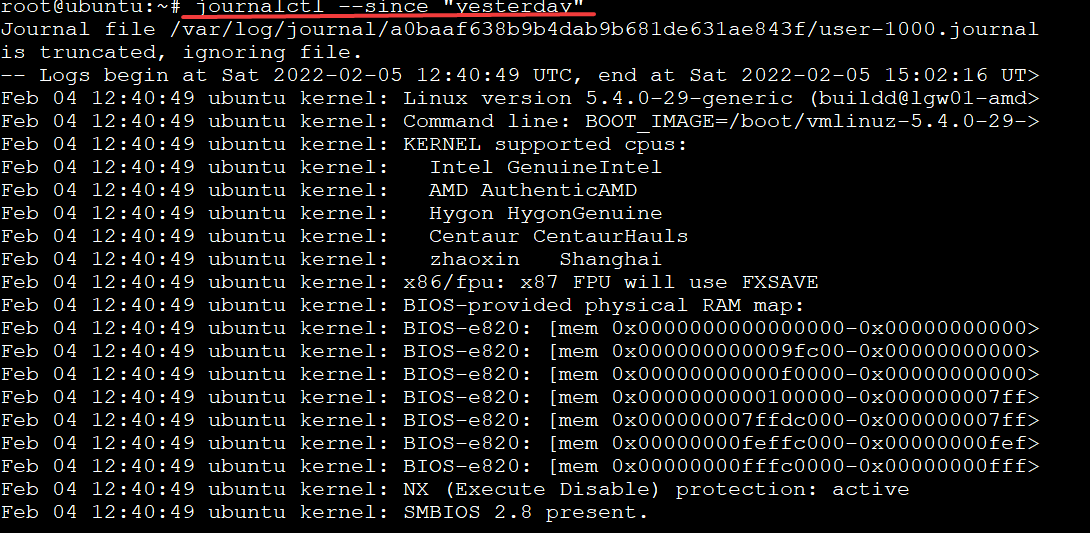
Perhaps you’re not into specifying date and time. If so, use relative values and time durations instead. For instance, “2 minutes”, “30m”, “1h”, and even days like “yesterday”, or “now, and so on.”
Run the below command to show all journal entries since 24 hours ago from the current date and time (”yesterday”).
journalctl --since "yesterday"
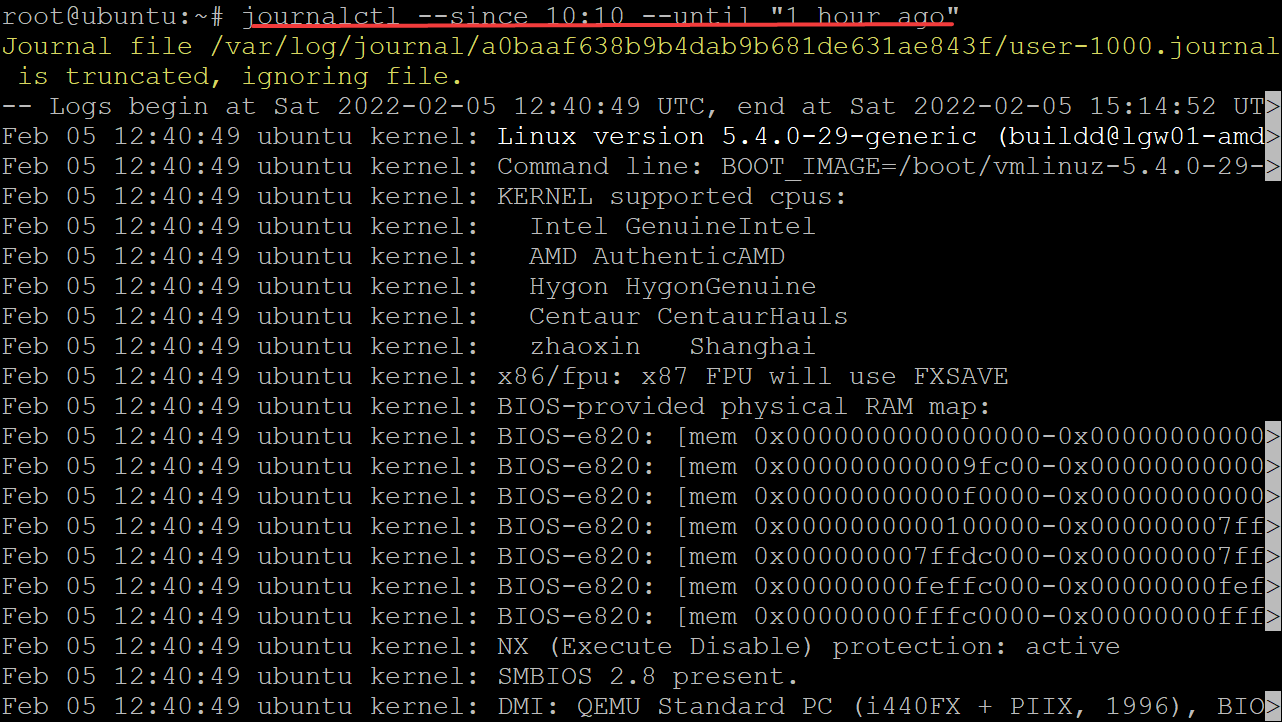
Now, what if your SSH service was running since 10:10 today and continuing until it got interrupted one hour ago? Append both --since and --until options to the journalctl command to find out what went wrong.
Run the command below to find logs generated from 10:10 today until 1 hour ago.
journalctl --since 10:10 --until "1 hour ago"
Filtering Logs Based on Originating Process’ Unit
Finding logs generated from and until a specific date and time comes in handy for troubleshooting, but you may still get many records in the output. How do you further filter the logs?
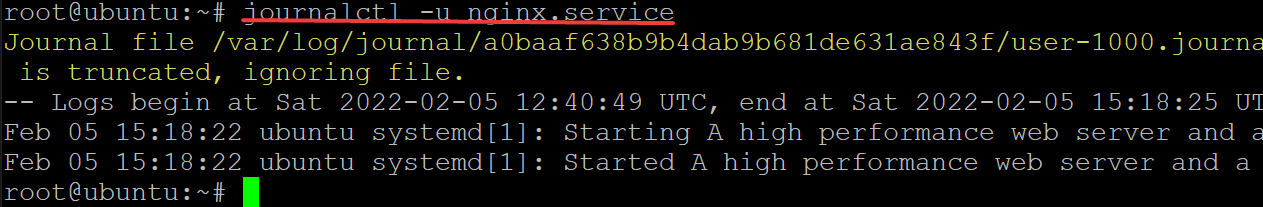
For example, you want to filter the journal entries from an NGINX web-server unit that failed to start at boot. Use the journalctl command with the -unit option and the service’s unit name to view the logs.
Run the below command to list all journal entries based on the originating process’s unit (-u) (nginx.service). This type of filtering is beneficial to know the PIDs of the processes or services related to a particular error or warning.
journalctl -u nginx.service
Perhaps you prefer to actively display any changes as they happen, like while troubleshooting service, and need to view the logs as they are loaded by journald. If so, run the below command to list or follow (-f) all changes as they happen.
journalctl -f
So far, you’ve seen that journalctl is flexible and has many options for filtering and displaying logs. It’s impossible to show all kinds of filters and time intervals in this tutorial, but you can run the
man journalctlcommand to see other options journalctl tool offers.
Customizing Output Format
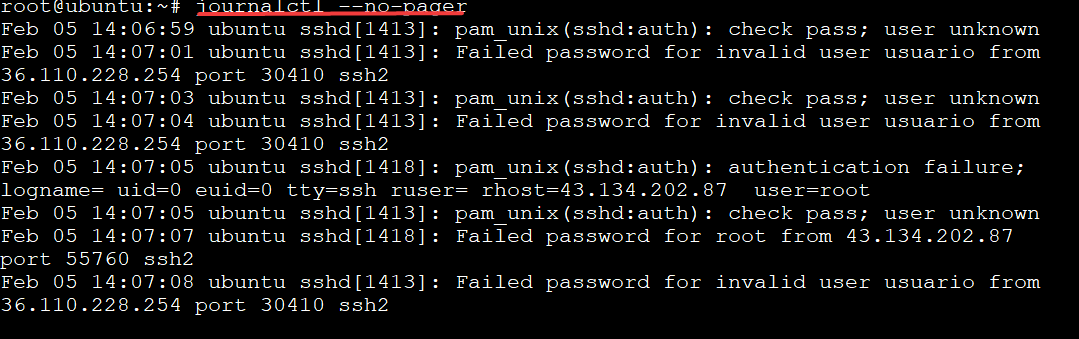
By default, journalctl displays log entries in a pager-like format and colors terminal text on output. But you probably want to output your logs in a standardized, more parsable format. In that case, you can use any text manipulation tools.
Run the below command to suppress the paging and coloring. The journalctl tool lets you specify what to display on stdout with an output directive in the configuration file.
journalctl --no-pager
But if you prefer to specify an output format, add the -o option to the journalctl command. The following example uses the JSON output format, but you can use any other options available in journalctl.
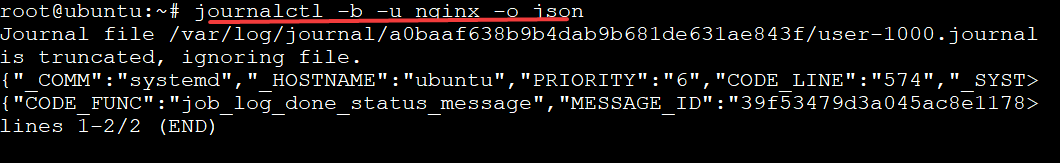
The command below lists journal entries from the current boot (-b) generated for NGINX service (nginx) and outputs the list in JSON format (-o json).
journalctl -b -u nginx -o json
While you can also use a custom output format,
journalctlprovides several useful predefined ones, such as JSON, CSV, and Syslog. Each of these formats has its merits, but you should consult text manipulation tool pages for more information on how they handle text.
Conclusion
In this tutorial, you’ve learned how to use the journalctl command to view the systemd journal logs. But before using any of these commands, you should first select appropriate sub-command options to specify what you want to view.
At this point, you can now quickly locate and pinpoint specific information within your system logs through journalctl. You are now equipped with the necessary knowledge, so why not jump to managing Linux services with systemctl and journalctl?


