


Collecting, and analyzing data about usage, uptime, response time, etc., can be tedious and confusing. How could all these things be visualized? Visualizing data through the AWS Grafana dashboard is one of the most exciting ways to use AWS services for monitoring your organization.
In this tutorial, you will explore and learn to connect data sources with Grafana and give tips on visualizing data even better with some tweaks here and there.
Feel excited yet? Dive in and start visualizing data like never before!
Prerequisites
This tutorial will be a hands-on demonstration. To follow along, be sure you have an active AWS account.
Creating a Workspace in AWS Grafana
AWS Grafana is a data visualization tool with more than thirty (30) data sources available on the AWS Marketplace. AWS Grafana offers a workspace for users to maintain team members’ permissions.
In this example, you will create and set up a workspace by assigning users to the workspace in AWS Grafana.
1. Open your favorite web browser, and sign in to the AWS console.
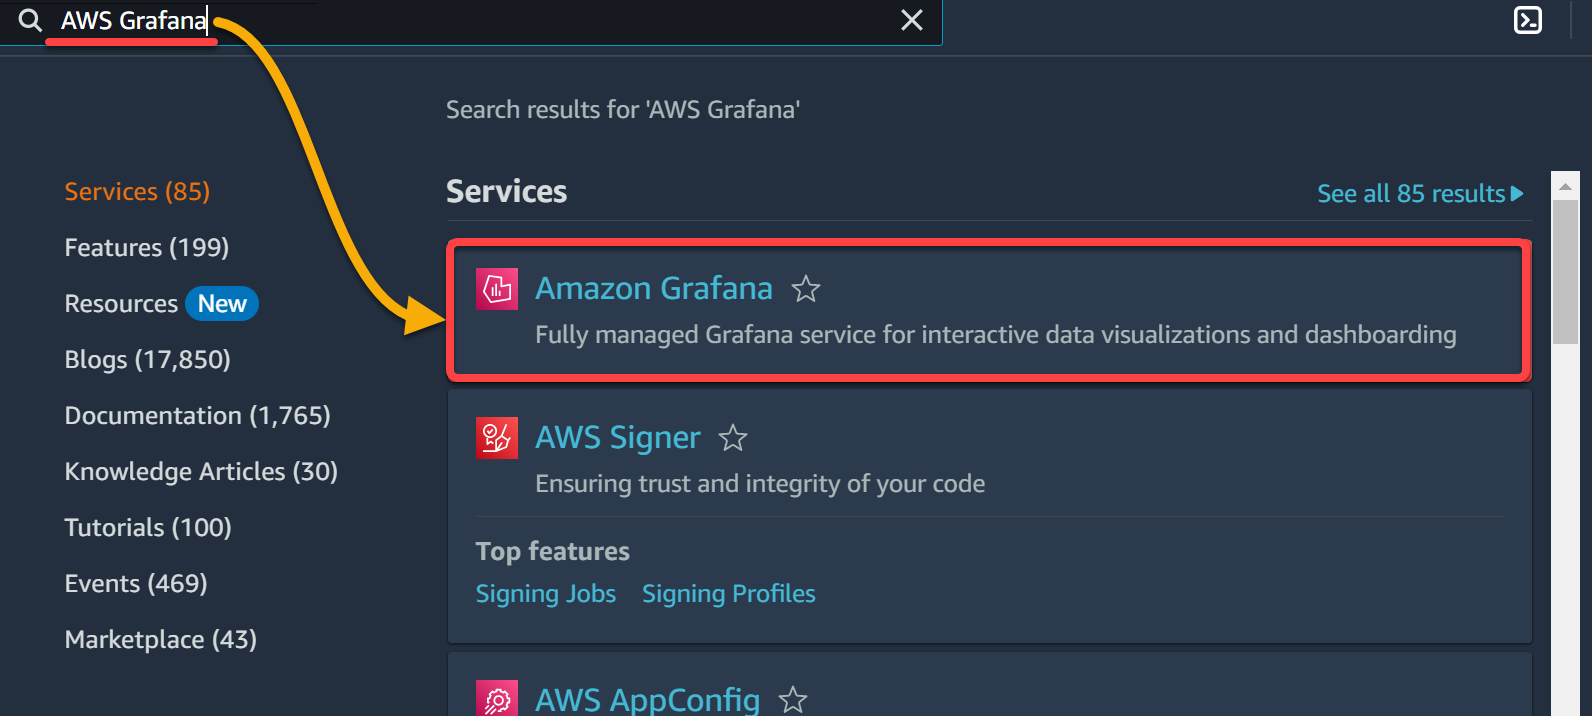
2. Once signed in, search for AWS Grafana, and click Amazon Grafana from the search result to access the service.
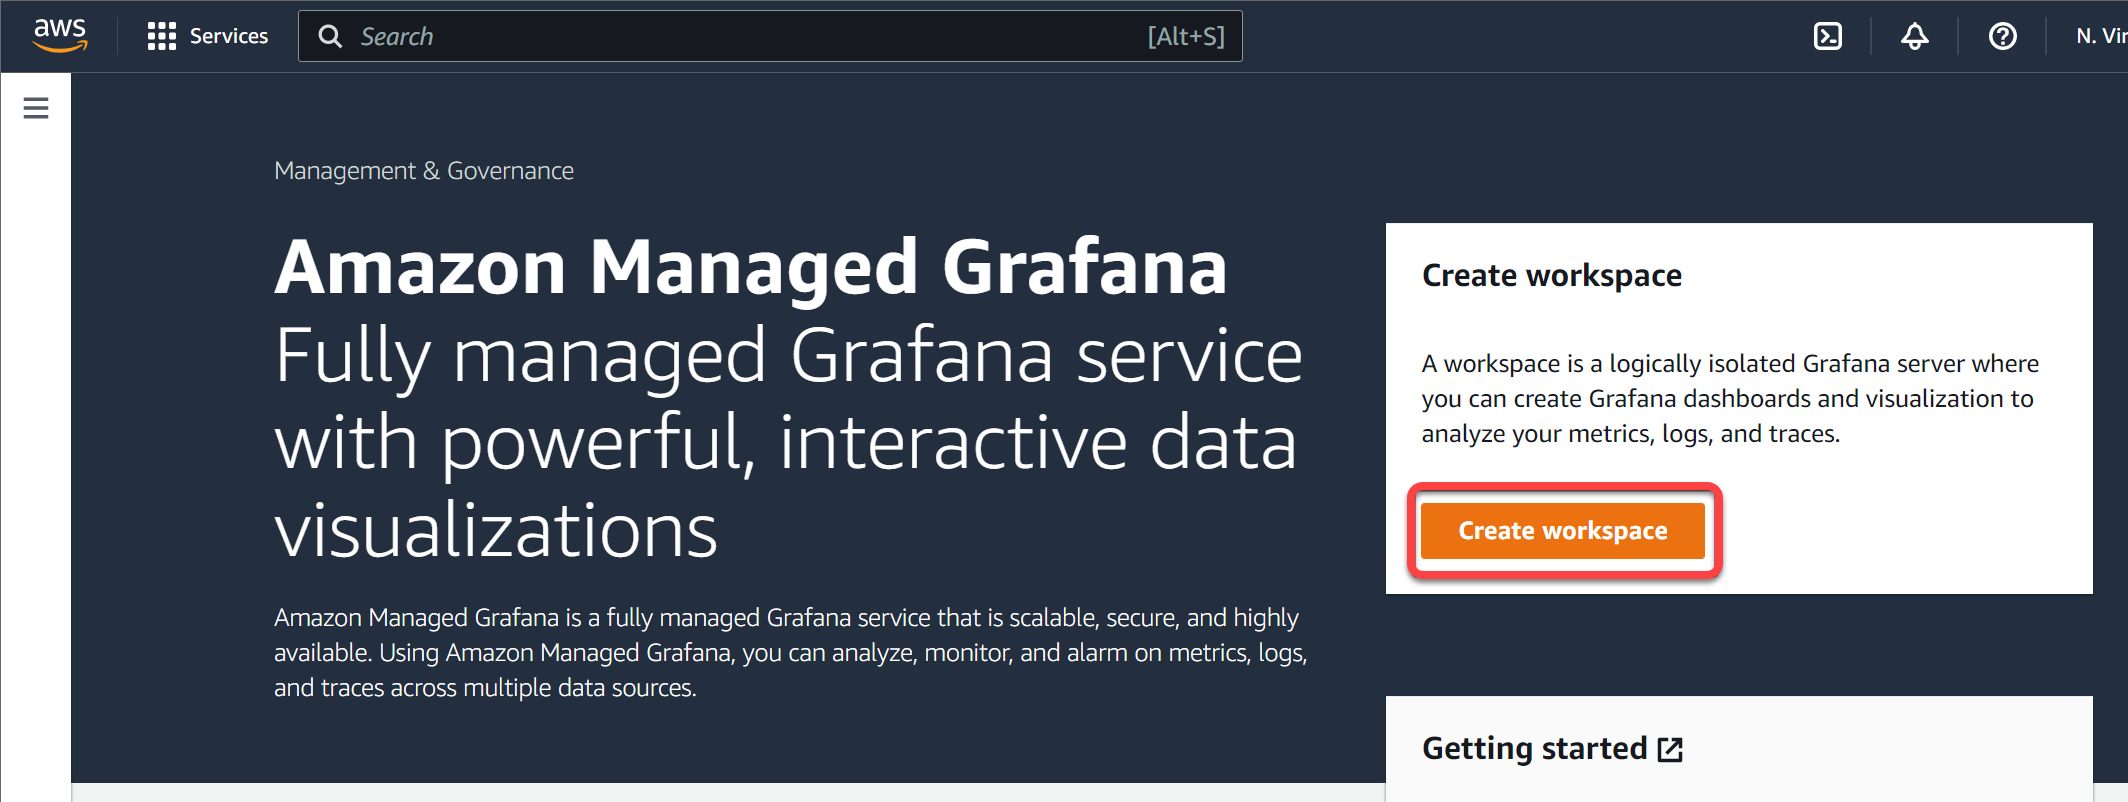
3. Next, click on Create Workspace in the Amazon Managed Grafana to initiate creating a workspace.
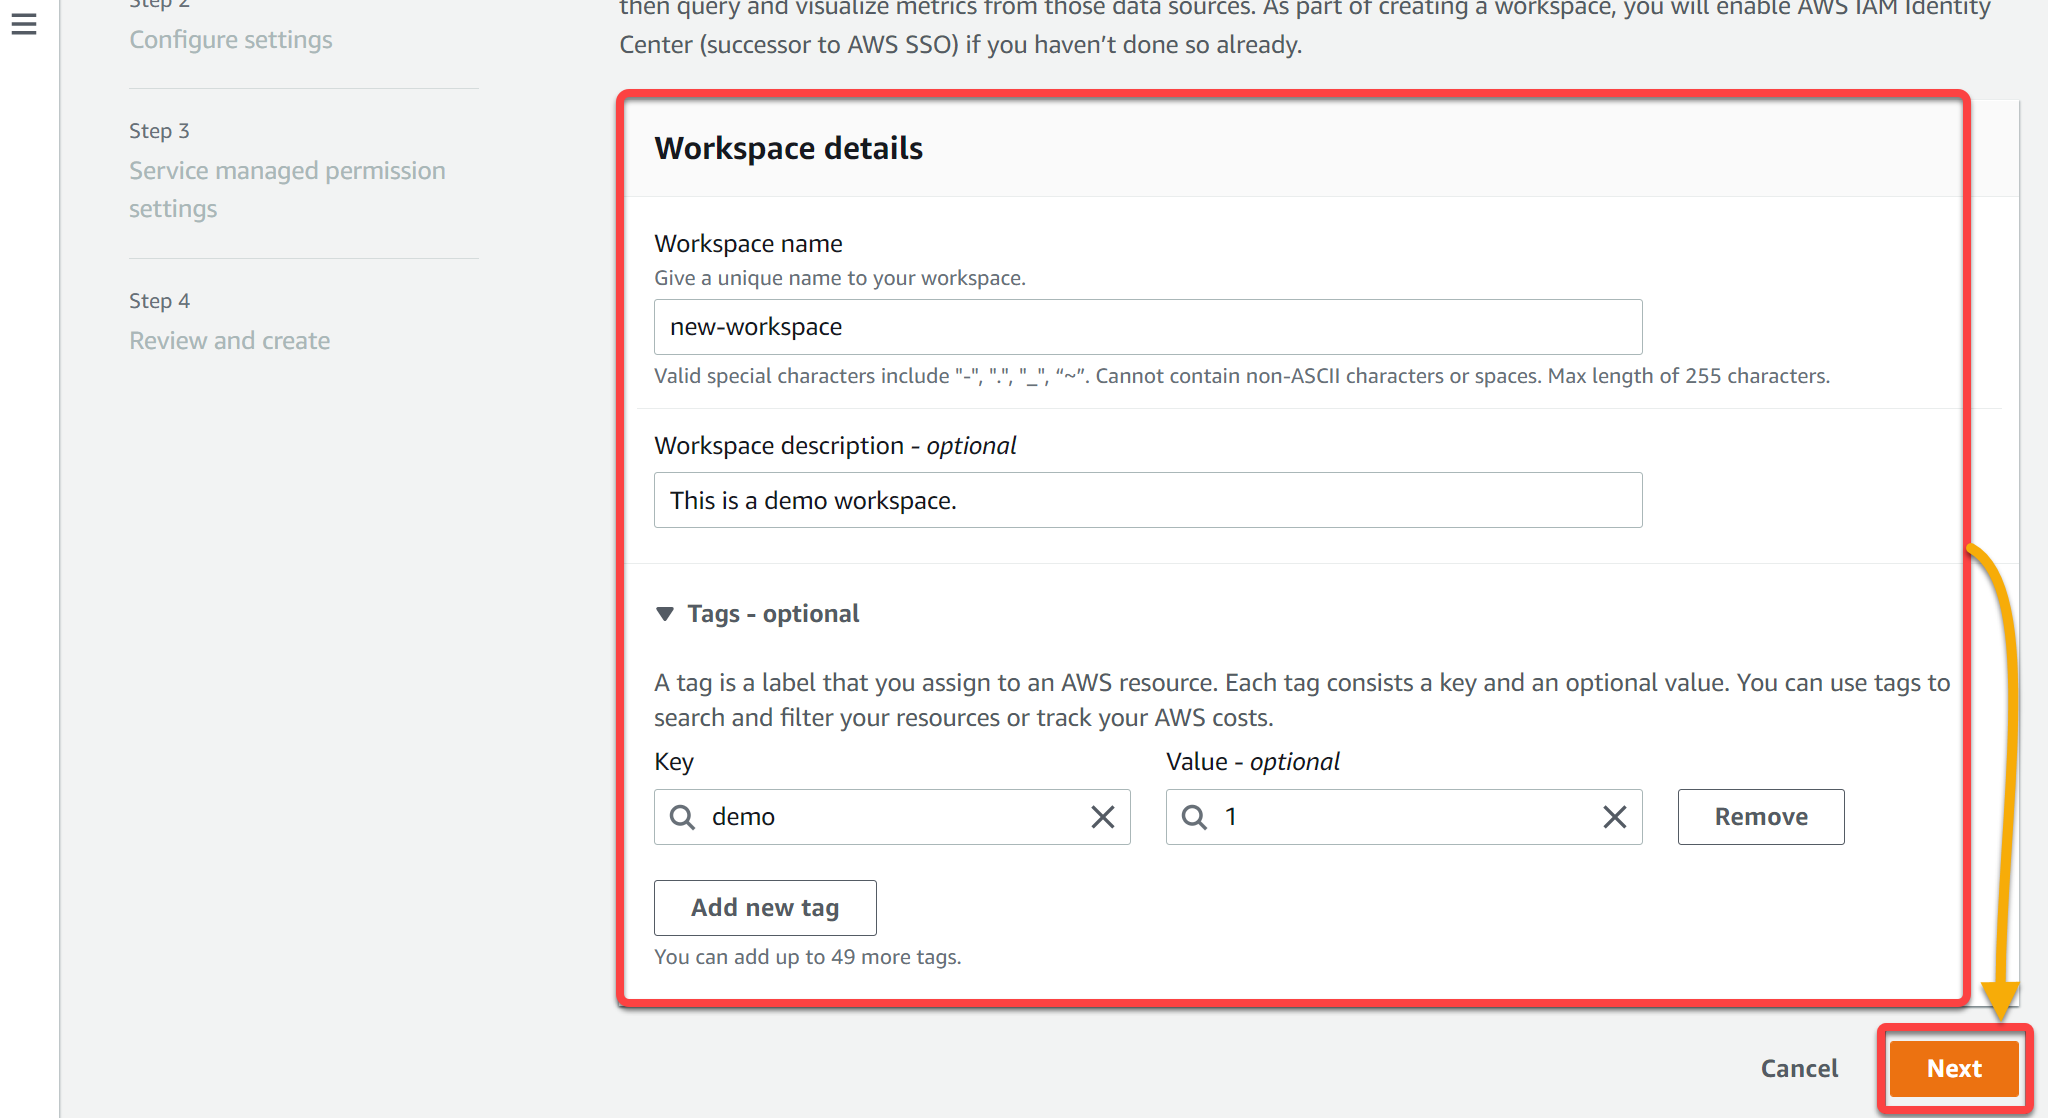
4. Now, configure your workspace details, such as the Workspace name, description (optional), and so on, and click Next.
Note that tags are also optional, but for the sake of this tutorial, tags are added. Tags are labels assigned to AWS resource groups and stored in a key-value state. Adding tags helps search and filter your resources or track your AWS costs.
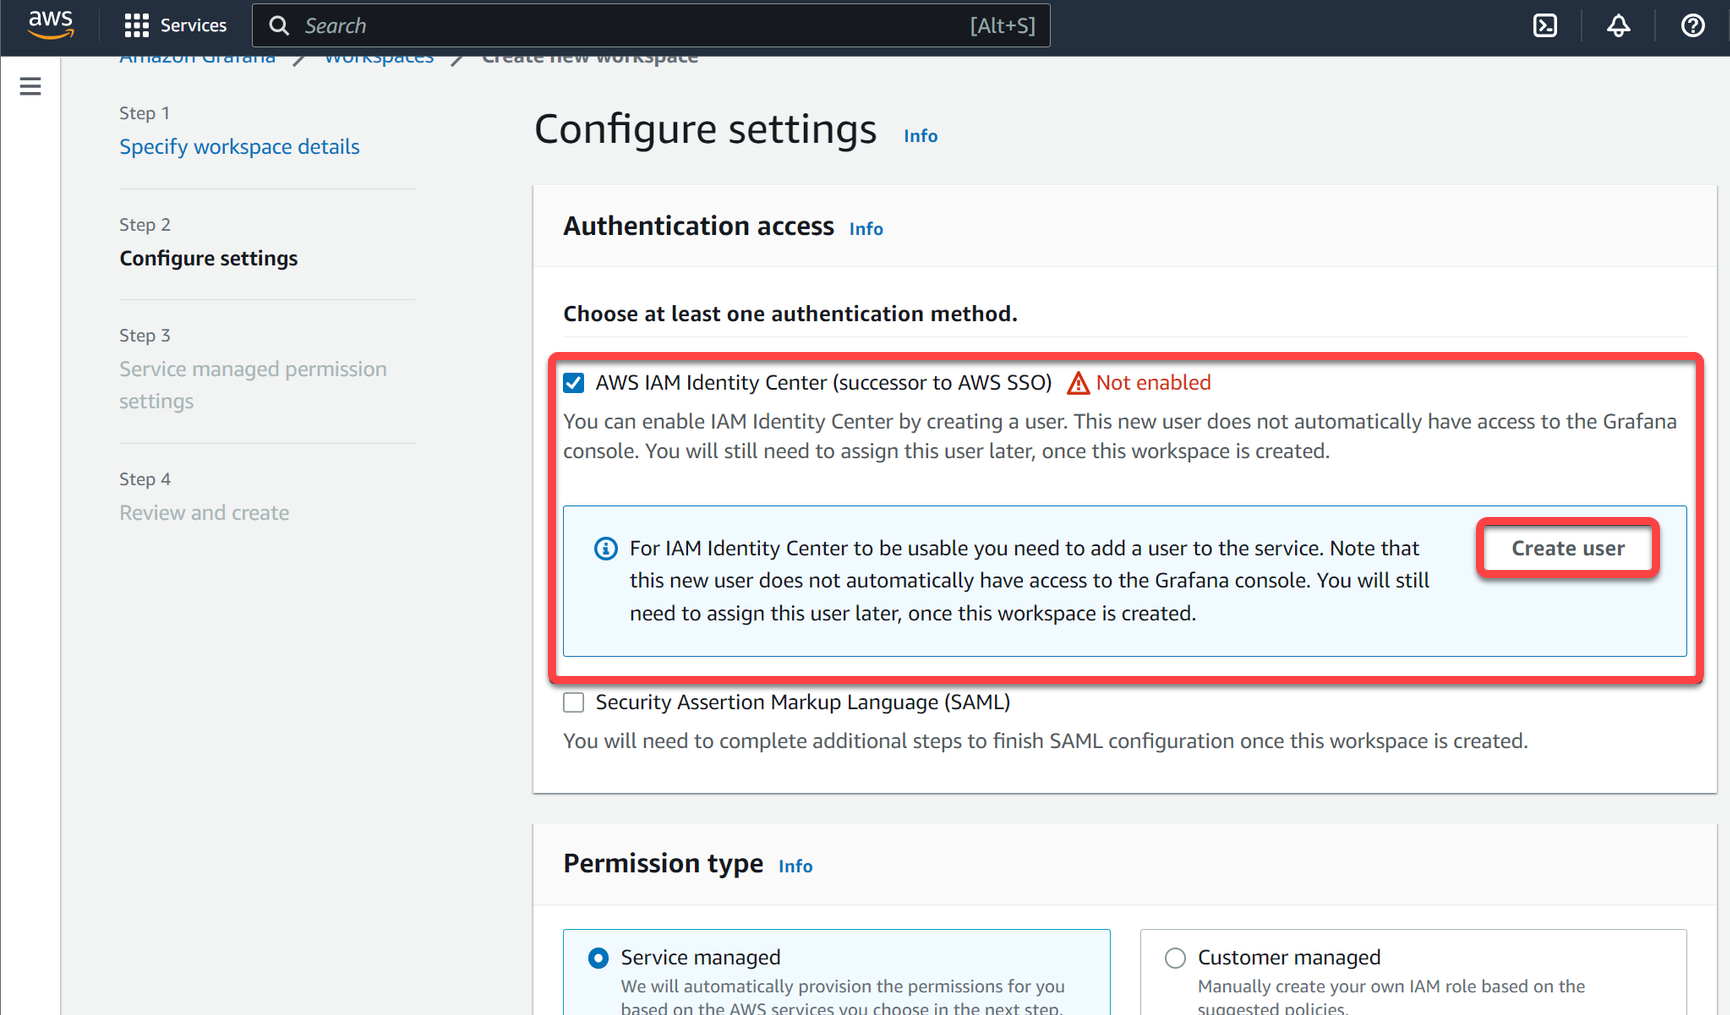
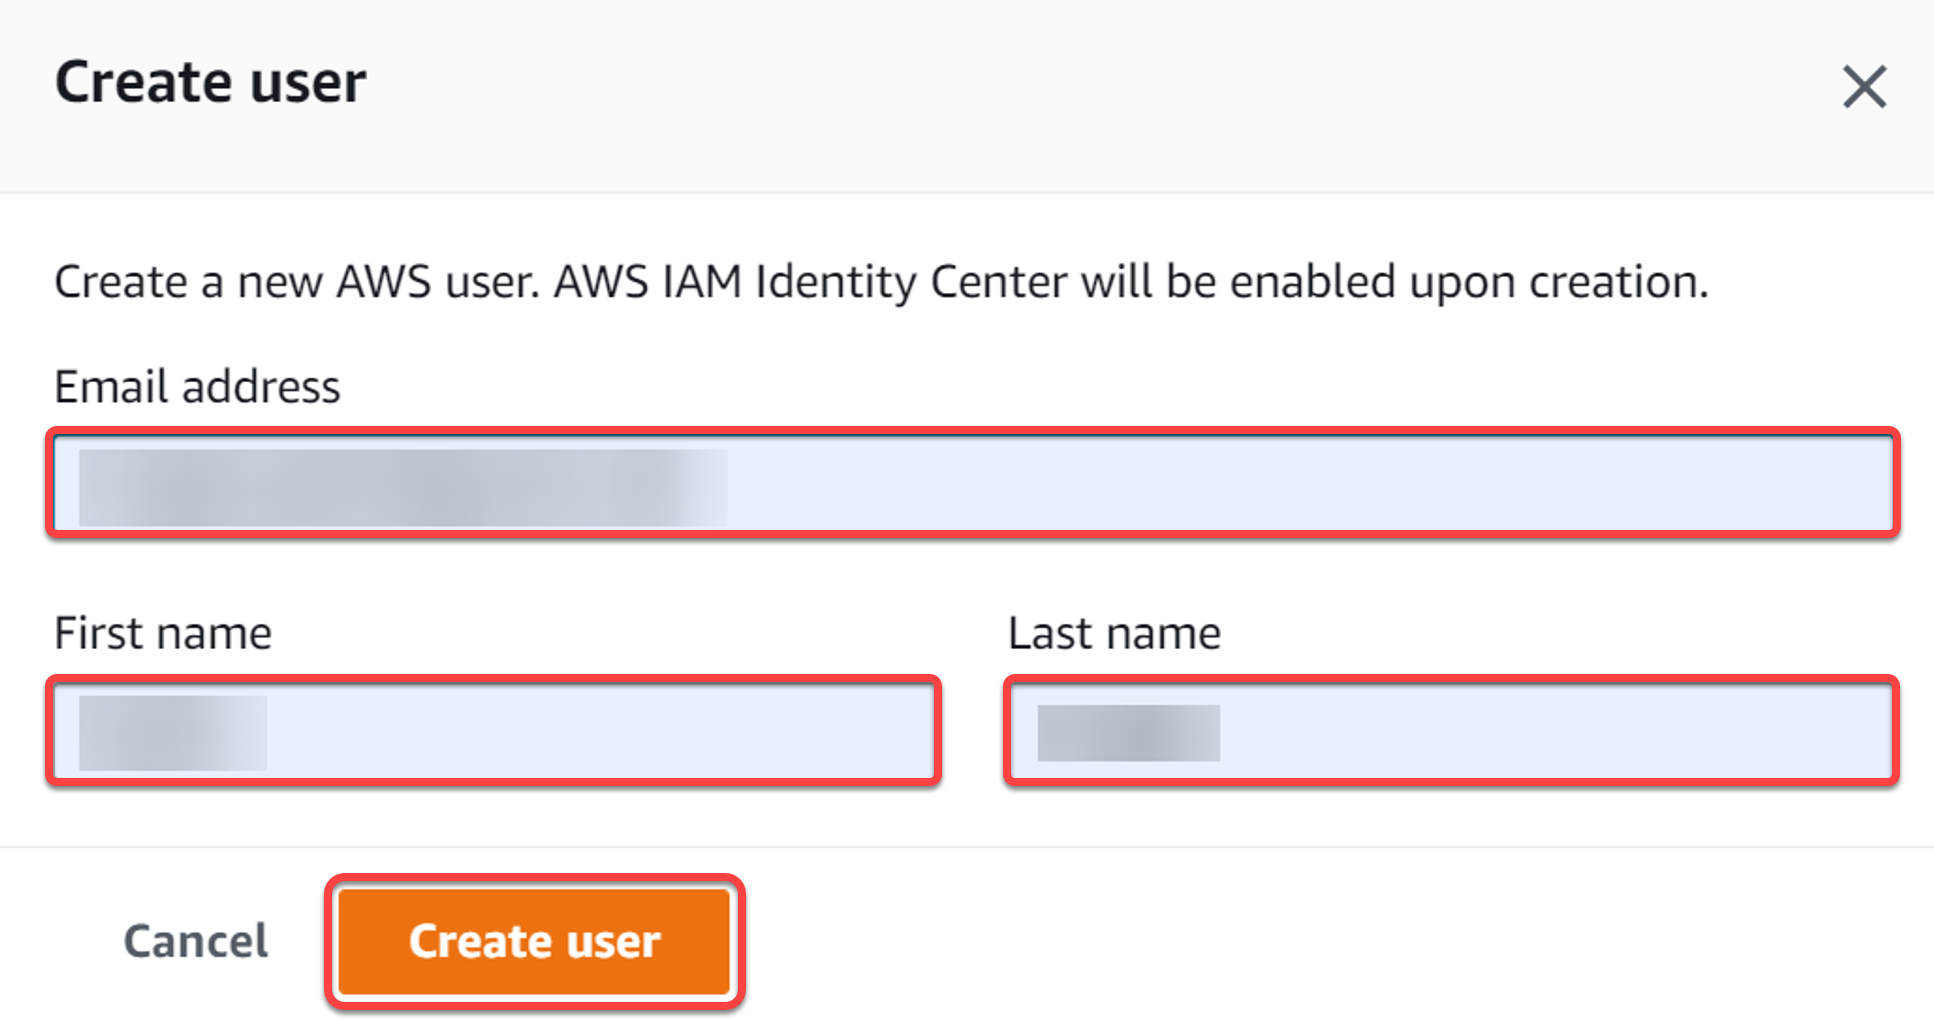
5. Tick the AWS IAM Identity Center box to enable a way to authenticate users accessing your Grafana workspace, and click Create user to add a user to the service. A pop-up window appears where you will provide the user details (step six).
6. Fill in the required information for the new user, and click Create User.
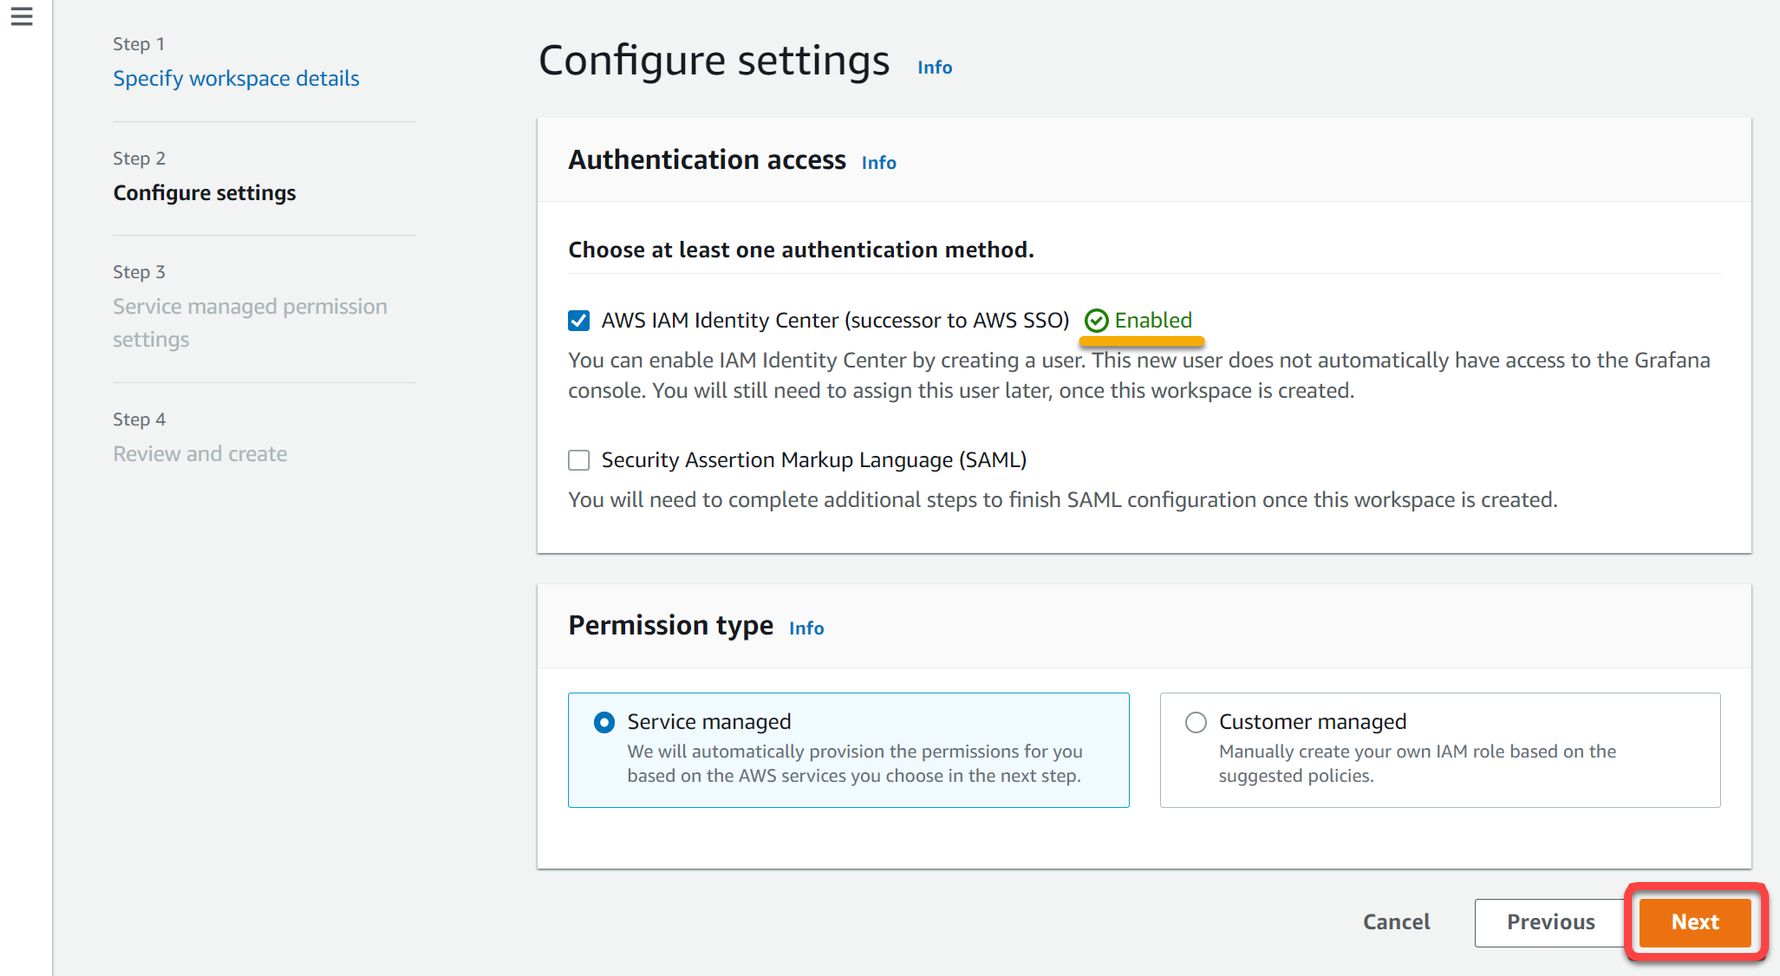
7. Next, leave the Permission type as is, and click Next once you see the authentication access method is Enabled.
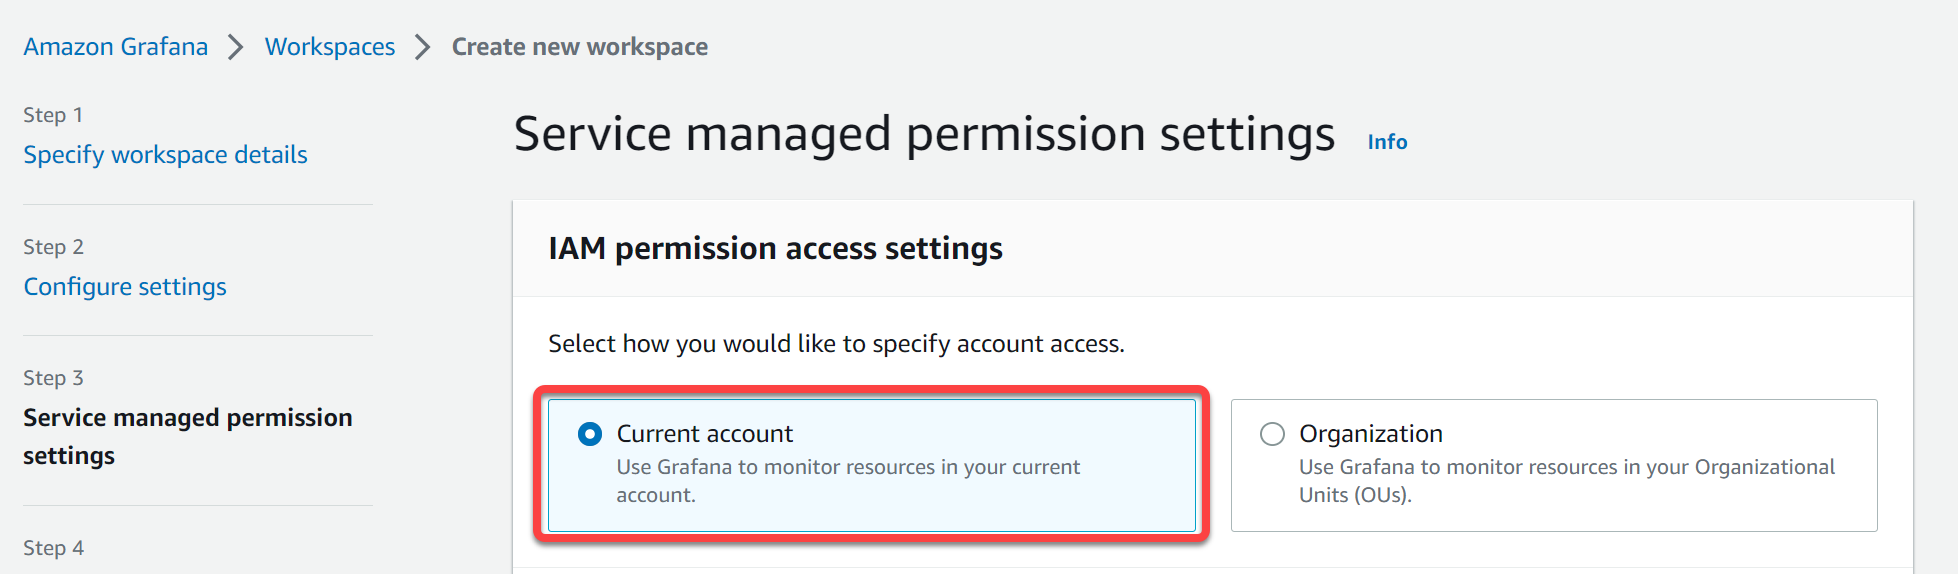
8. Next, select an IAM permission access. For a personal workspace, leave the Current Account option selected. Otherwise, select the Organization option.
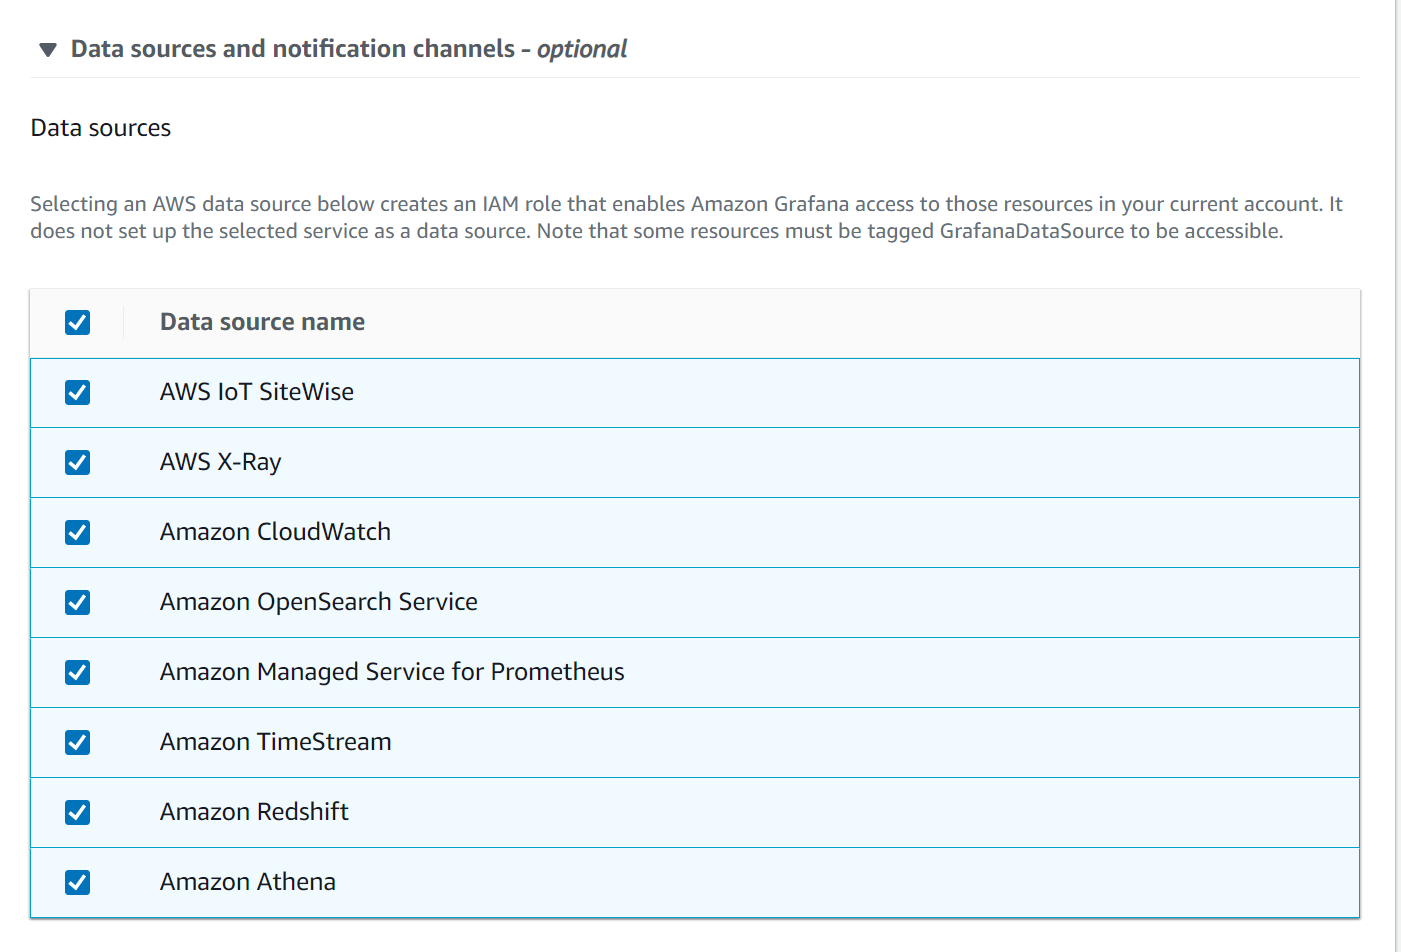
9. Scroll down to the Data sources section, and select a data source. But for this tutorial, select all available data sources since your focus is not on a particular data source.
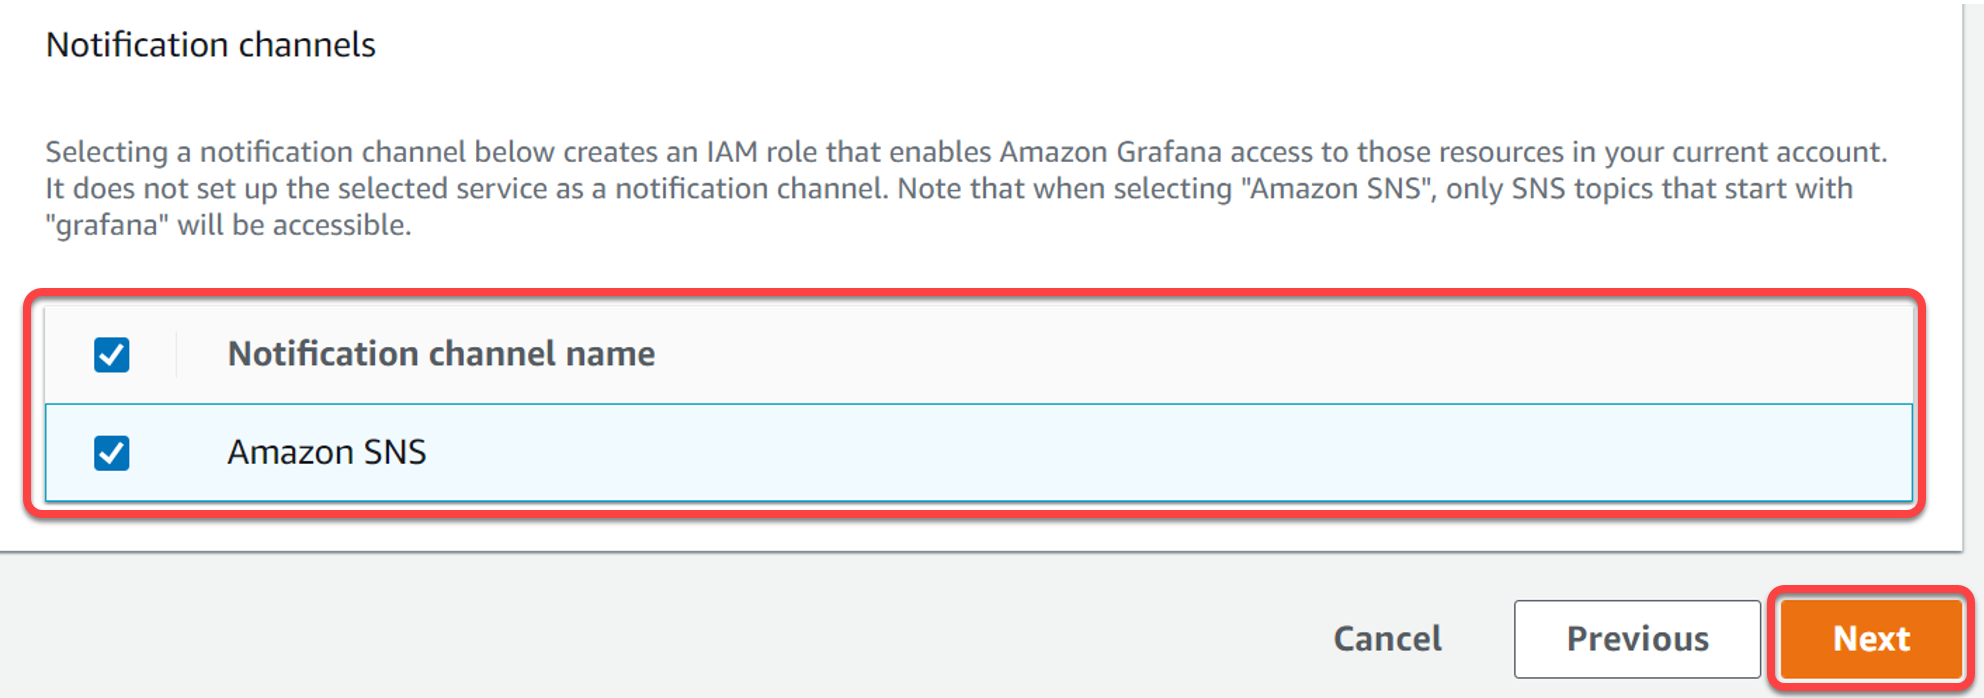
10. Under the Notification channels, select how you want to be notified about related information on your workspace, and click Next.
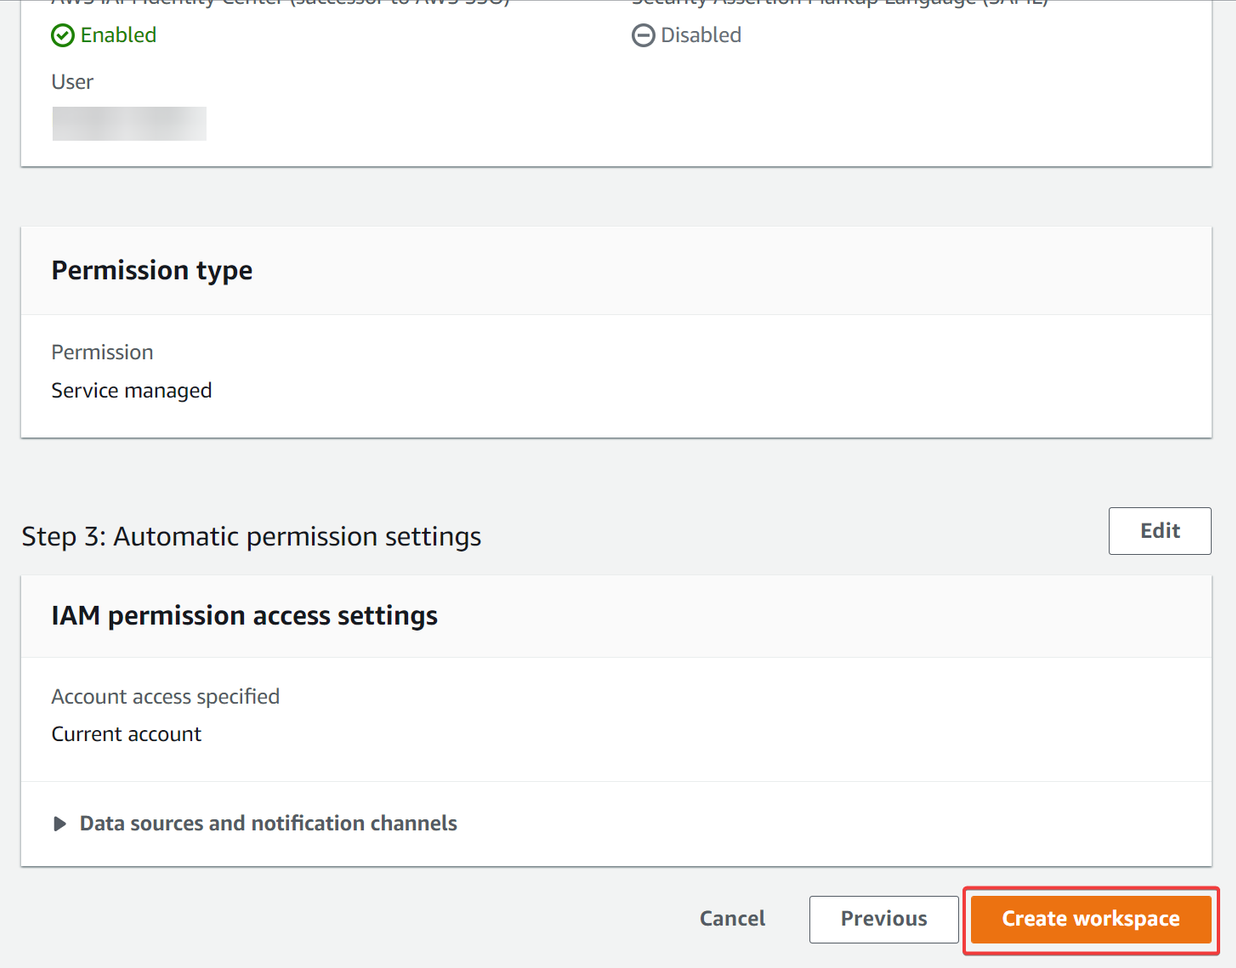
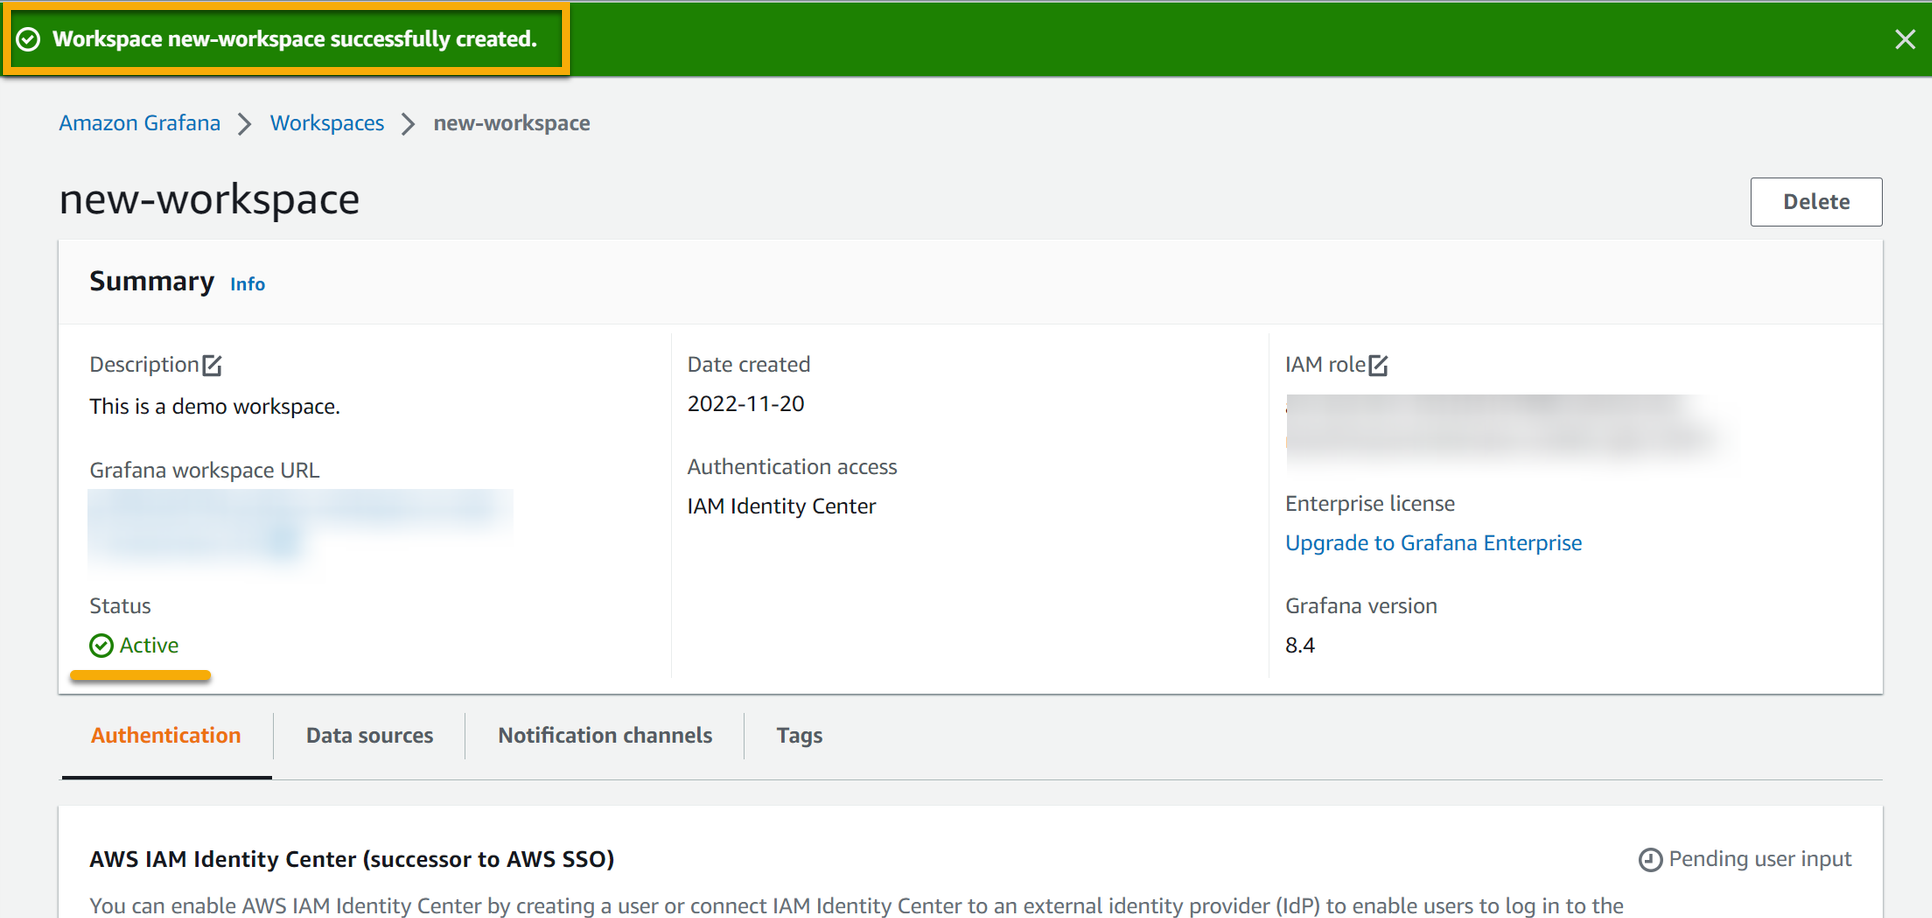
11. Finally, review your selected settings, and click Create Workspace to finalize creating your workspace.
Once created, your browser redirects to your new workspace, as shown below.
Assigning User to Workspace
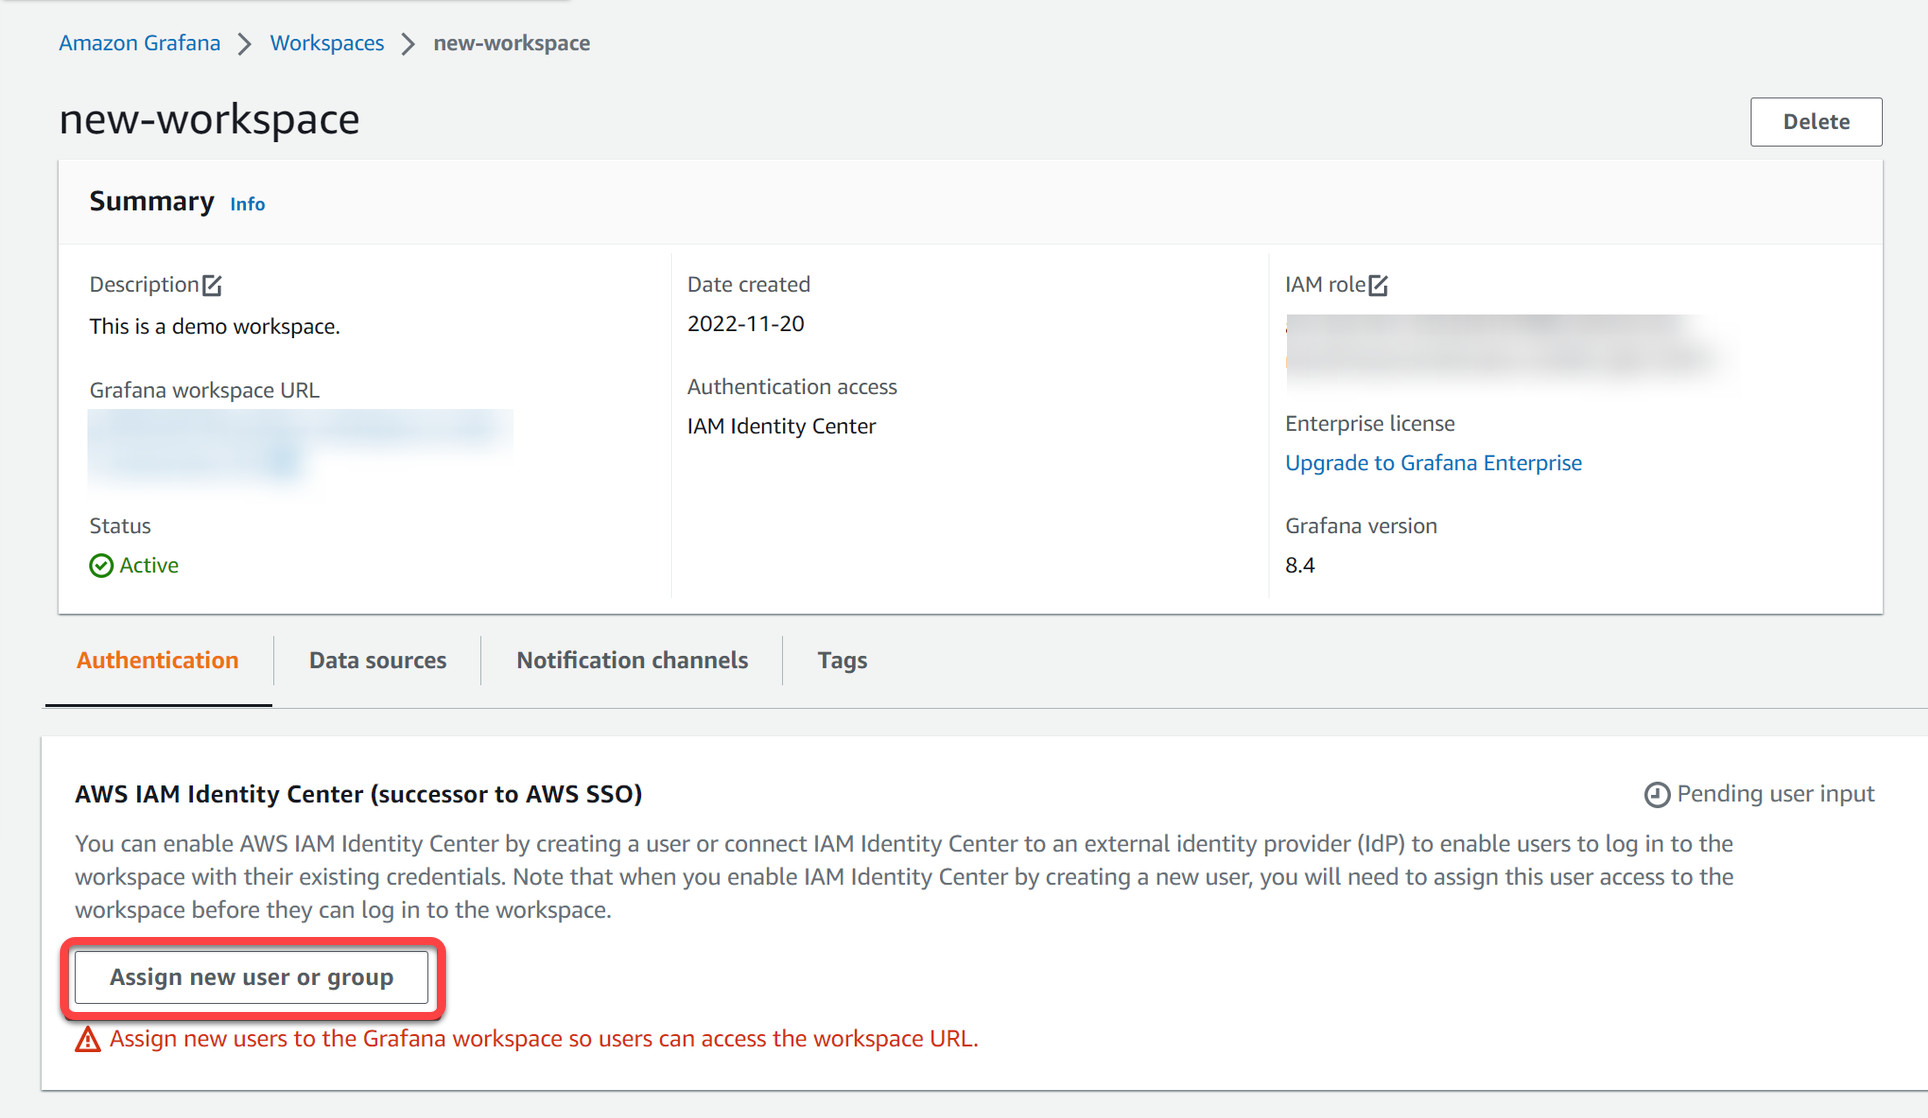
Remember the user you created to enable the AWS IAM Identity Center? You must assign that user to your workspace since it does not have access to your workspace by default.
To assign a user to your workspace:
1. Under the Authentication tab, click Assign new user or group to initiate assigning a new user.
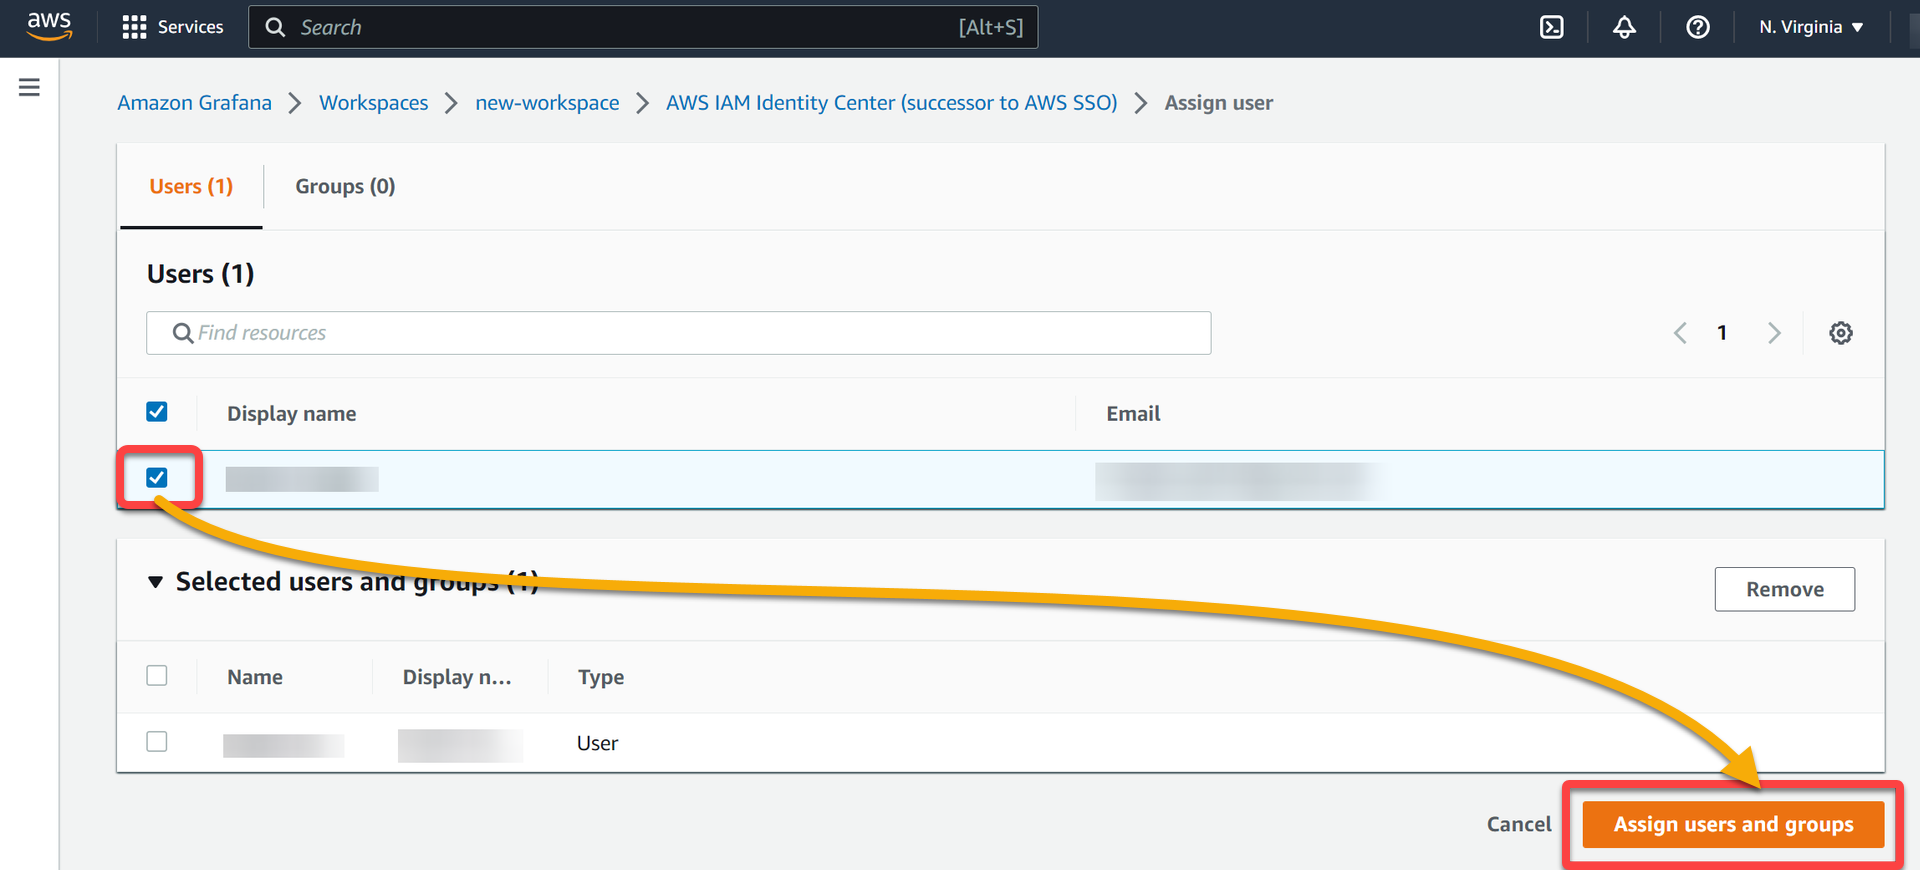
2. Select your target user, and click Assign users and groups to assign the user to your workspace.
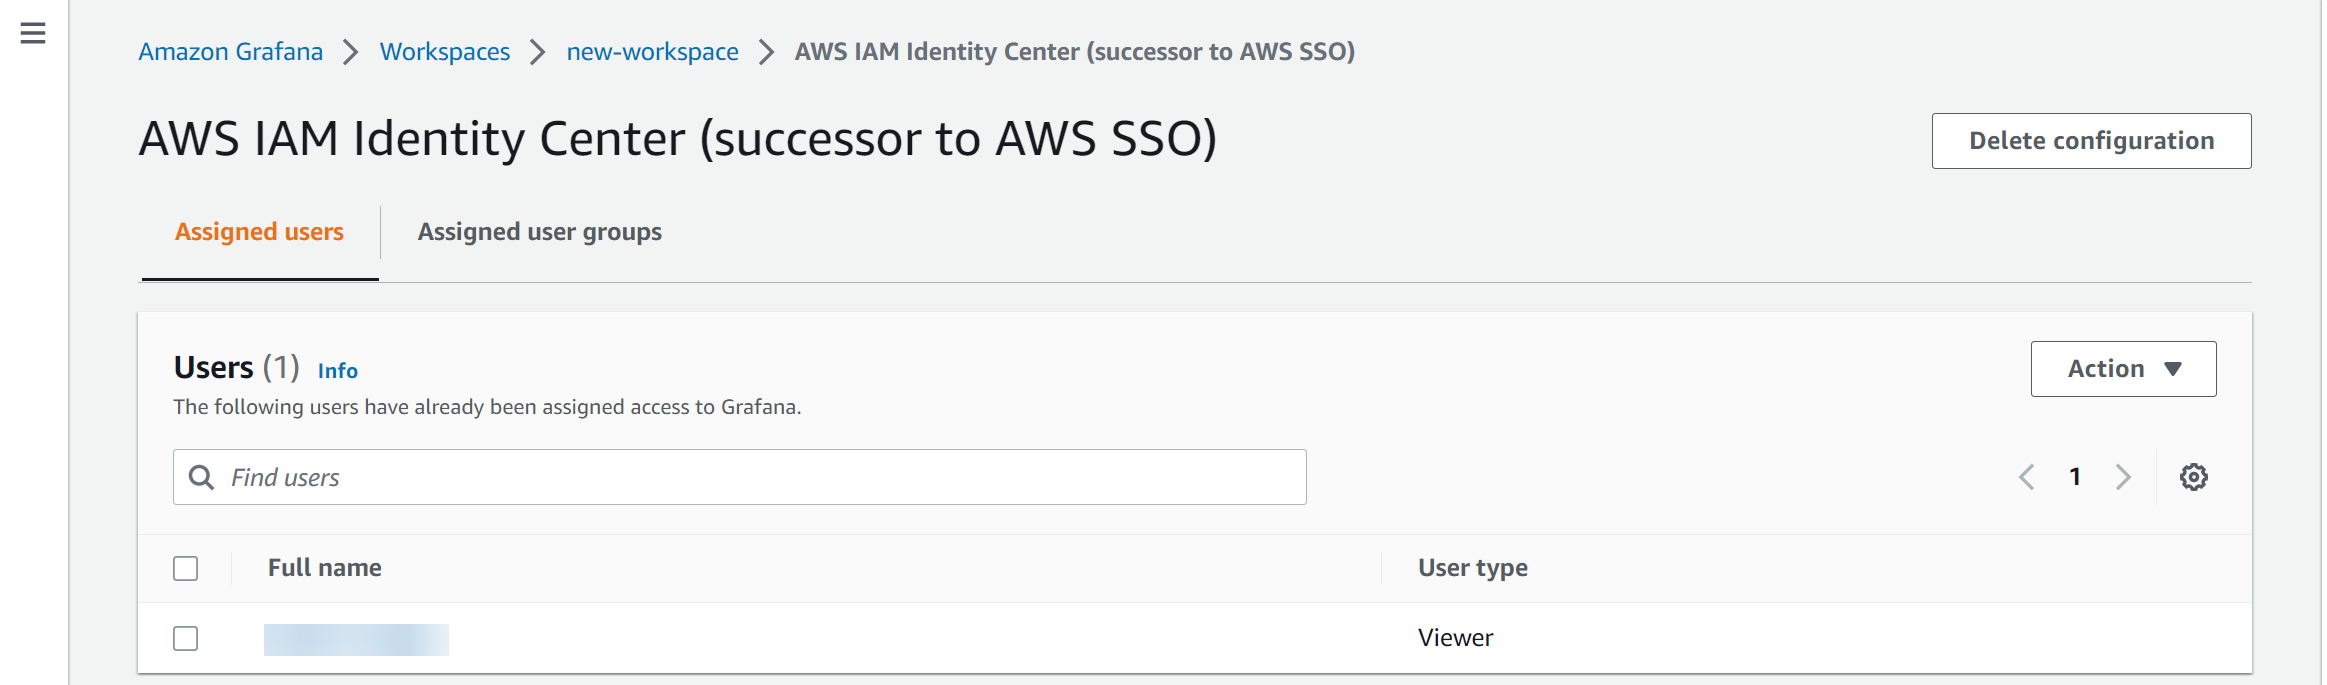
Once assigned, you will see the user gets viewer rights or access to your workspace. Confirming assigned user has rights to view Grafana console
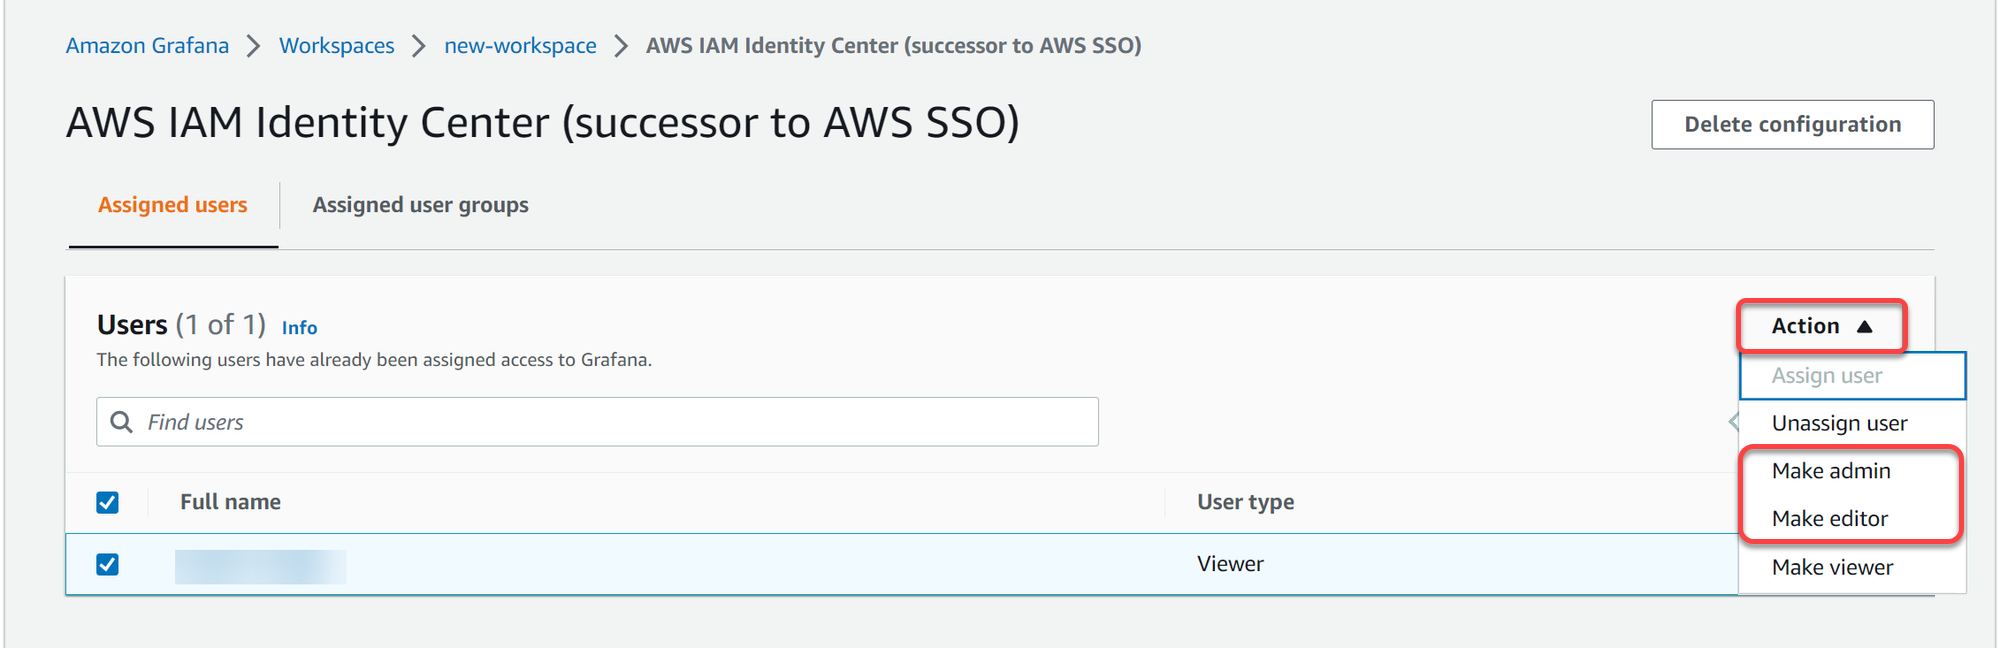
3. Now, click on the Actions dropdown to grant admin or editor access to the user.
Creating an AWS Grafana Dashboard
Now that the configuration and permission settings are out of the way, it is time to work on your AWS Grafana dashboard. This dashboard is where you can manage your data visualizations.
To create an AWS Grafana Dashboard:
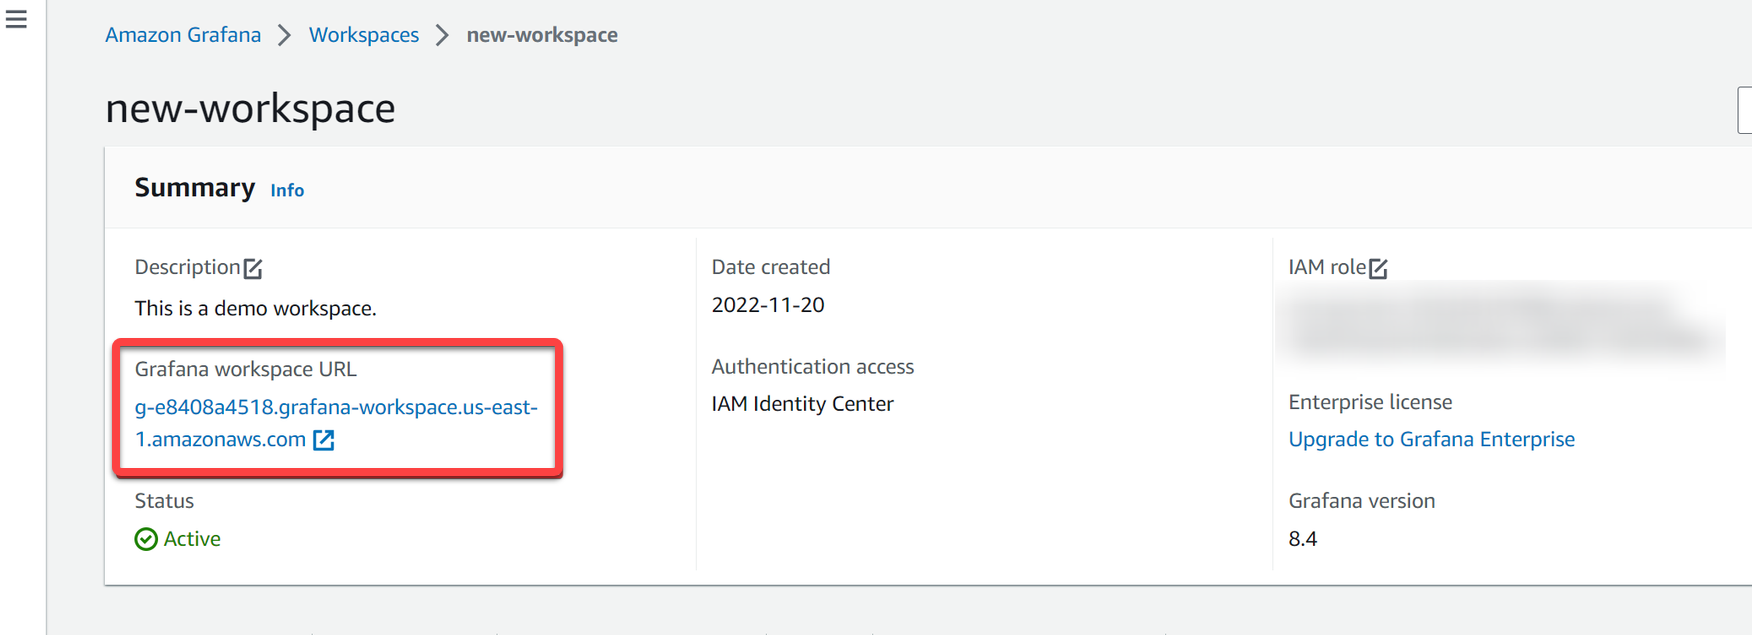
1. Navigate to your workspace, and click on the Grafana workspace URL, as shown below, to access your Grafana home page.
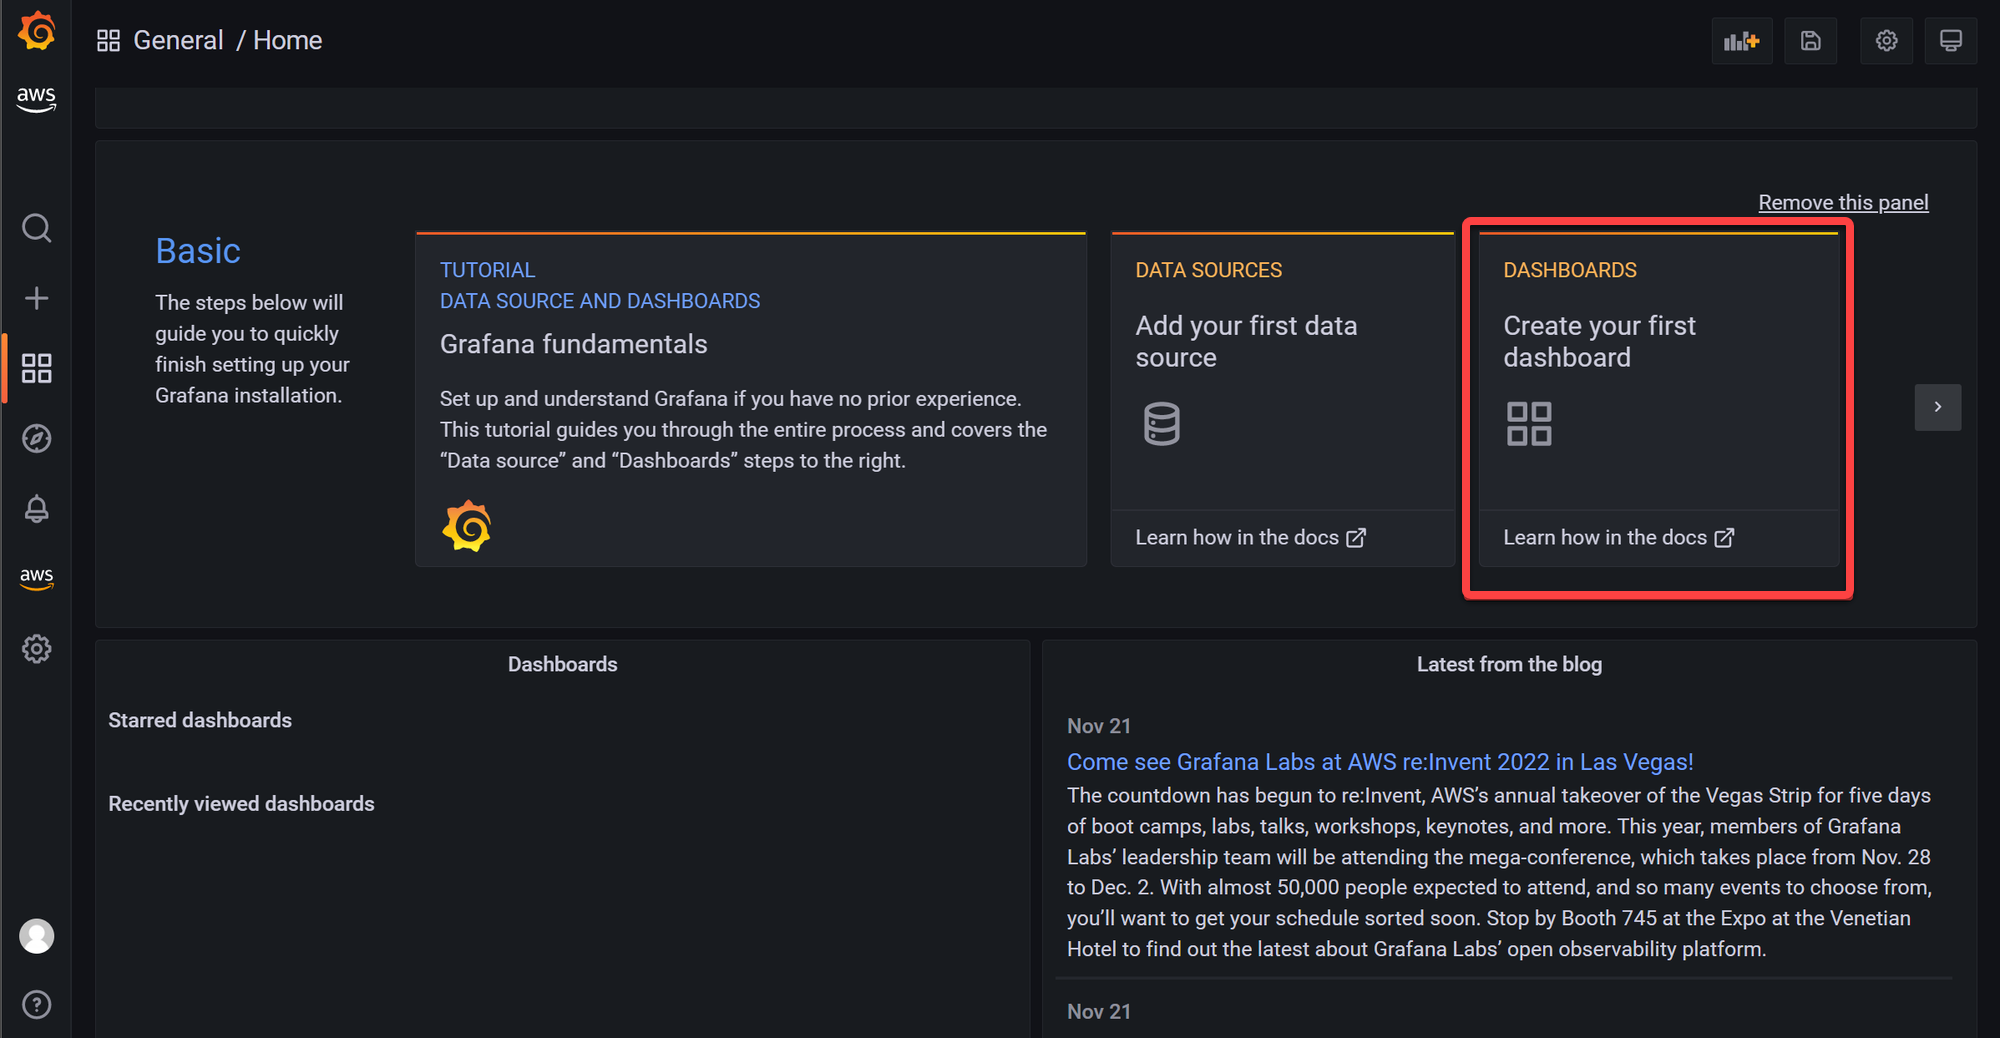
2. Next, click Create your first dashboard on the Grafana home page to create a new dashboard
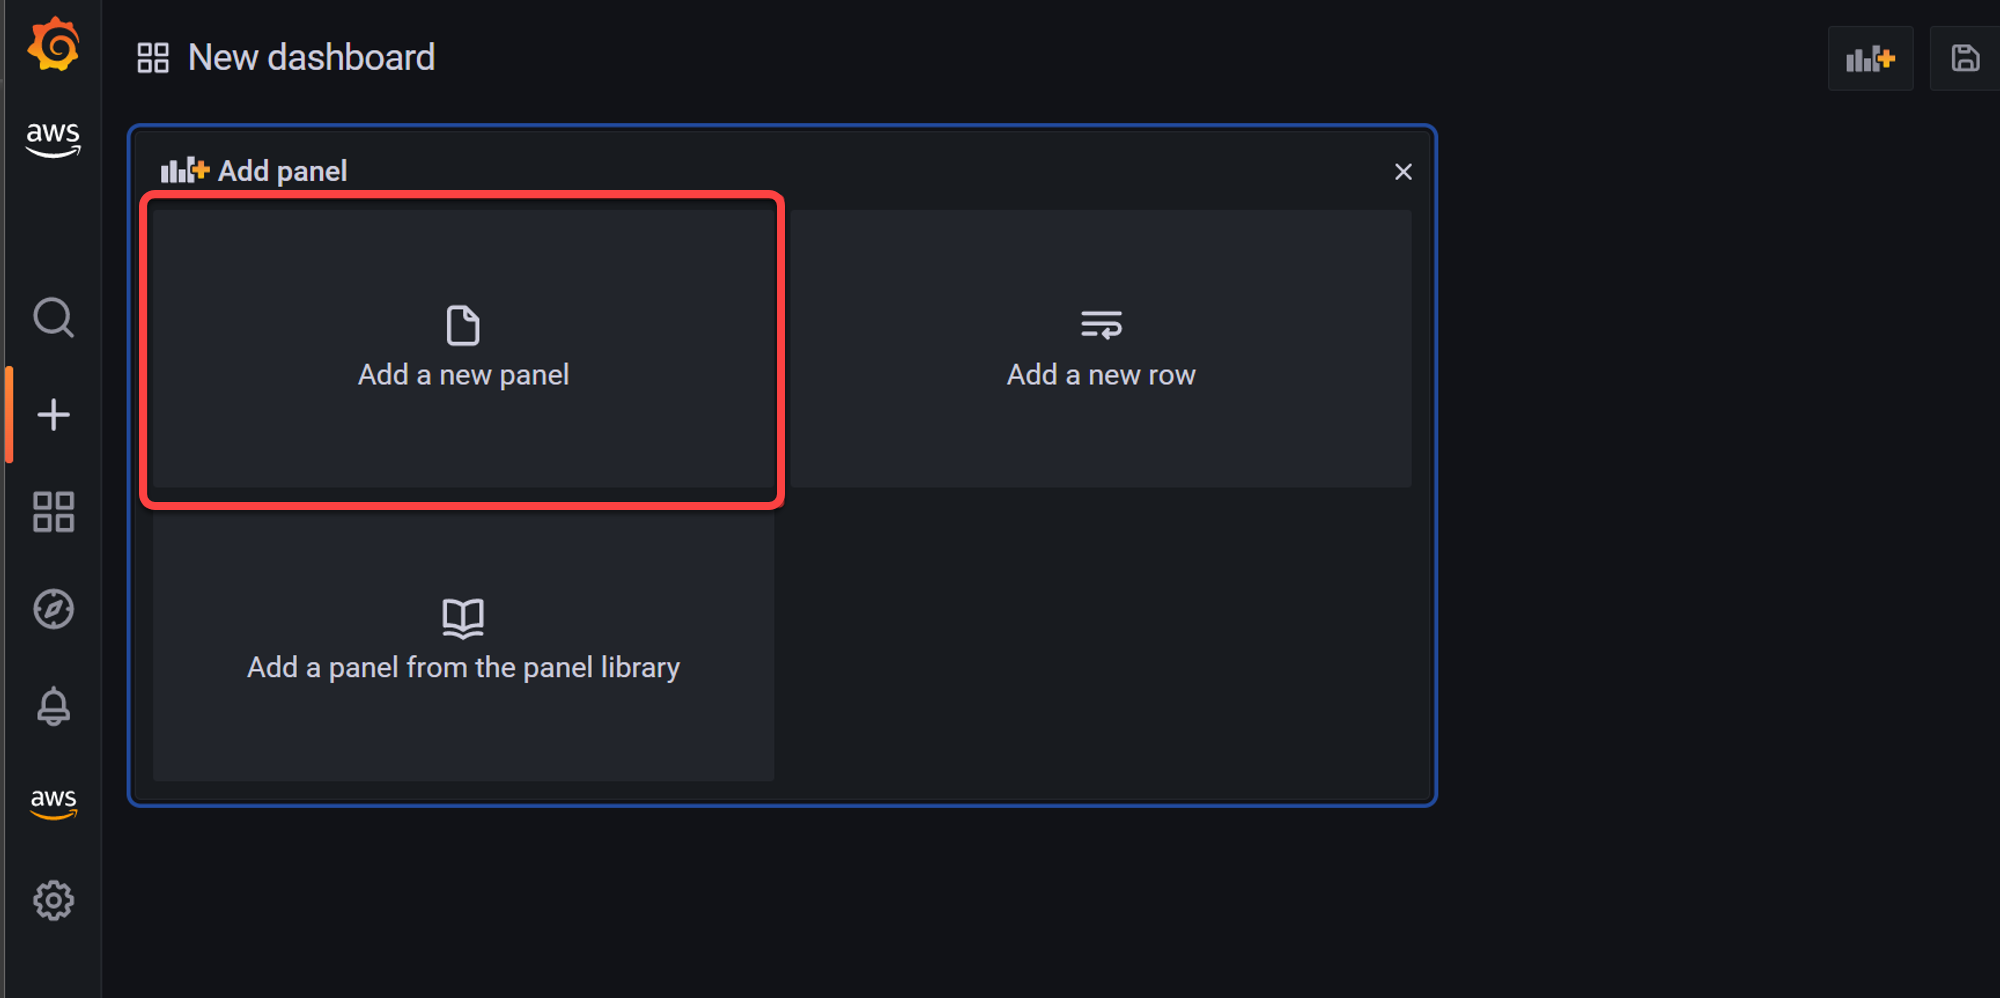
3. On your new dashboard, click Add a new panel to a new panel that lets you add a data source from a Query tab.
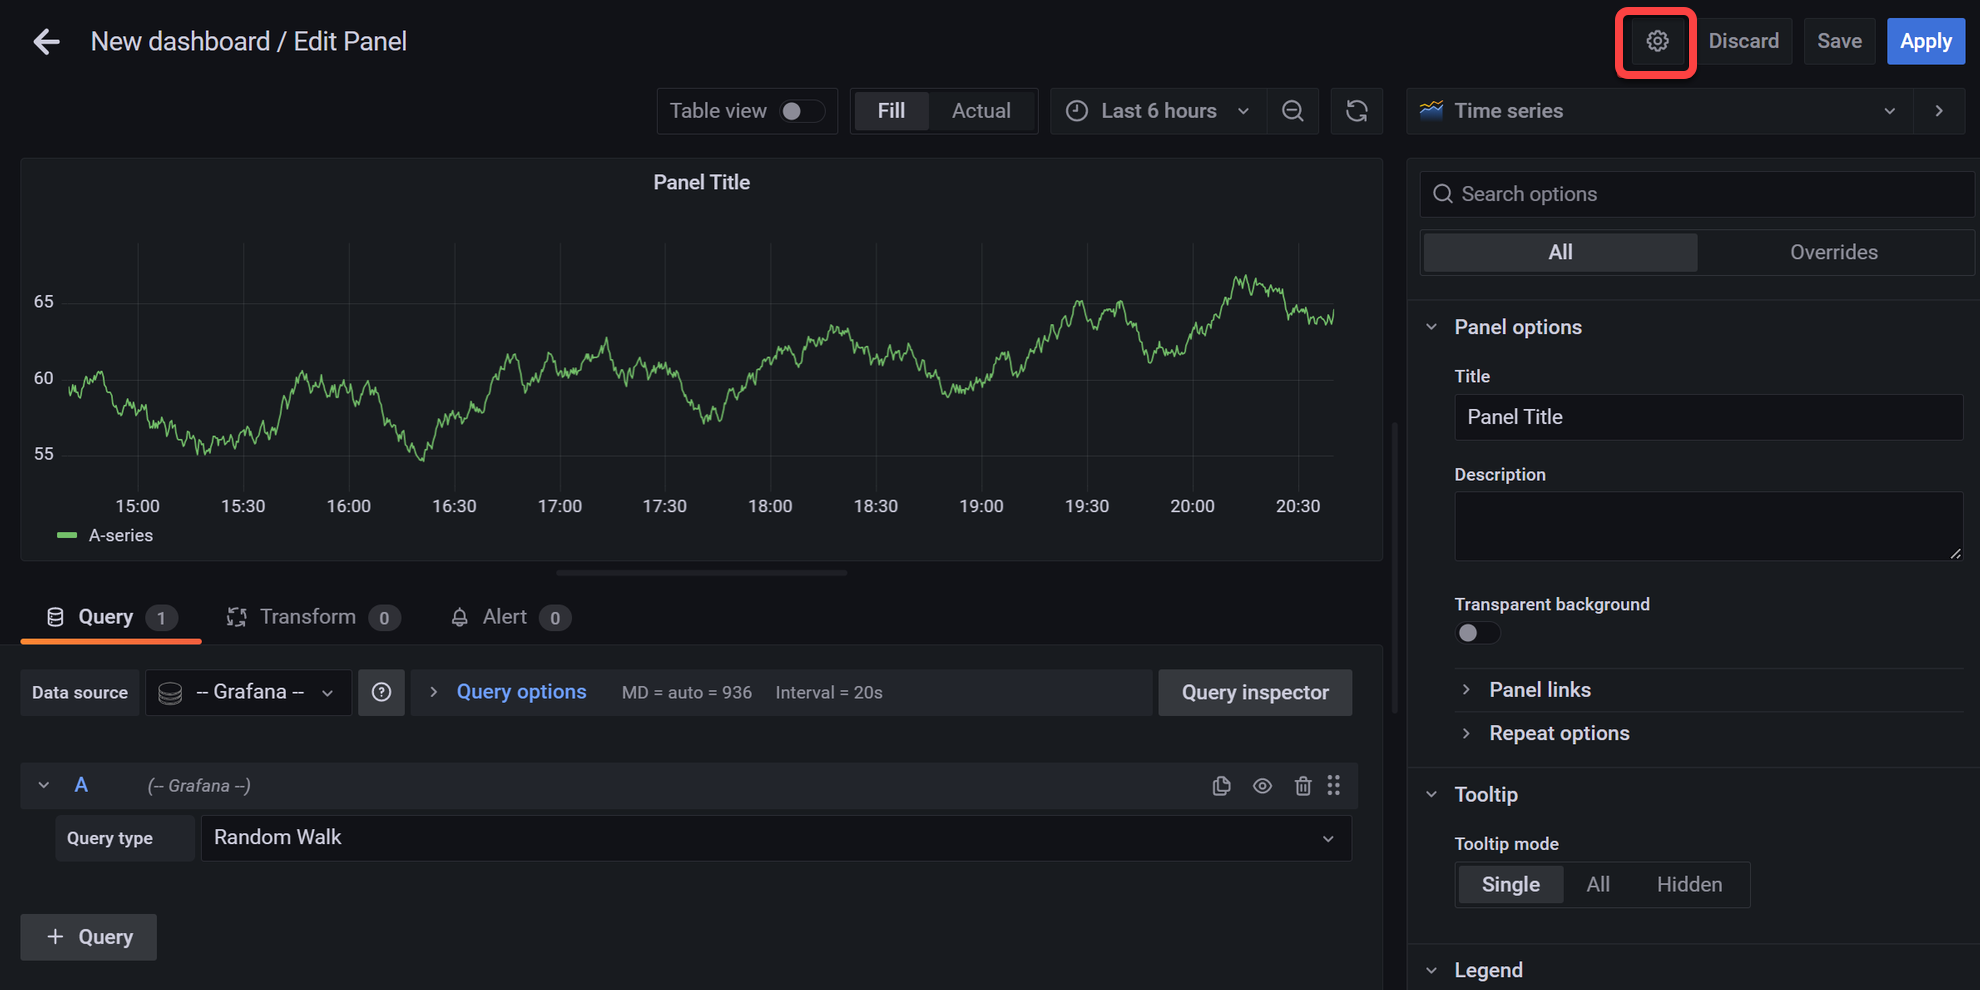
4. On the new panel, click the settings icon (upper-right) to access your dashboard settings.
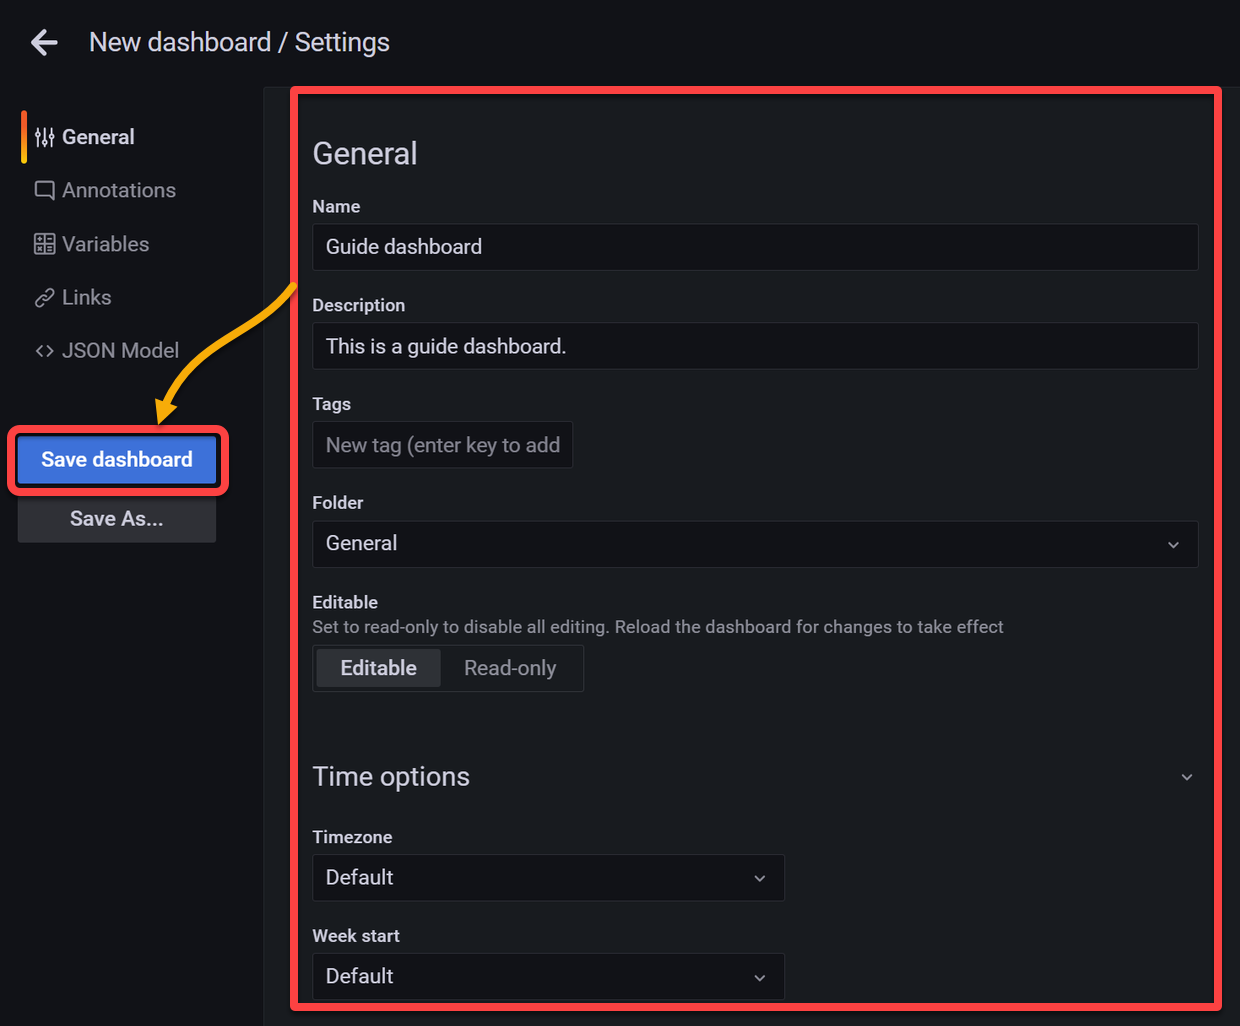
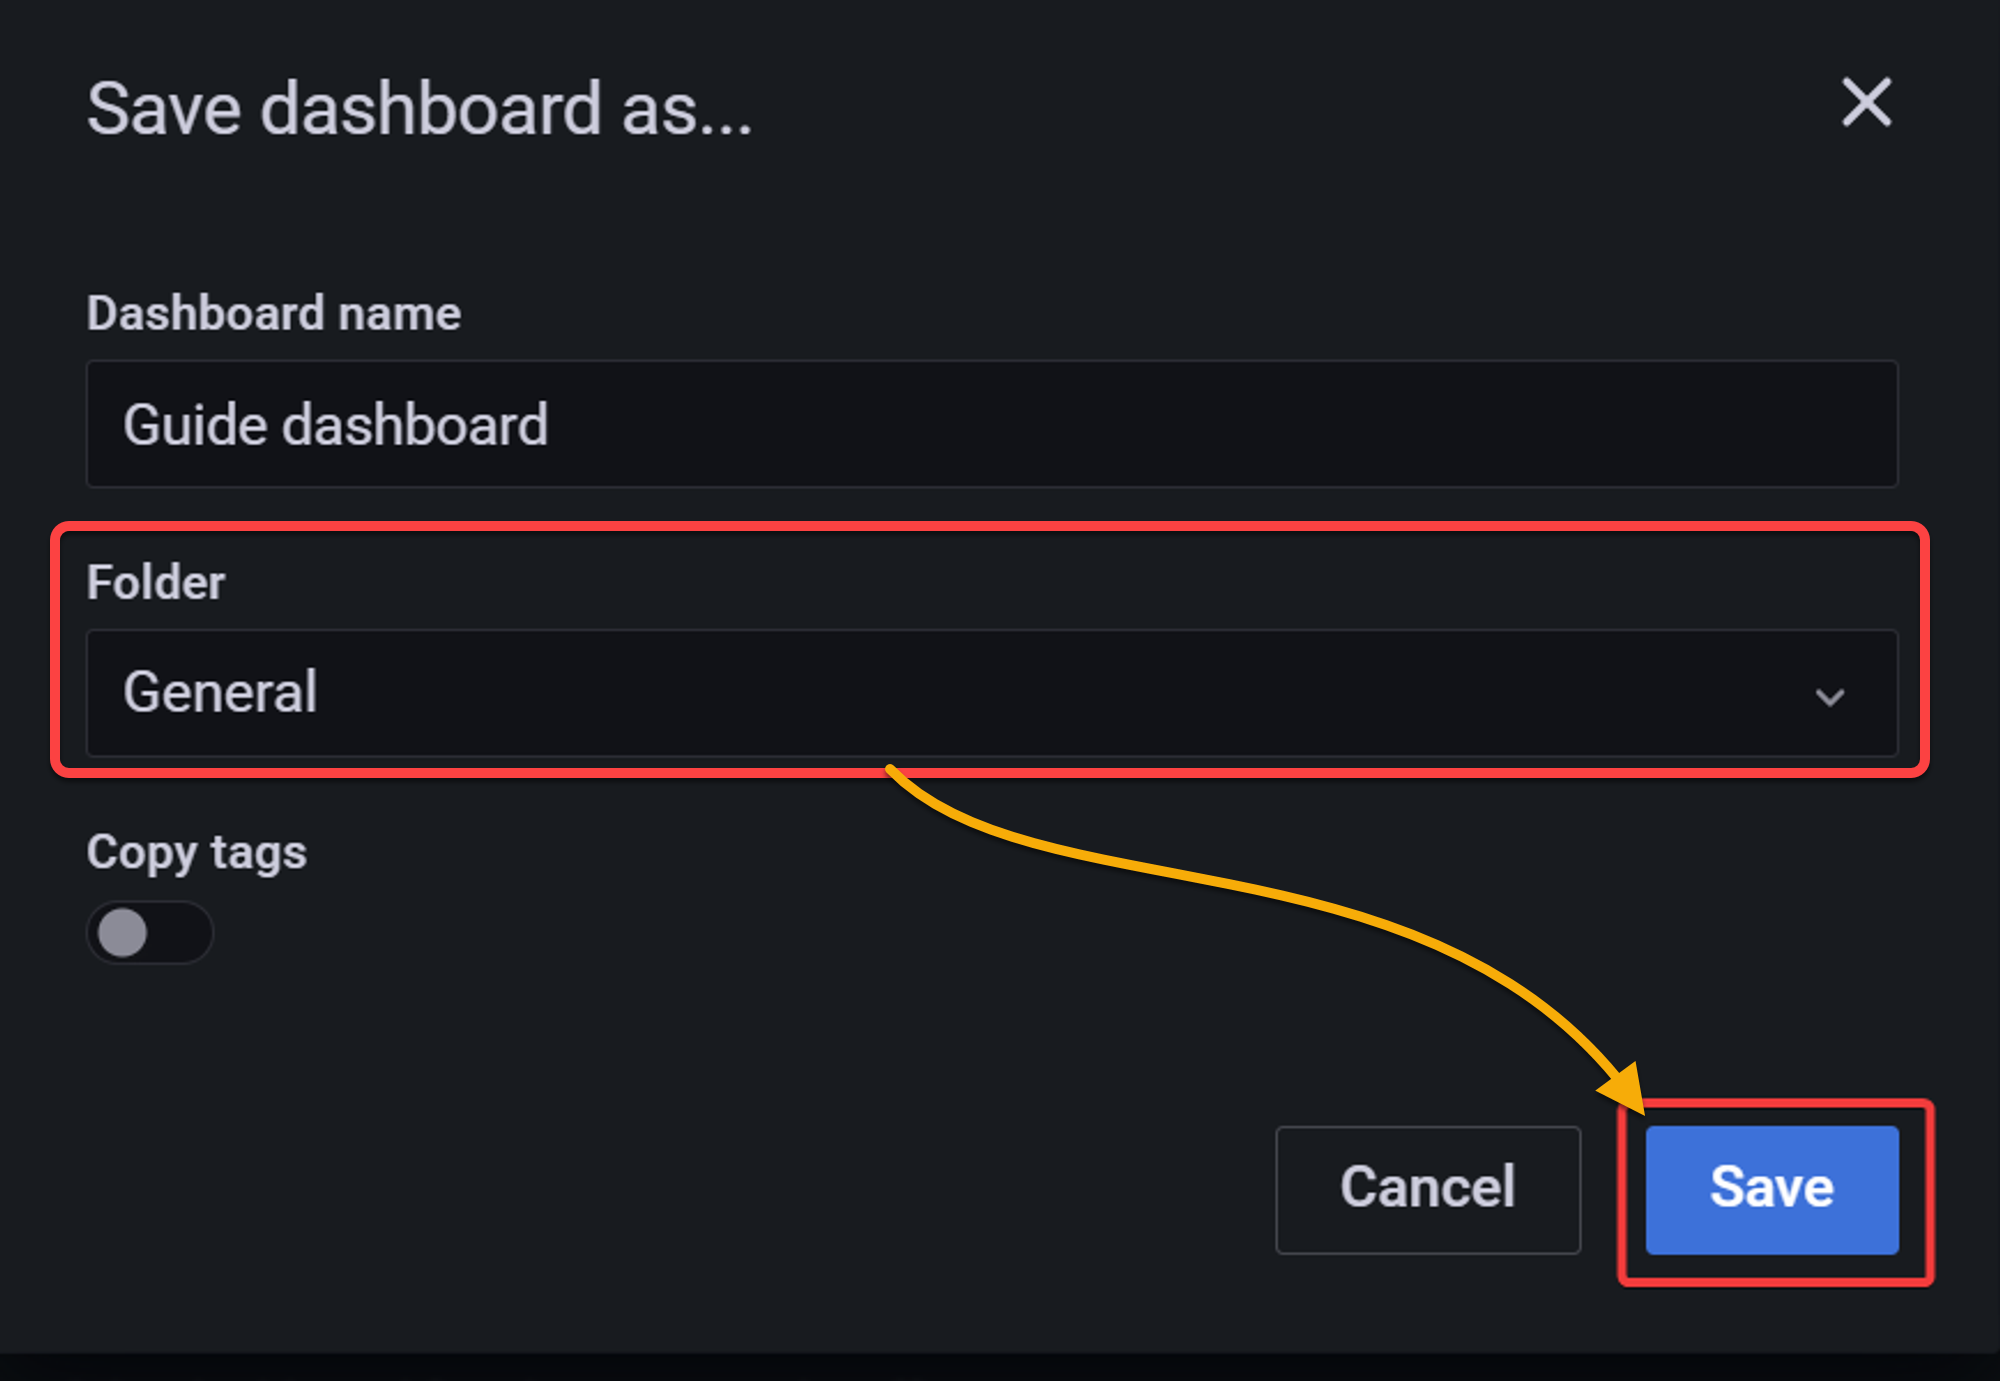
5. Now, configure your dashboard settings as you prefer, and click Save dashboard.
6. When prompted, leave the General folder selected, or choose your own and click Save.
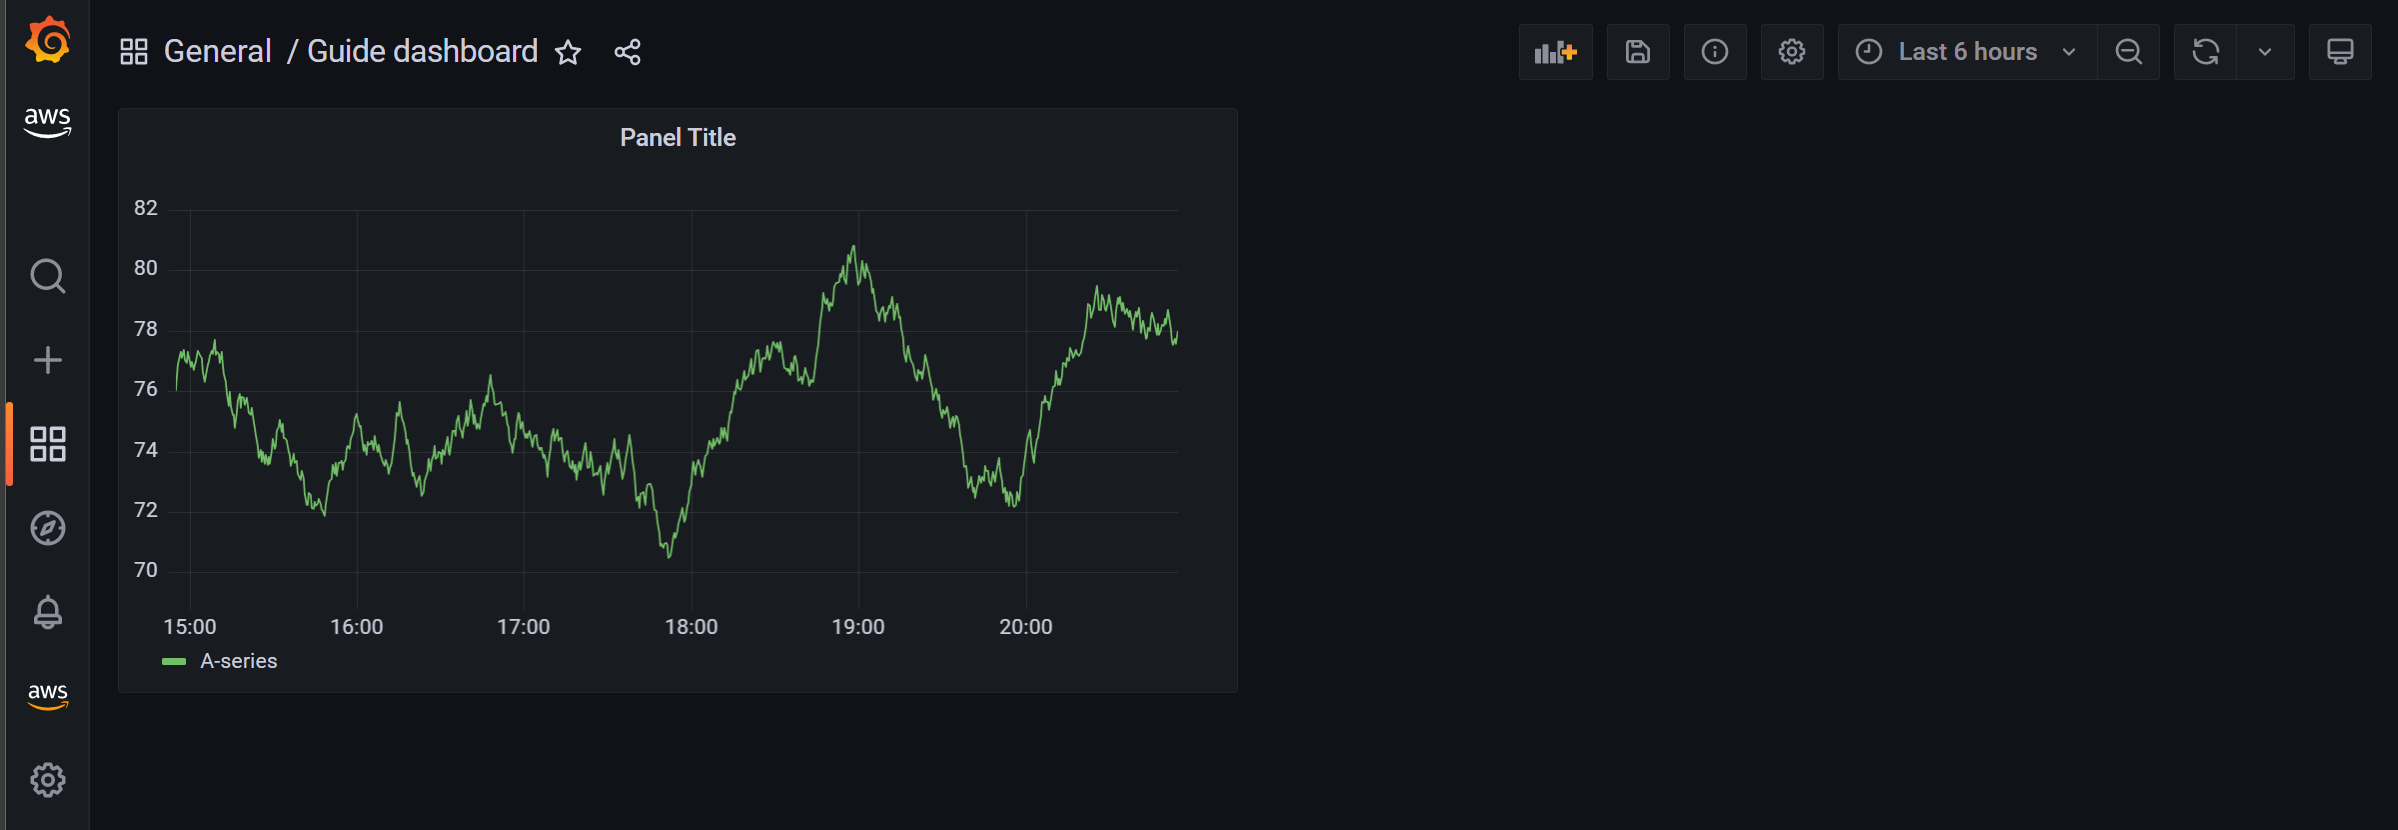
Once done, your dashboard should look like the one below.
Adding a Data Source to the Workspace
What you currently have on your dashboard is only a generic panel with no data. You must connect a data source to the workspace and visualize the data.
To add a data source to your workspace:
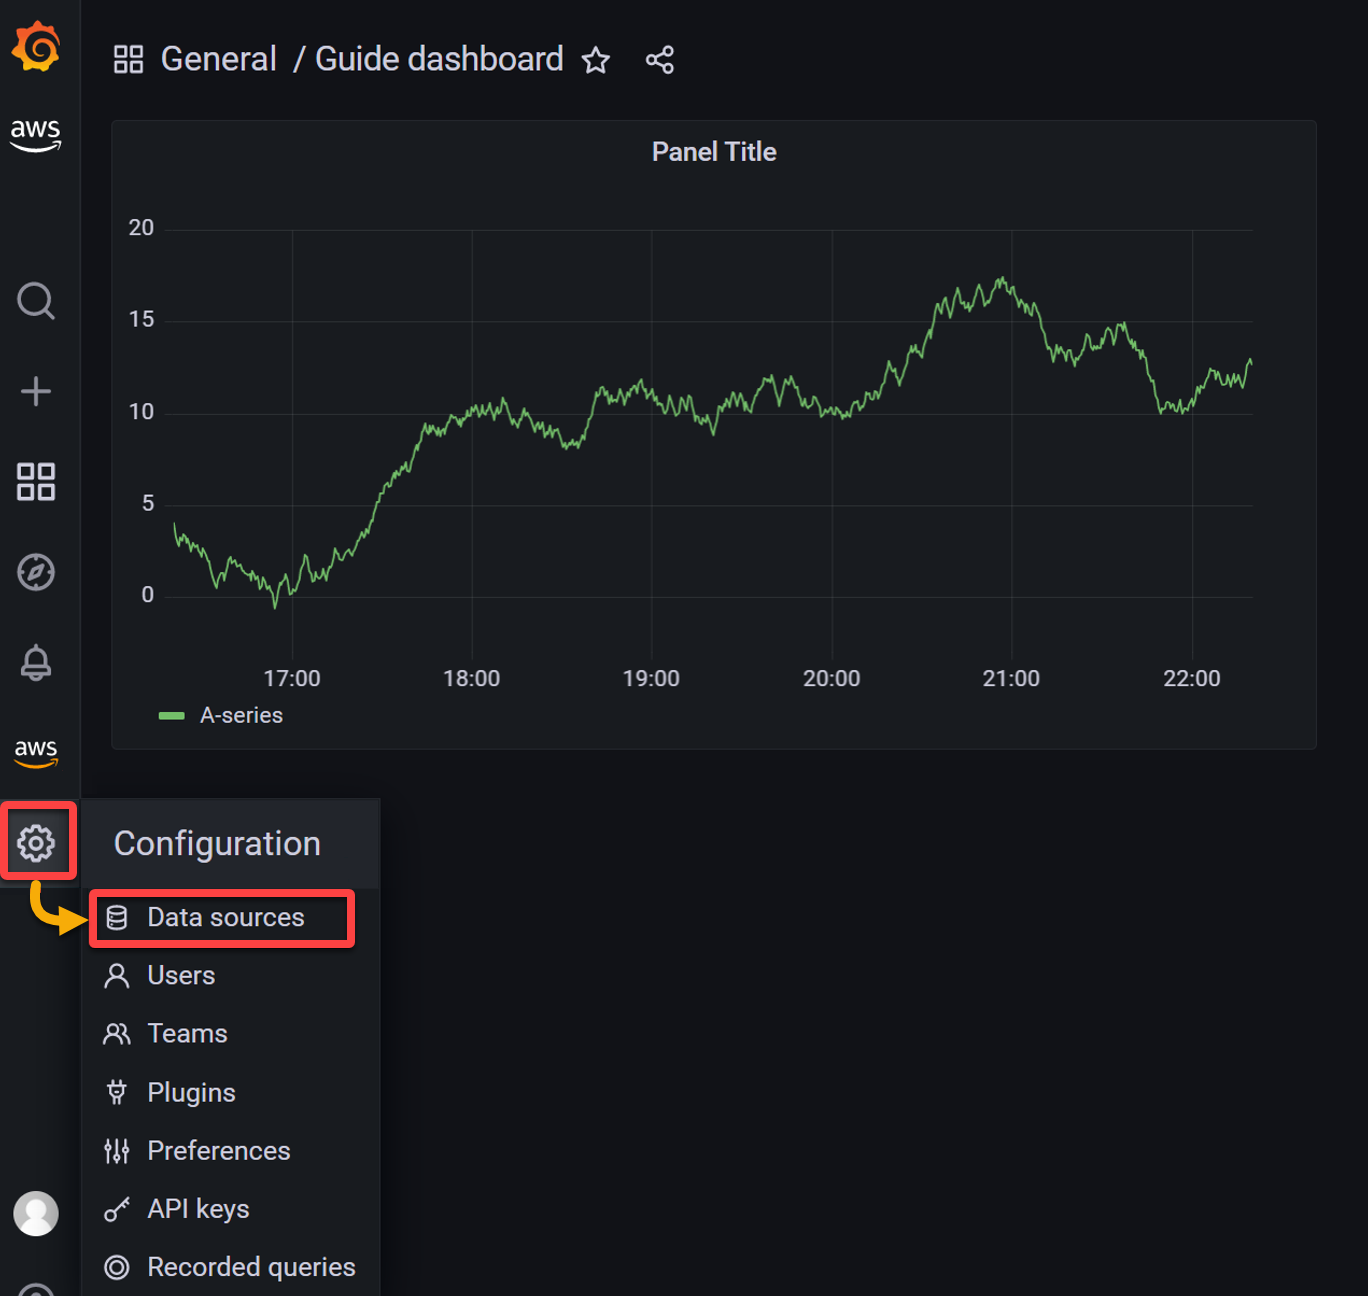
1. On your dashboard, click the settings icon (left panel) and click Data sources to initiate adding data sources.
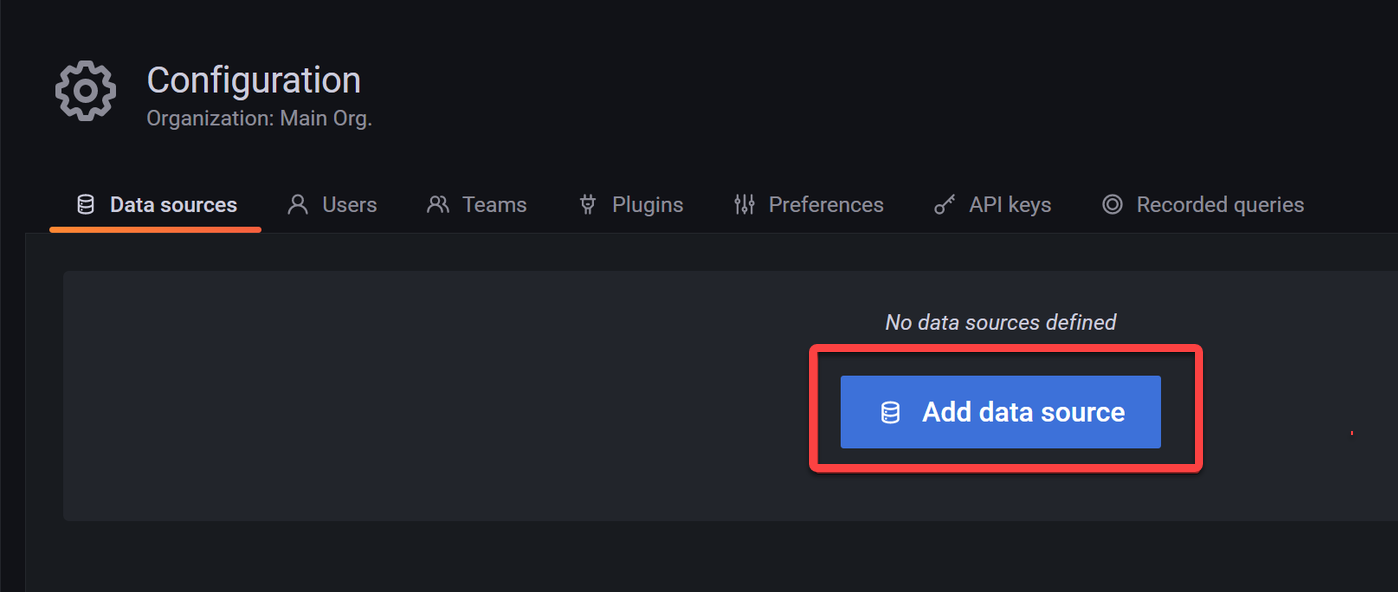
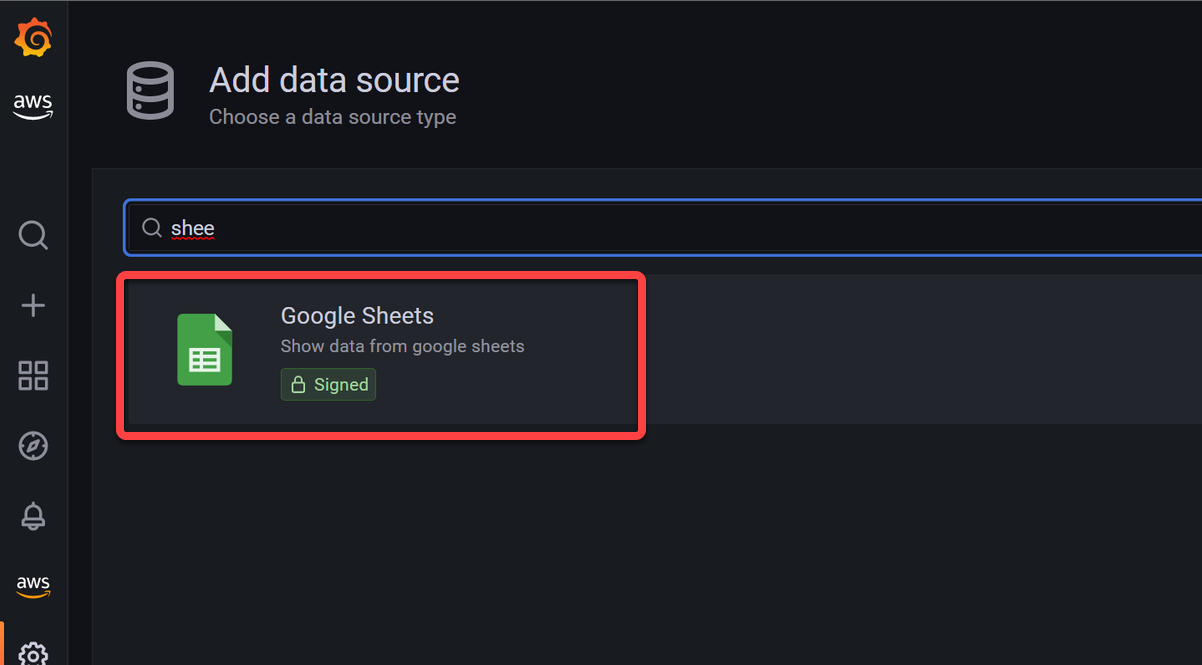
2. Next, click on Add data source to view the list of data sources you can configure for your dashboard.
3. Search for sheets and select Google Sheets to demonstrate how to add visual data through a data source.
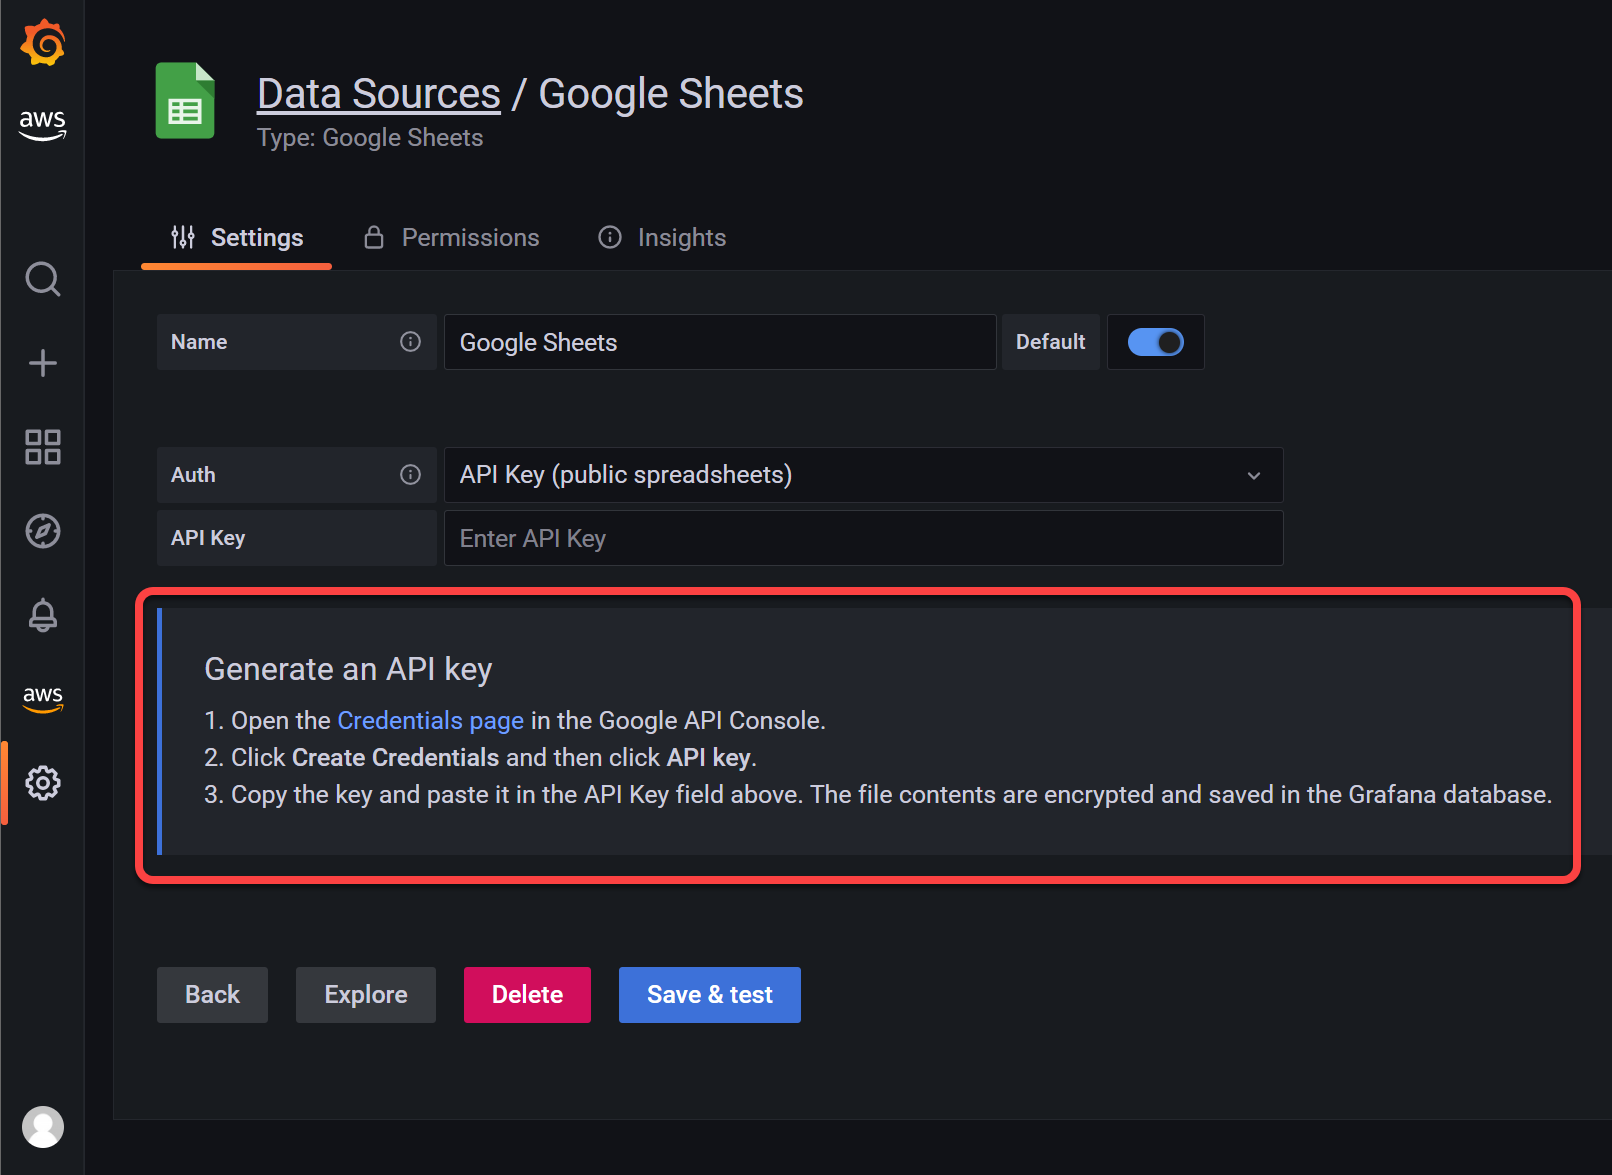
4. Now, generate a Google API key following the instructions as shown below.
💡 If you are new to the Google Cloud Platform (GCP), you must create a project before generating an API key.
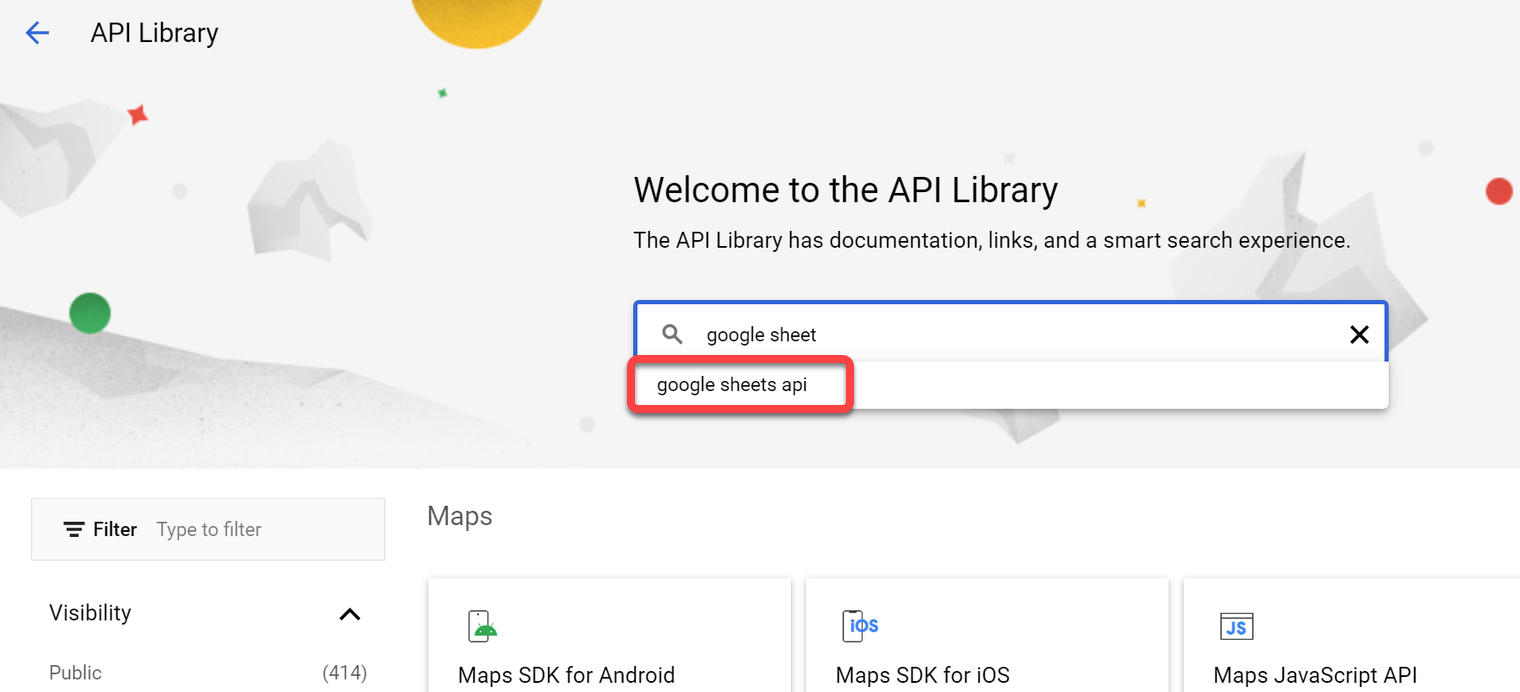
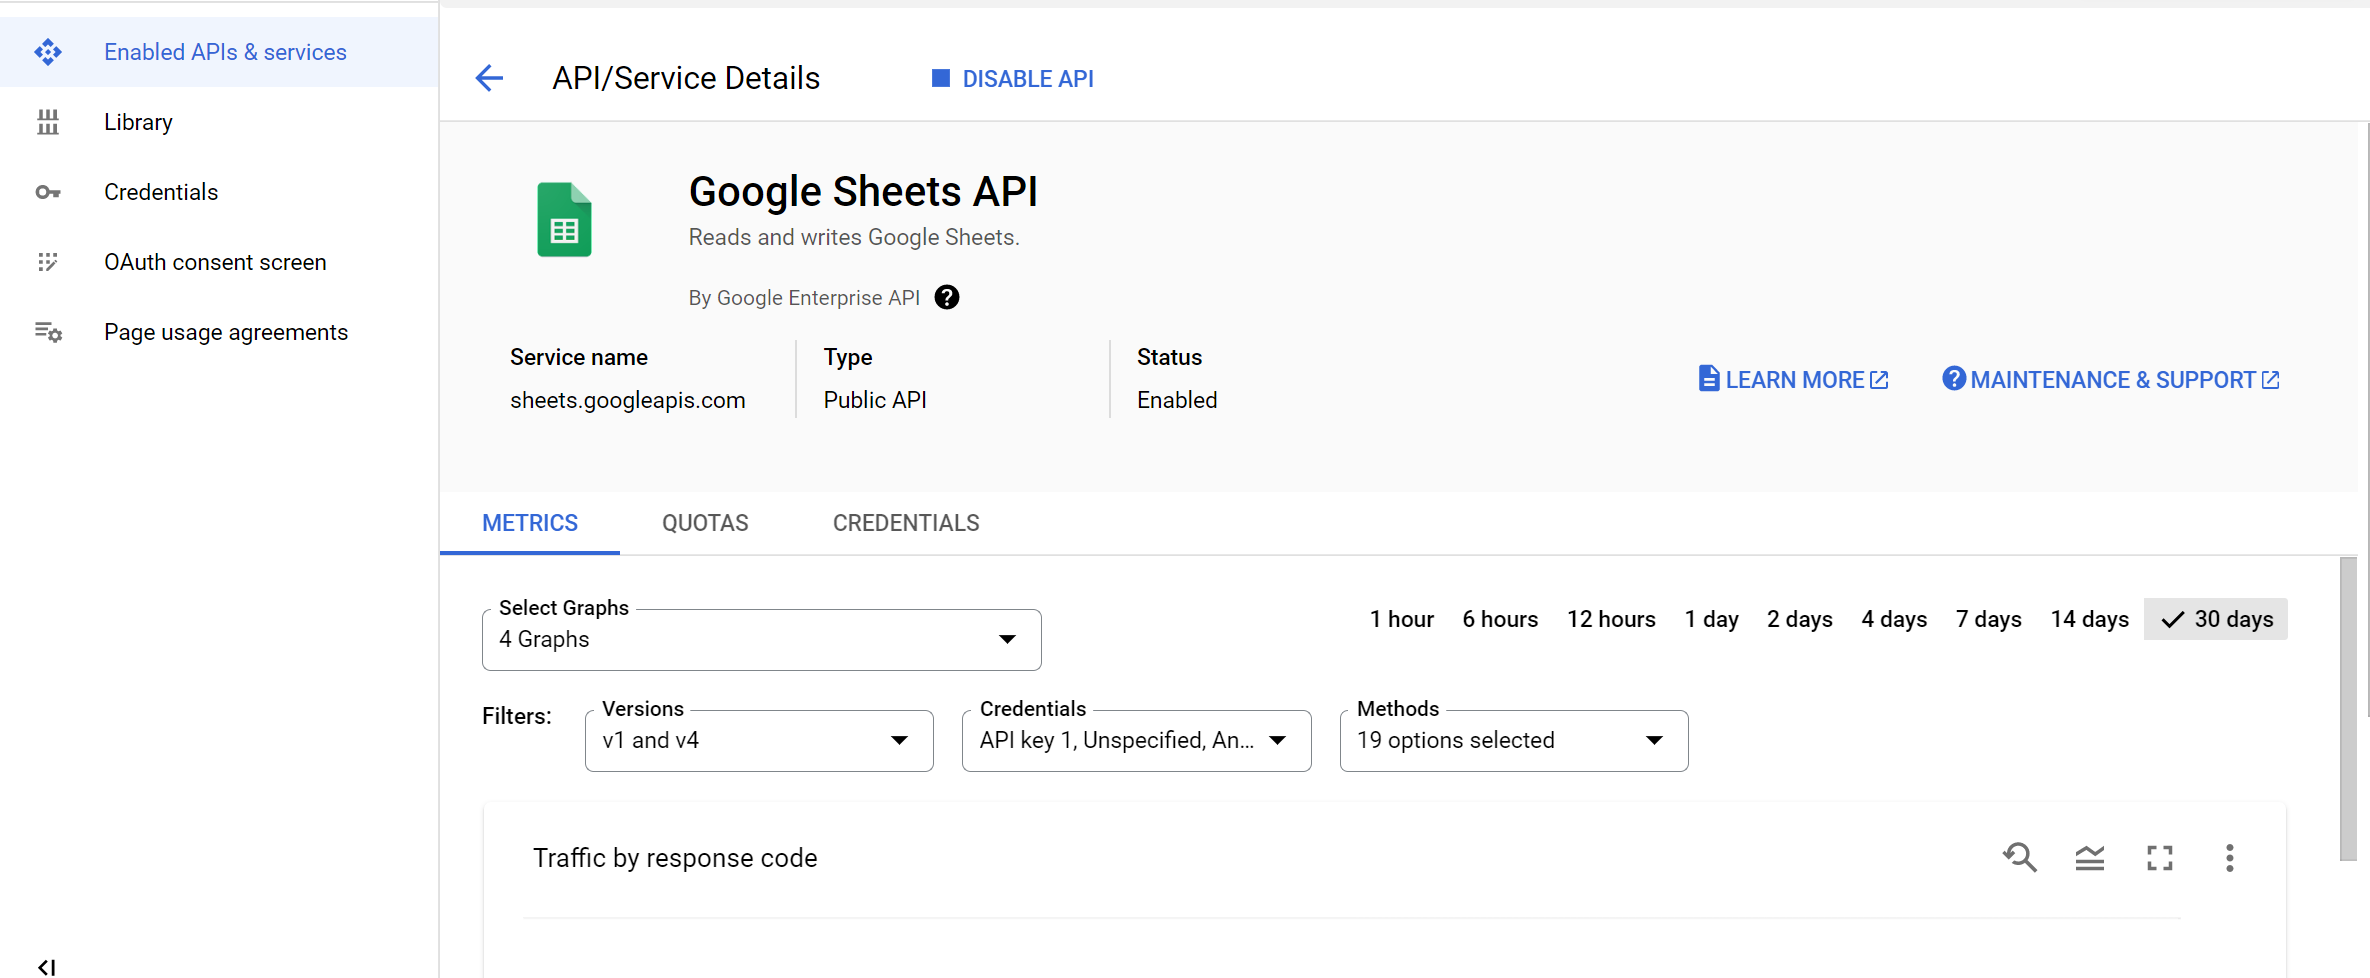
5. Once you have your API key, navigate to the API library in a new browser tab, and search for google sheet api.
6. Next, click ENABLE to start using Google Sheets API. This API enables you to access Google Sheets from your Grafana dashboard.
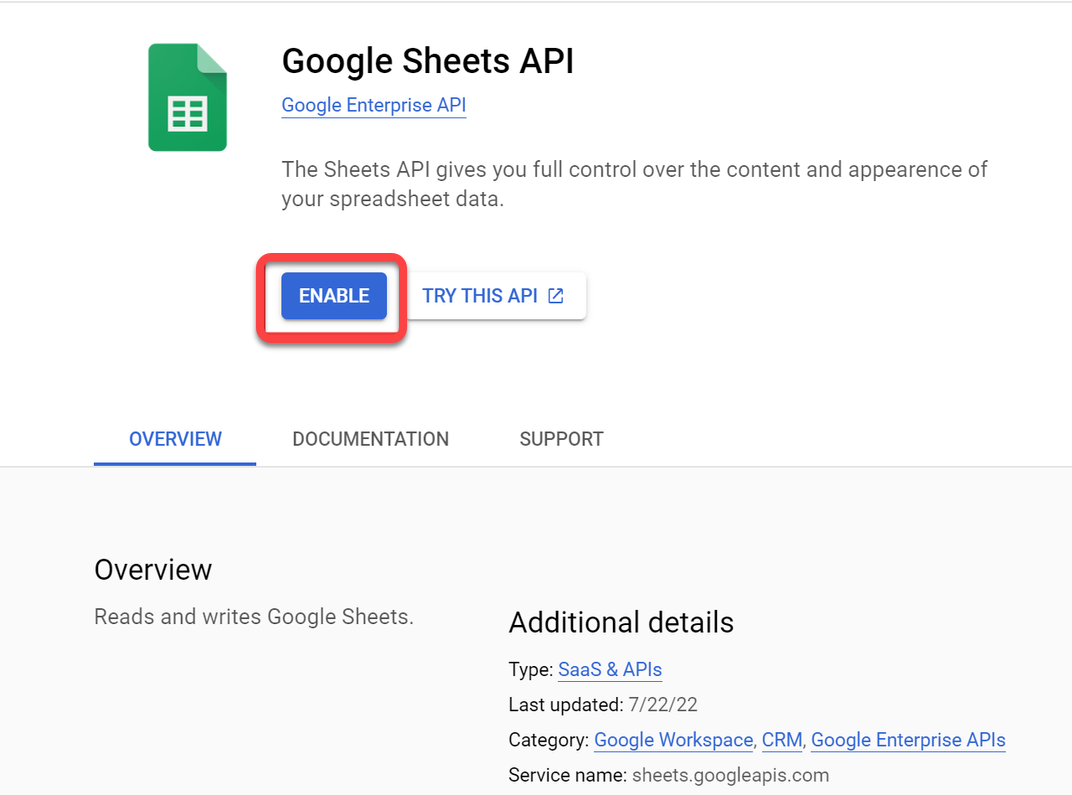
Once enabled, your browser redirects to the page shown below.
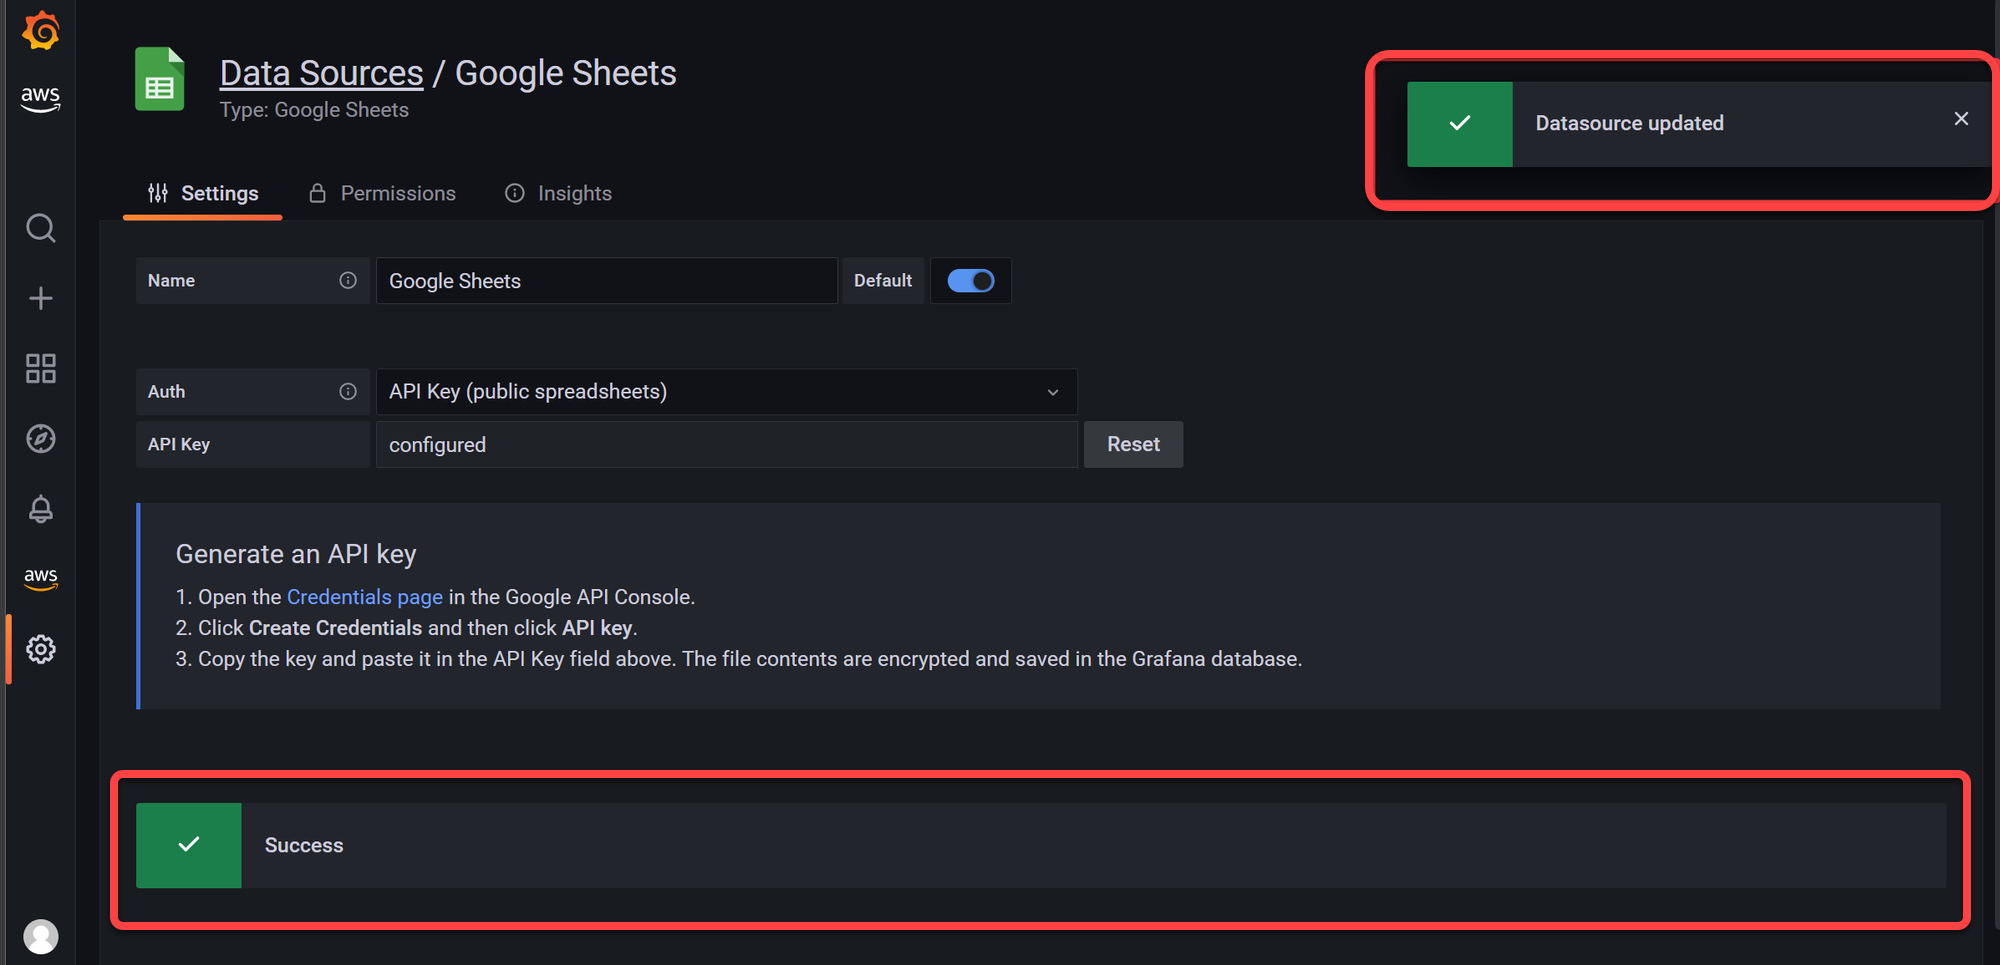
7. Switch to Grafana, input your API key, and click Save & Test to test the API connection
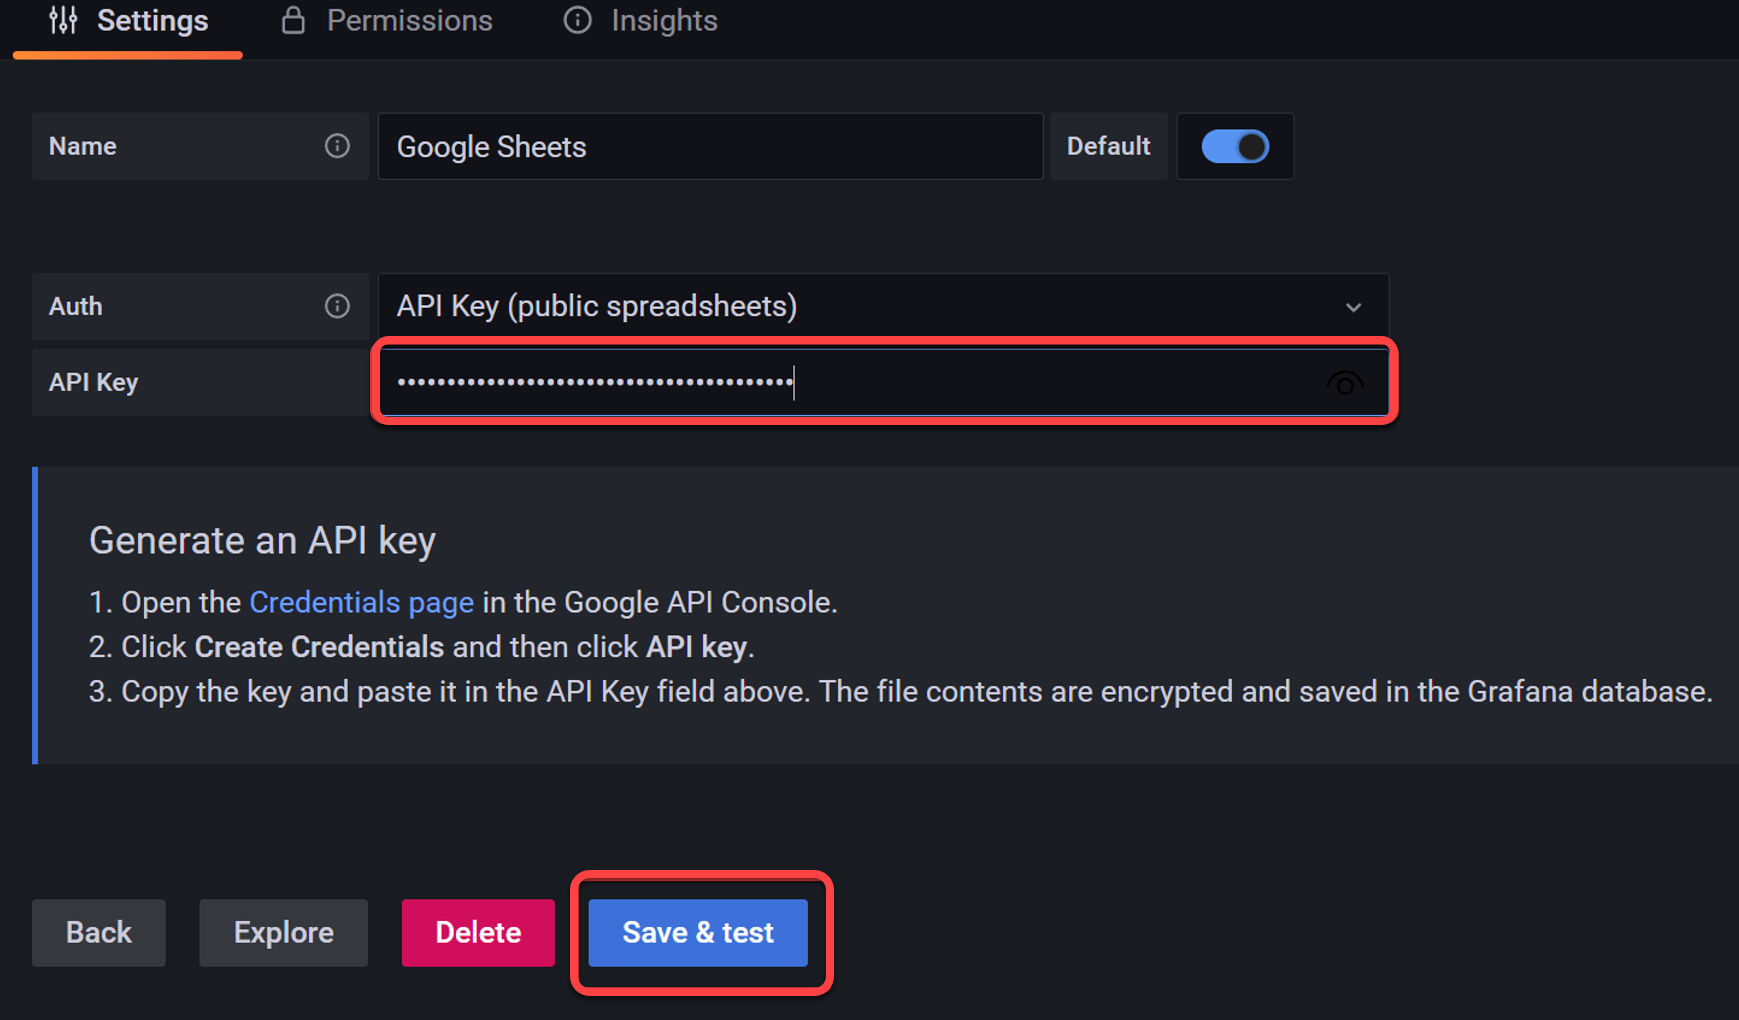
You should see a green Success message confirming the data source has been added.
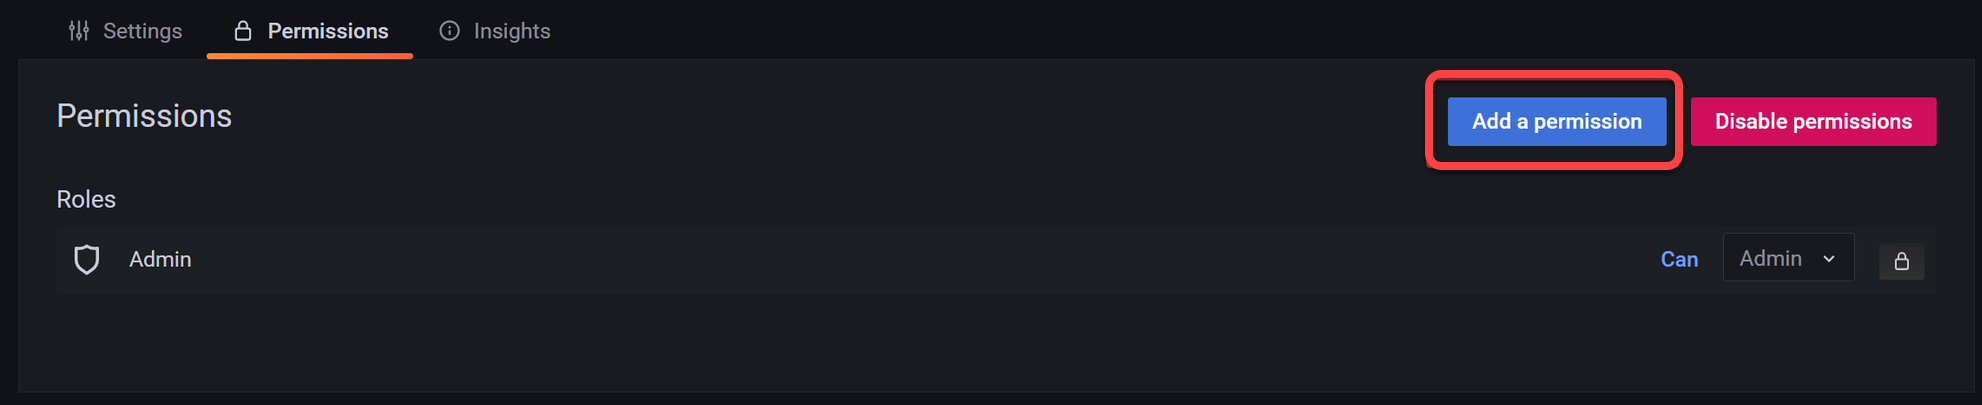
8. Navigate to the Permissions tab, and click Enable to enable permissions for your data source. Doing so lets your teammates query your dashboard or data source.
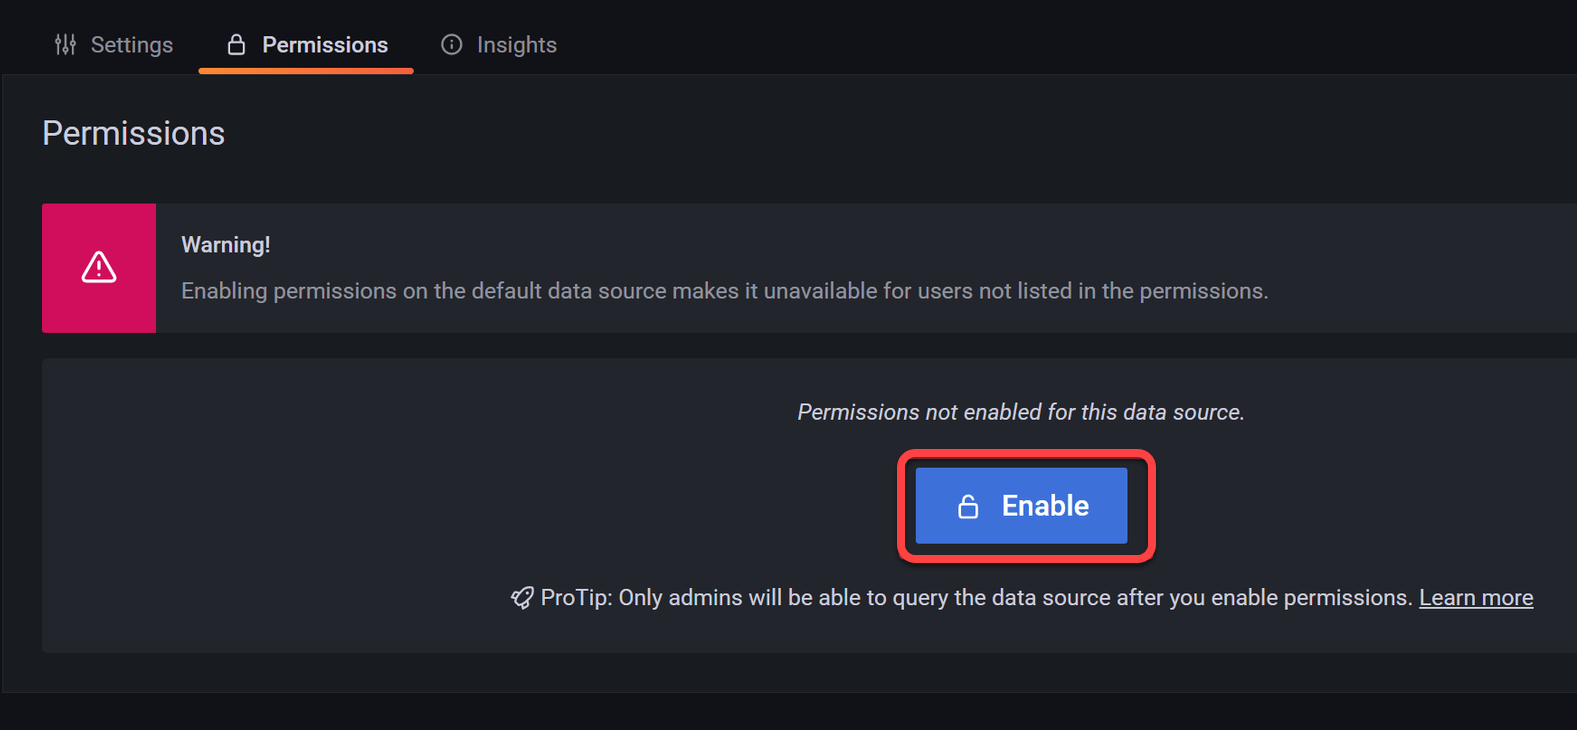
9. Now, click on Add a permission to set permissions for anyone in your team or organization as an admin. But to revoke permission access, click Disable permissions instead.
Visualizing Data in AWS Grafana Dashboard
With the Google Sheet API and permissions in place, it is time to visualize your data. But first, you will need your Spreadsheet ID to identify which spreadsheet is to be accessed or altered.
1. Open one of your Google Spreadsheets, and get your Spreadsheet ID. You can find a Google Spreadsheet ID in the URL below:
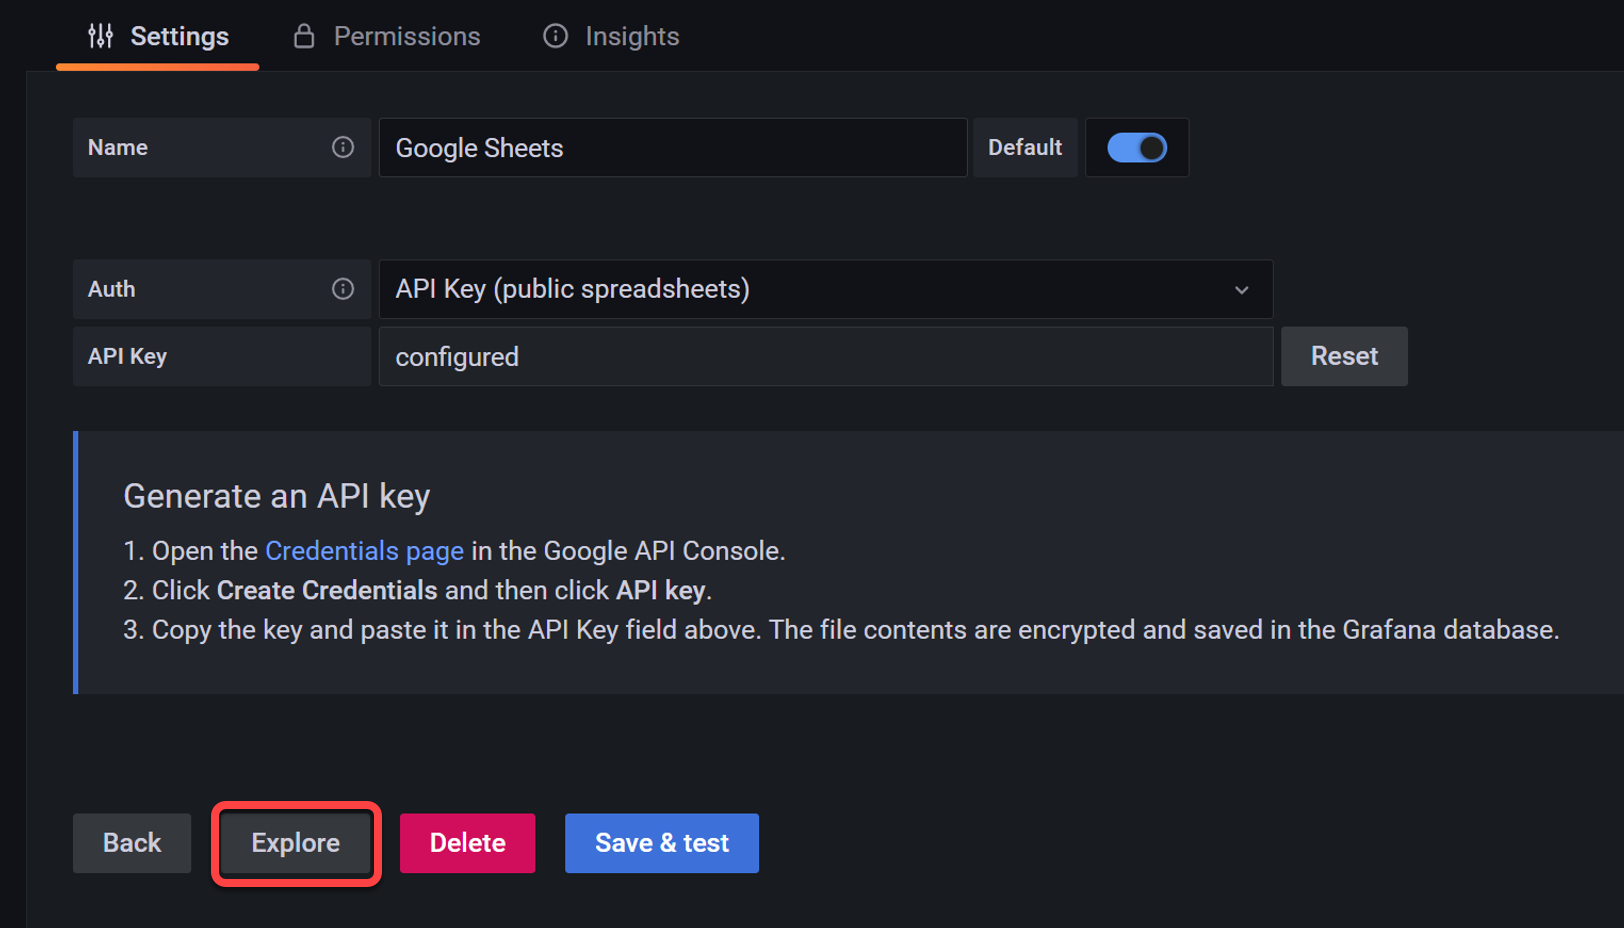
https://docs.google.com/spreadsheets/d/SpreadsheetID/edit#gid=02. Next, navigate to your data source Settings, and click Explore to explore your Google Sheet.
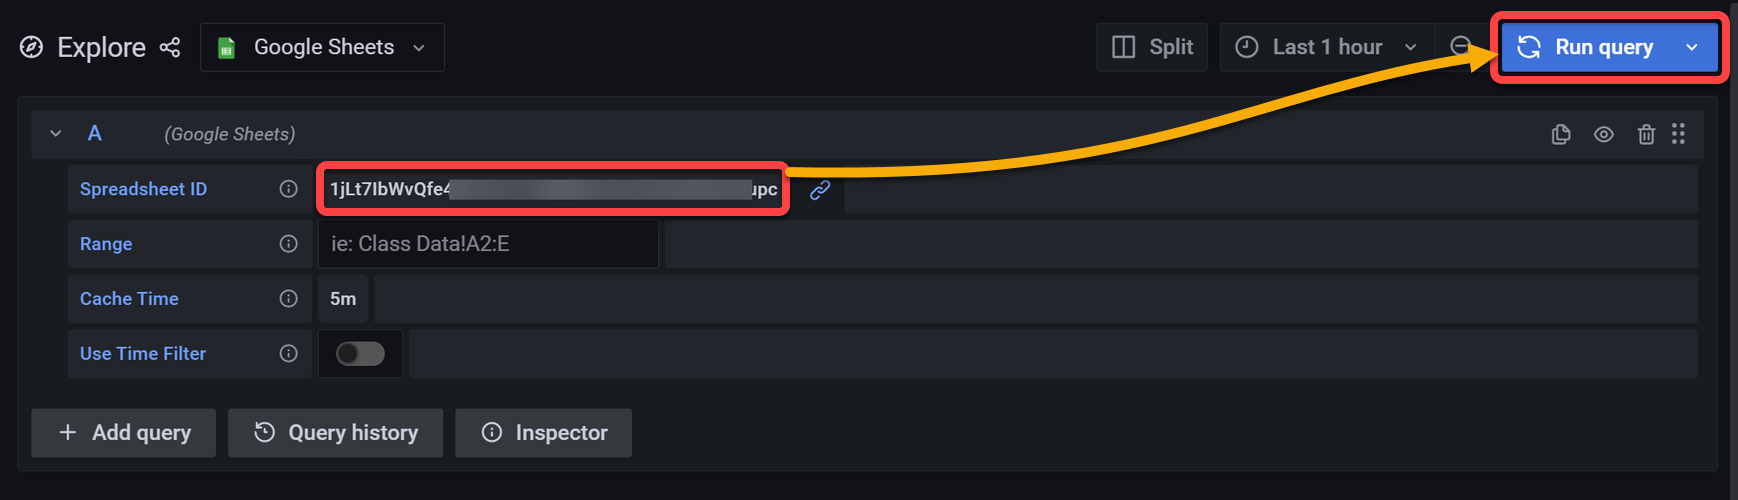
3. Input your Spreadsheet ID, and click Run Query to query the data from your Google Spreadsheet.
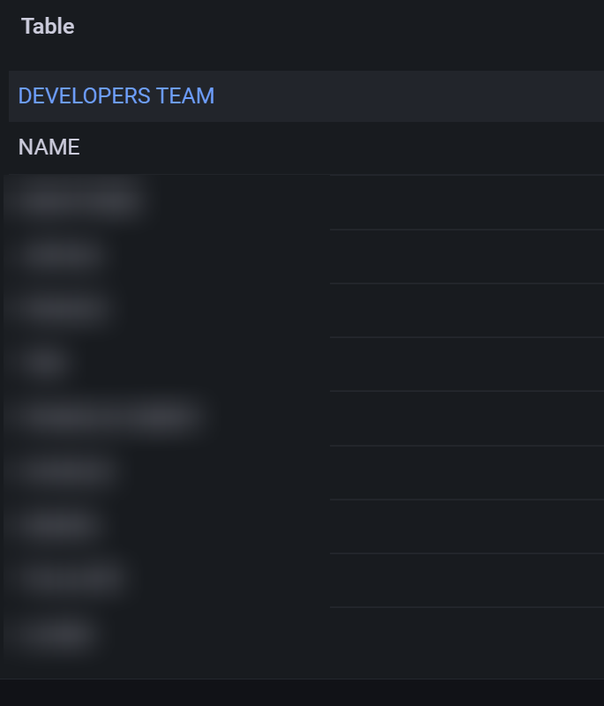
If successful, your data should be shown like the one below. In this example, a single-column data sheet is used.
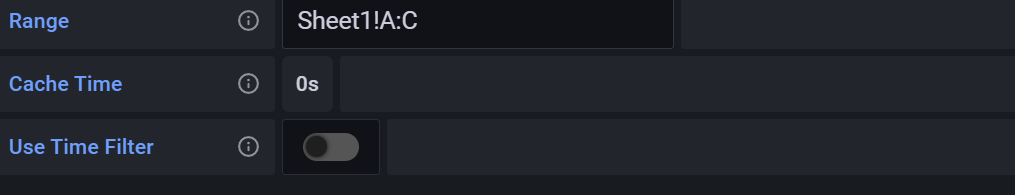
💡 Just so you know, you can specify the range of data to query, as shown below, to filter the data you need.
4. Now, head to your AWS Grafana dashboard panel and press E on your keyboard to open the query editor (step five).
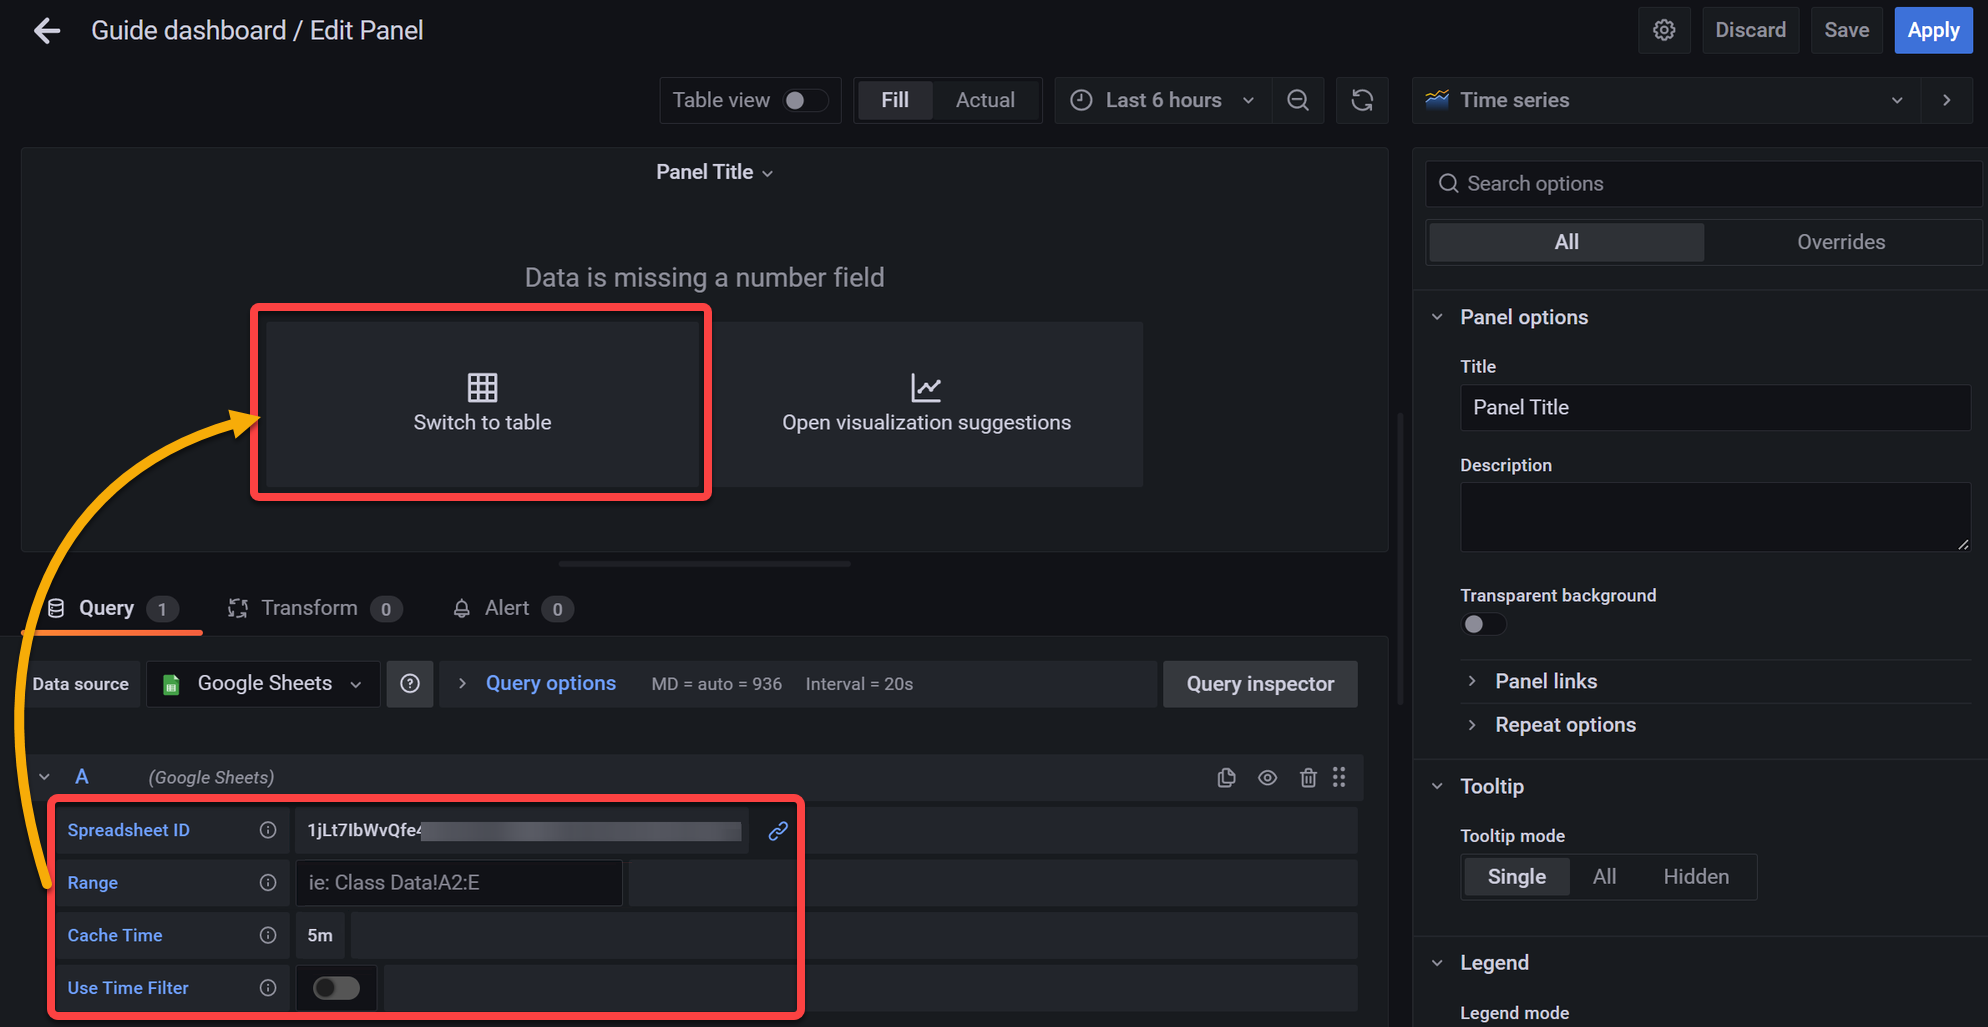
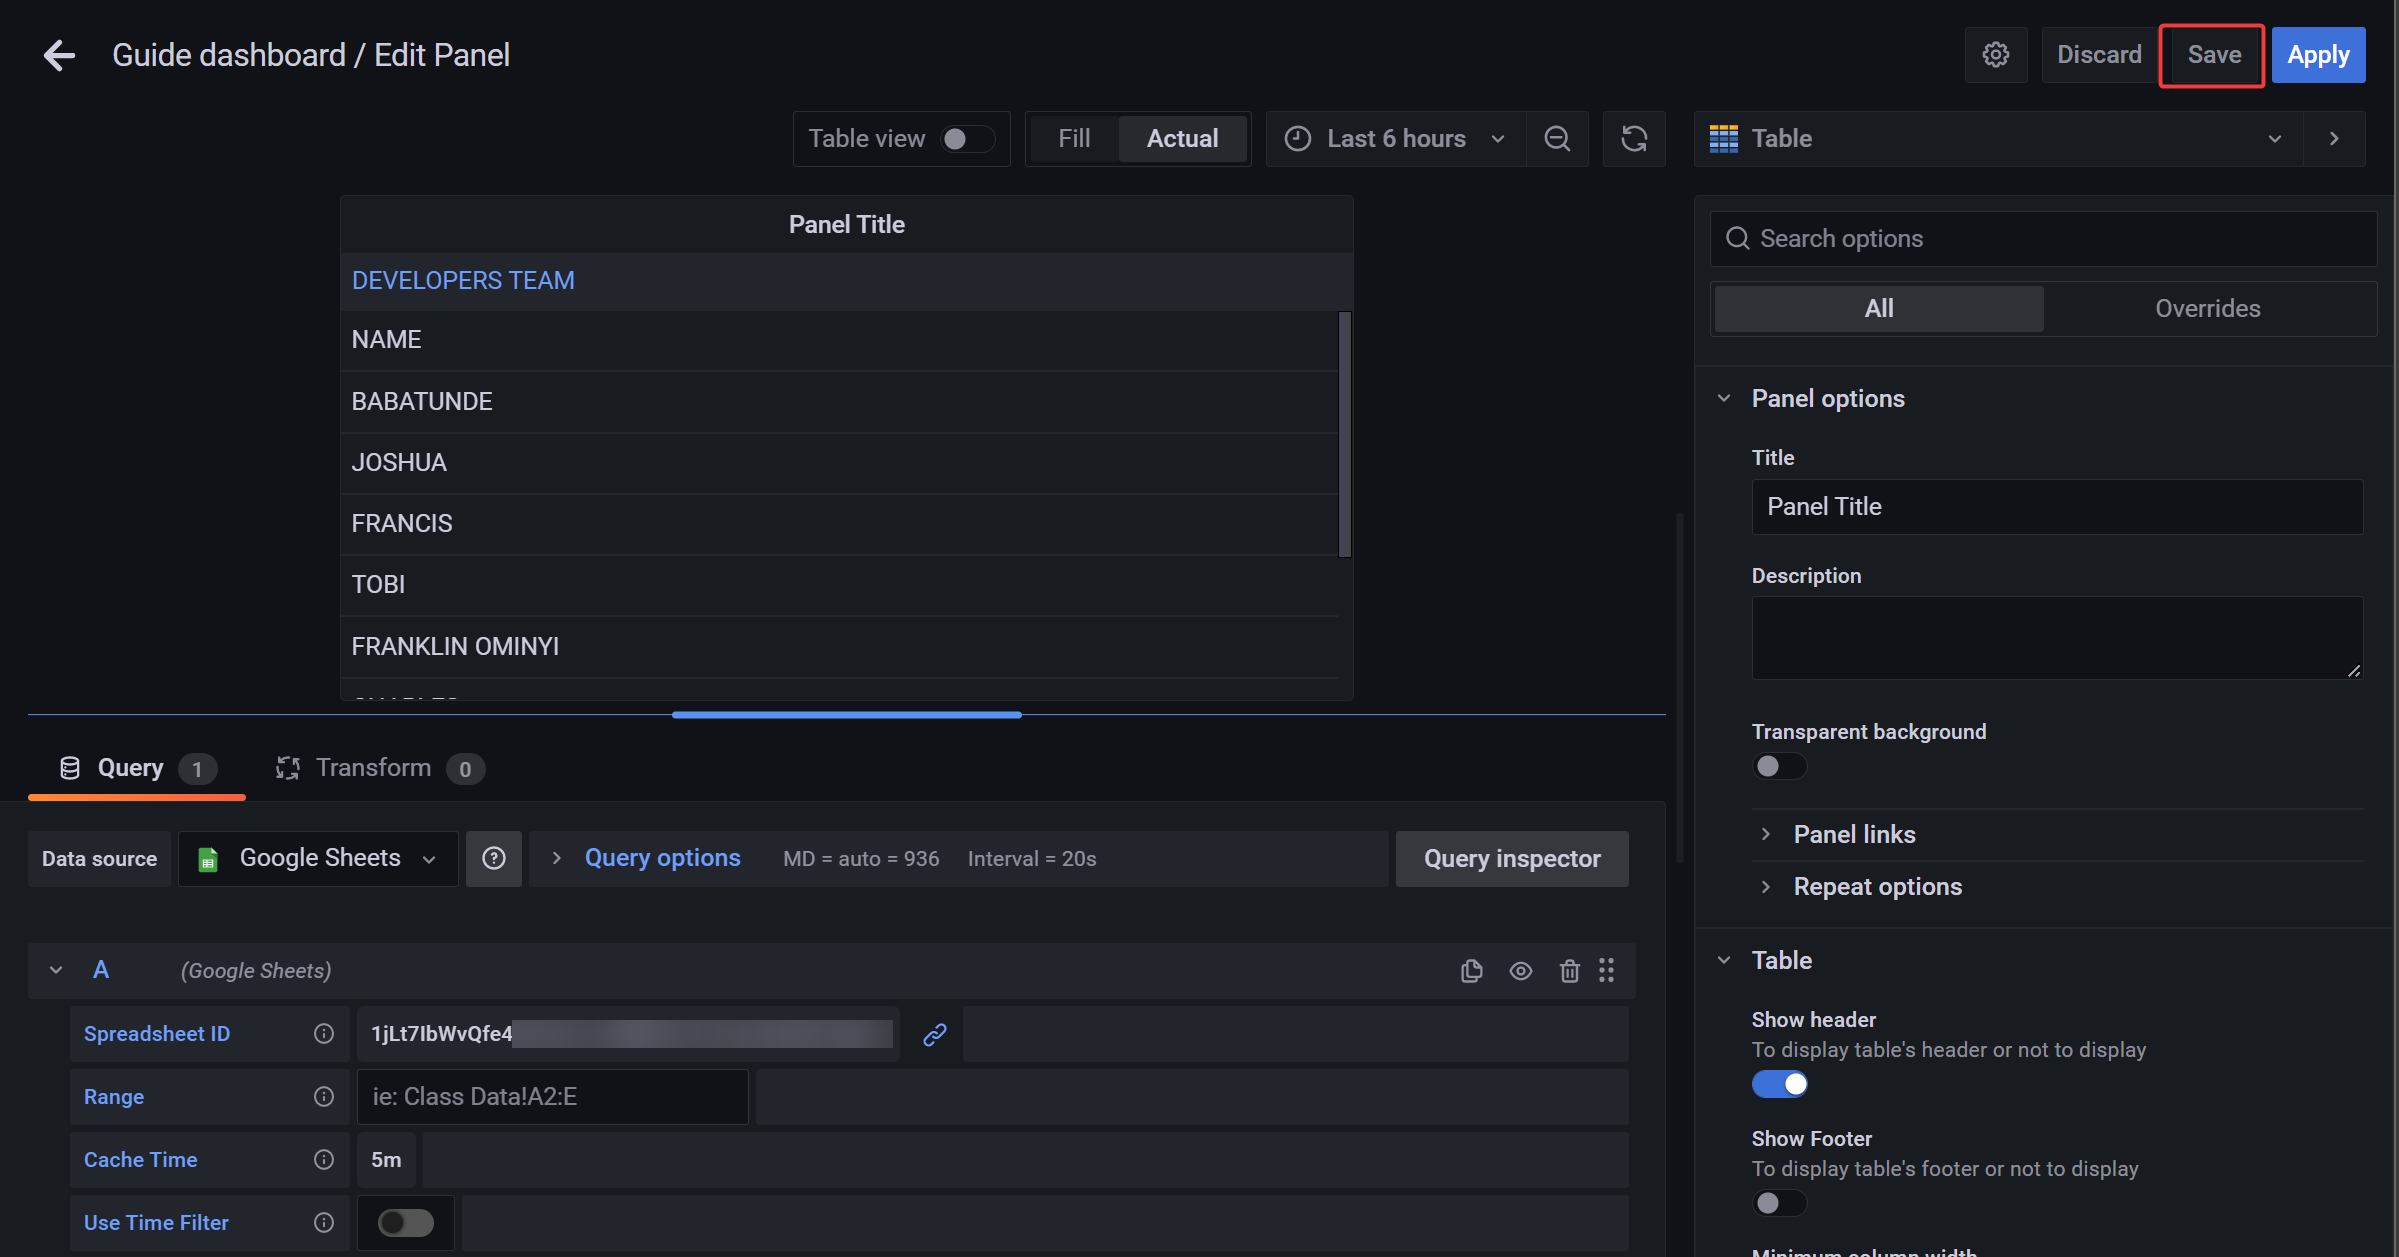
5. Under the Query tab, fill up the query editor with your Spreadsheet ID, the Range of data to query, and so on.
Once filled, choose any of the following options:
| Visualization Option | Description |
| Open visualization suggestions | Lets you view suggestions on how to visualize your data. |
| Switch to table | Visualizes data from your Google Spreadsheet to a table. |
But this tutorial visualizes the data in a table for simplicity.
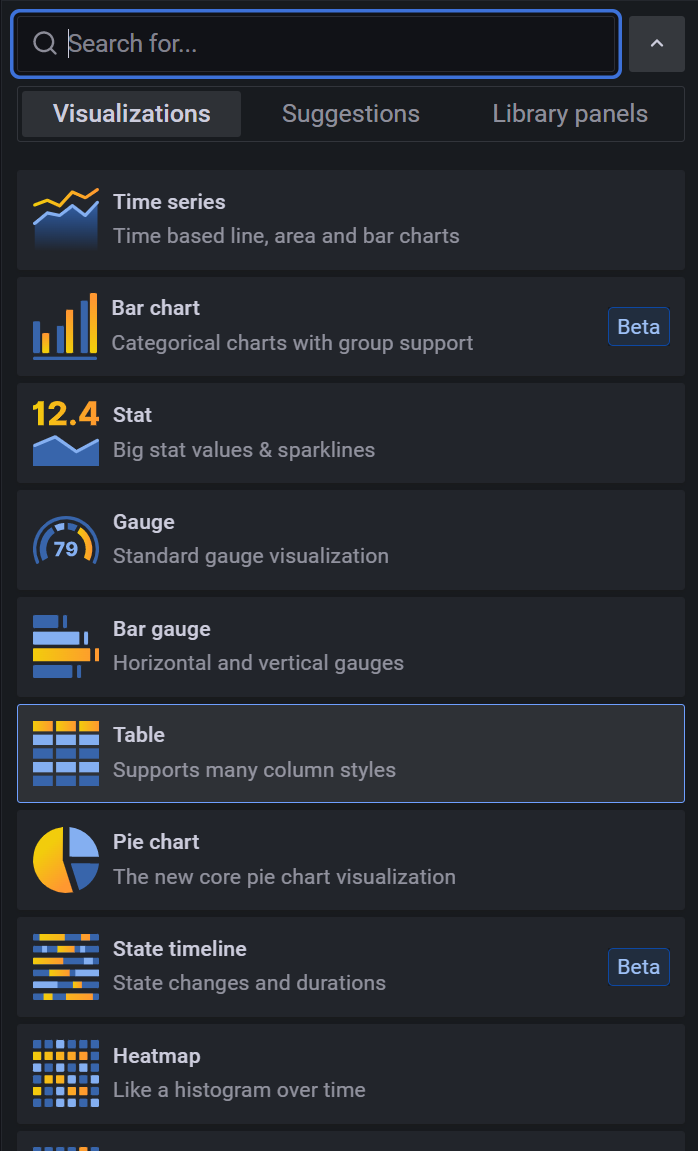
If you choose to open the visualization suggestions, you will see the following options.
6. Click Save (upper-right) once satisfied with the data and visualization option to save the dashboard and data.
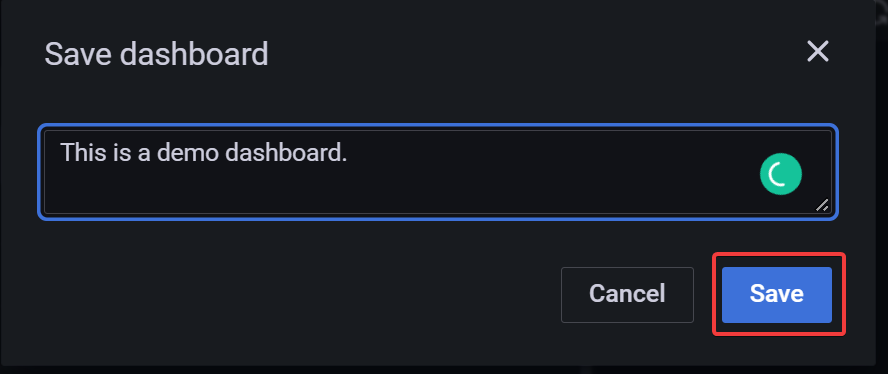
7. Lastly, add a note for saving the dashboard, and click Save.
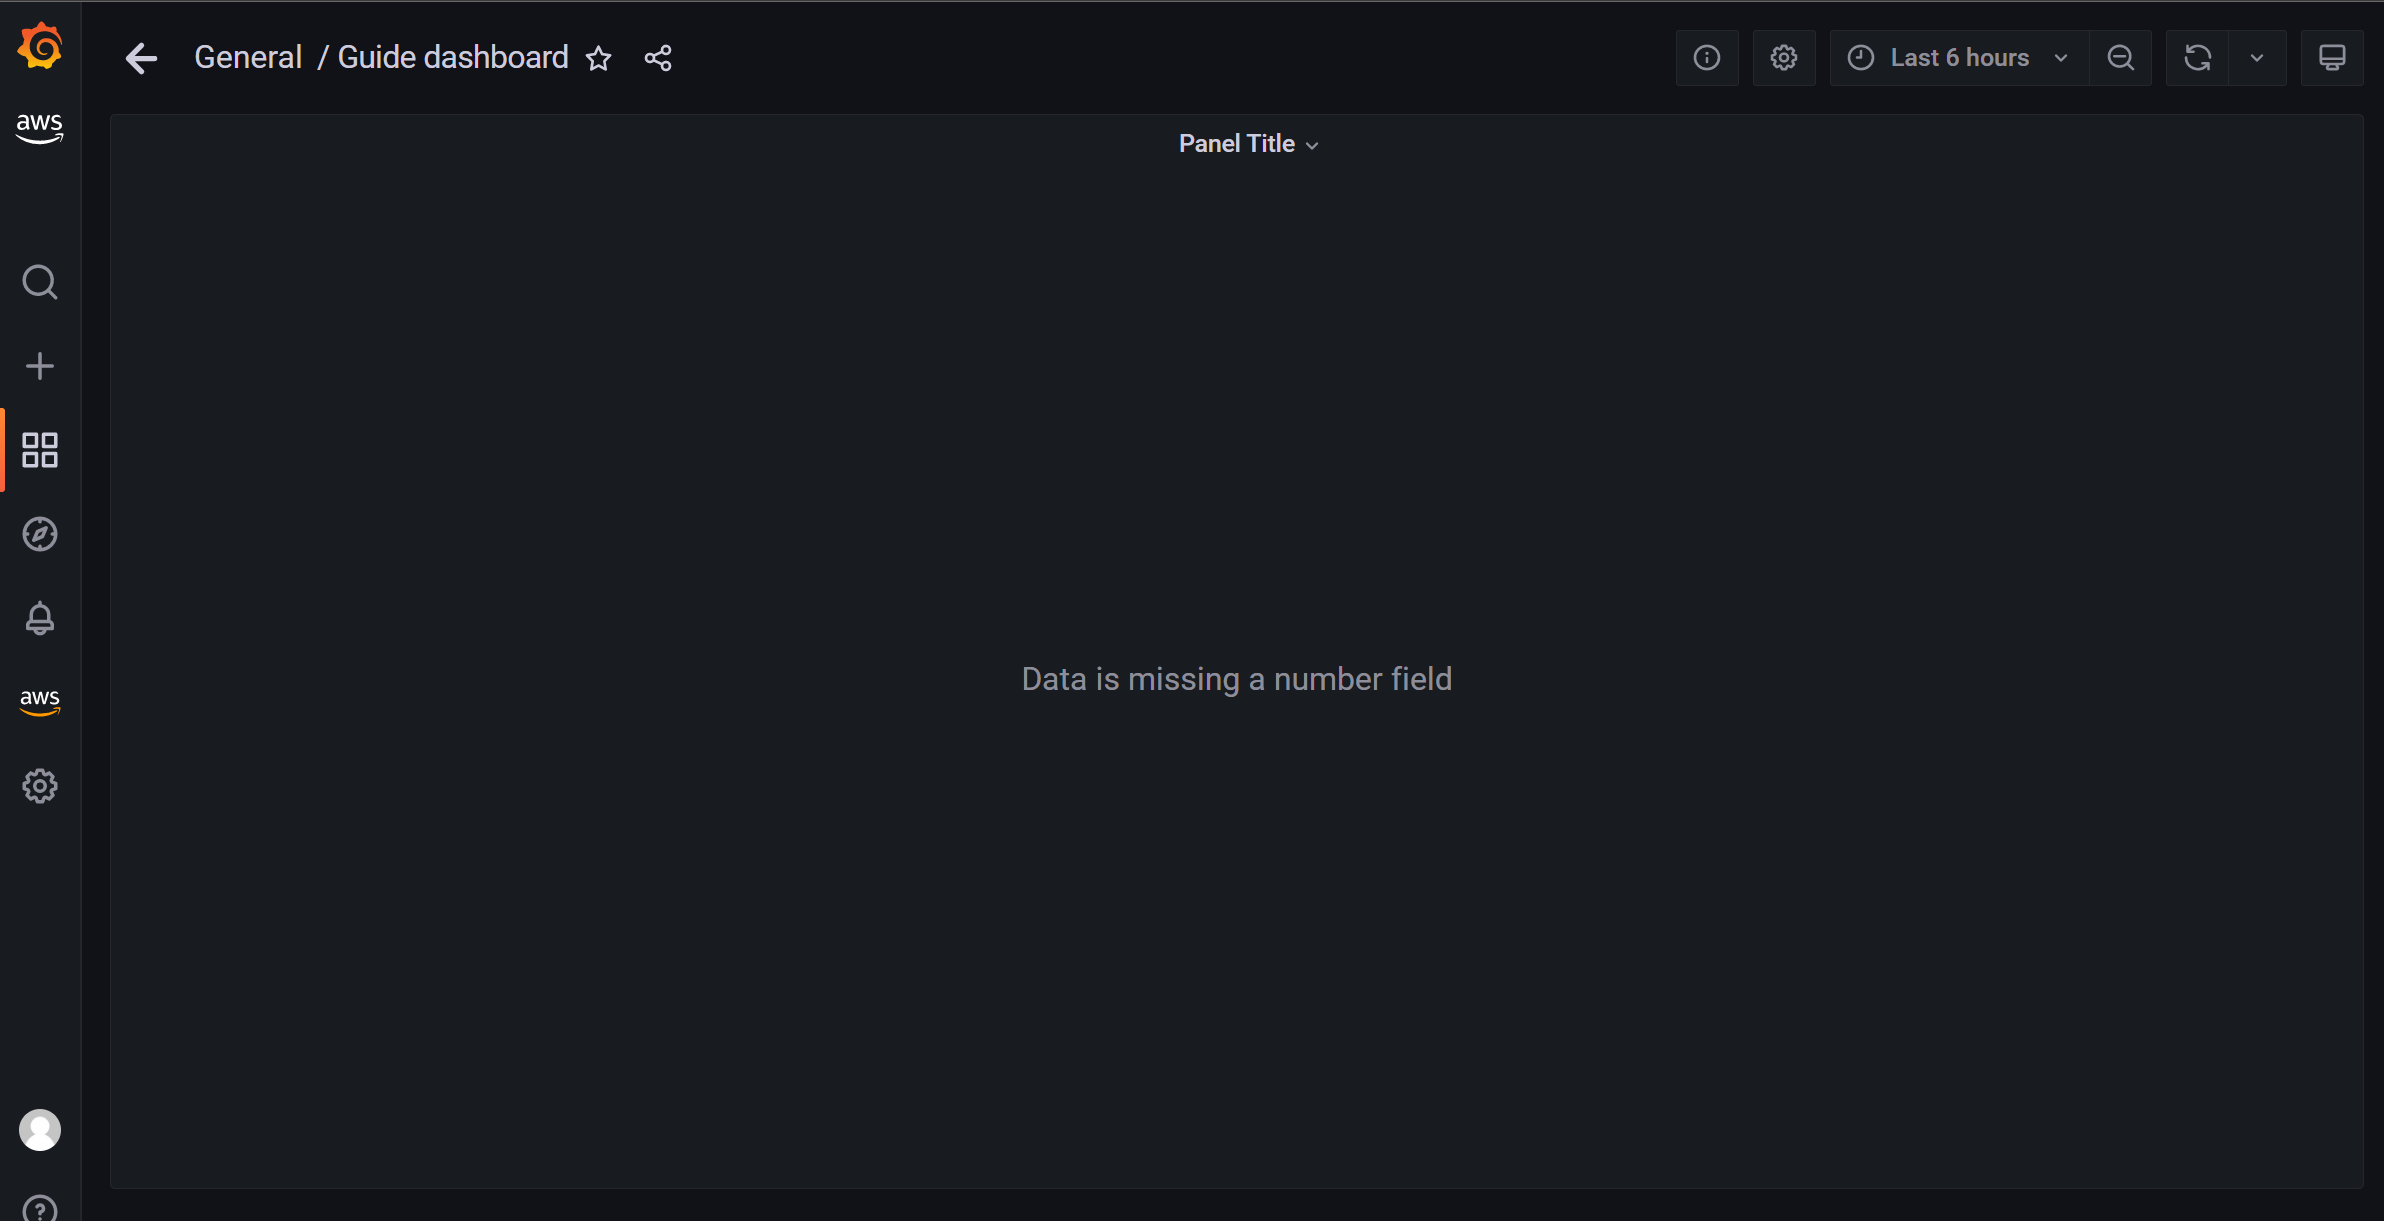
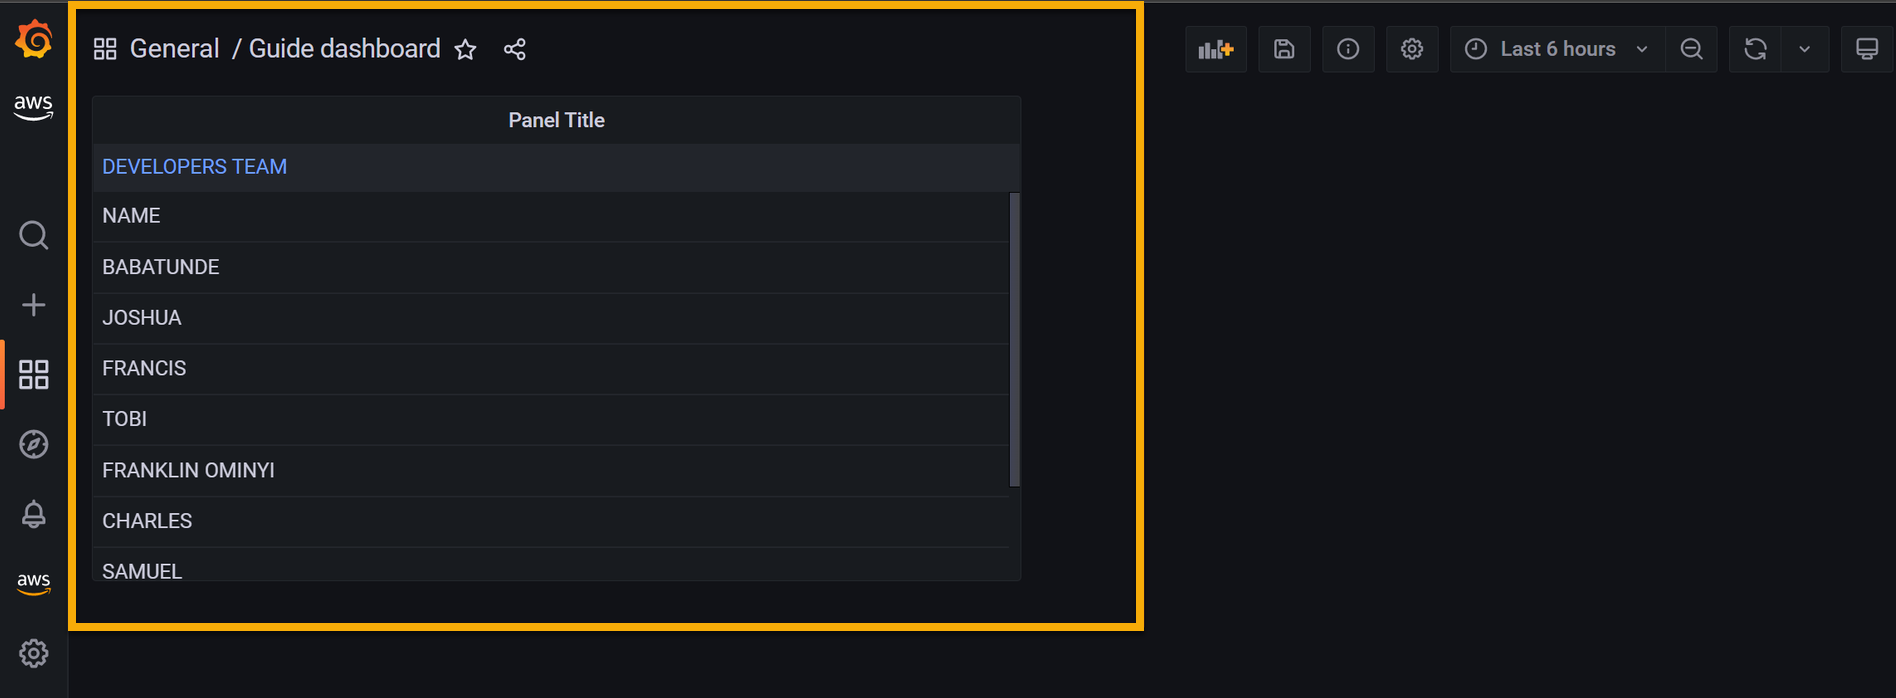
Once saved, you will see your data on your AWS Grafana dashboard panel, as shown below.
💡 Liking AWS Grafana so far? Why not upgrade to Grafana Enterprise and explore more features that can help your business?
Conclusion
One of the essential data management tasks is visualizing your data. And in this tutorial, you have learned that the AWS Grafana dashboard allows you to collect, organize, and distribute data in the form of dashboards, infographics, and maps.
Grafana’s pluggable architecture eases the extension and integration of functionality into your organization’s data infrastructure.
A well-designed dashboard lets you gain insights about your business to improve decision-making, increase revenue, and optimize business operations. So why not integrate the AWS Grafana dashboard into your company’s existing workflows and mobile applications? Start providing a unified look across applications and devices!


