


Visibility into your organization’s endpoints, especially with an increasingly distributed workforce, is critical to ensuring both security and productivity. Though many solutions exist to extract and report on those endpoints, few solutions offer ease of deployment and in-depth data collection. Enter uberAgent, a user experience and security analytics product that claims ease of setup while reporting on a wealth of endpoint information.
uberAgent has sponsored this post. If you’d like to learn more about uberAgent, check them out!
System administrators, like myself, love to tinker, but that doesn’t mean that we have the time to. With enough information, it’s often difficult to analyze and discern what is important. In this review, I will take a close look at uberAgent and see if it meets the needs of an organization looking to collect and understand the many different data points that an endpoint can offer!
Proper Planning for a Successful Deployment
Before deployment of uberAgent, you must first determine what backend to use. As Splunk is recommended and uberAgent supplies pre-built dashboards, for this review, the logical choice was the Splunk Enterprise trial.
uberAgent also supports Apache Kafka, ElasticSearch & Kibana, and Azure Log Analytics. There are no pre-built dashboards available for these yet.
Installing Splunk itself was a matter of choosing defaults, and installing the necessary indexer and dashboards for uberAgent. One important step was to ensure the firewall allowed traffic both for the Splunk daemon (splunkd.exe) and TCP port 19500, a preinstalled (”dummy”) Splunk TCP listener. This is not a “default”, per se, but as 19500 was also used by uberAgent this made for a logical choice.
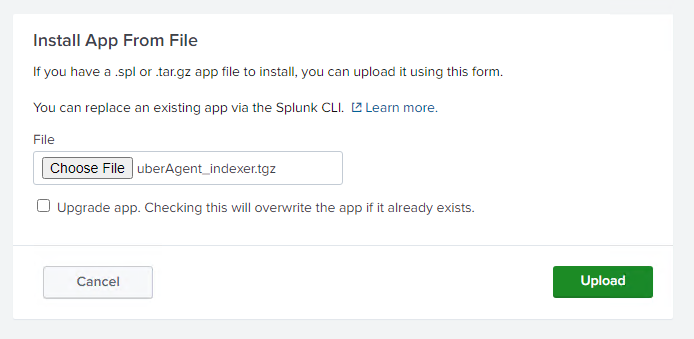
Two required components and one optional component were necessary to install, and as I am testing the uberAgent ESA component (security), I installed the ESA set of dashboards as well.
uberAgent_indexer.tgz– Requires a Splunk instance reboot.uberAgent_searchhead.tgz– uberAgent UXM dashboards.- (optional)
uberAgent_ESA_searchhead.tgz– uberAgent ESA dashboards.
Splunk is the only backend with pre-built dashboards. One great enhancement would be pre-built dashboards and data filtering for other backends, such as Azure Log Analytics. As it stands, the turnkey solution is Splunk, which may not fit with an existing organization’s architecture.
In addition, I would have liked a bit more documentation and a walkthrough with configuring Splunk itself, as the terminology was not as familiar to me. Therefore, documentation that had a more in-depth step-by-step walkthrough would have saved time.
Collecting Data by Installing uberAgent
With Splunk installed and configured, it’s time to start collecting data!
Several methods are available when deploying uberAgent. I chose the manual deployment method for this review. In a larger organization with many endpoints, automating the agent install is typically preferred. To that end, uberAgent offers a configurable MSI which works with many different deployment solutions, including Group Policy itself. This is ideal for those in an Active Directory environment and with no third-party deployment solution.
When deploying via the manual deployment method, the recommended process is via the manual-install.cmd batch file. Though this script ultimately launches the MSI package, the script verifies that the necessary configuration directory exists and license files are copied to the appropriate location.
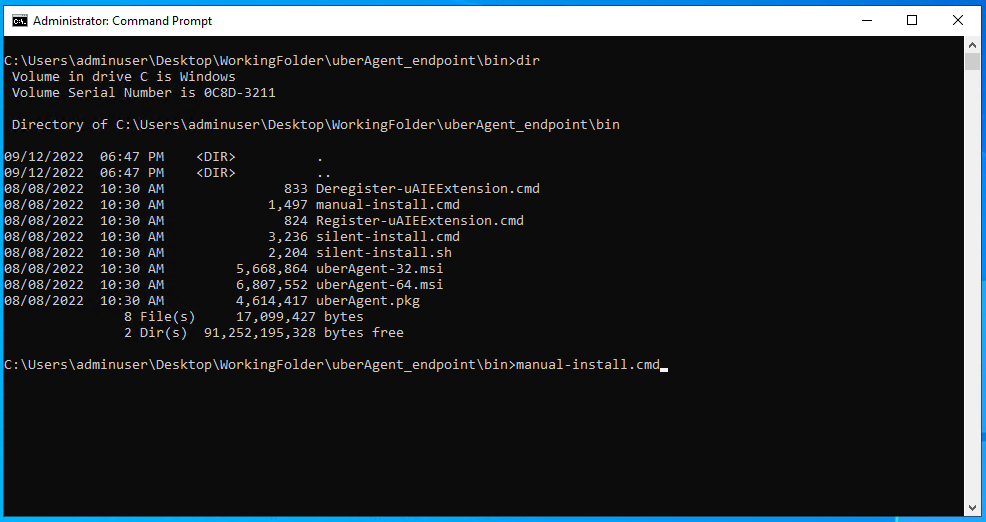
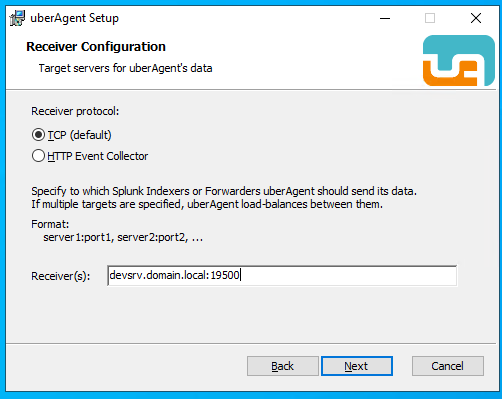
Once run, the install GUI needed only the receiver(s) and protocol to send the data to. What would be a nice enhancement is to have that prompt from the script itself (instead of having to walk through the GUI prompts), or to specify via the command line. There is a silent-install.cmd batch script intended for automated deployments, but you must modify the file itself.
Customizing uberAgent for Your Organization
Looking through the uberAgent configuration, I found the defaults quite sensible. But, for those with unique environments or who are looking to extend uberAgent, there are two primary ways to configure the agent.
- Creating a %PROGRAMDATA%\vast limits\uberAgent\Configuration\uberAgent.conf file, copied from the C:\Program Files\vast limits\uberAgent\uberAgent.conf example file.
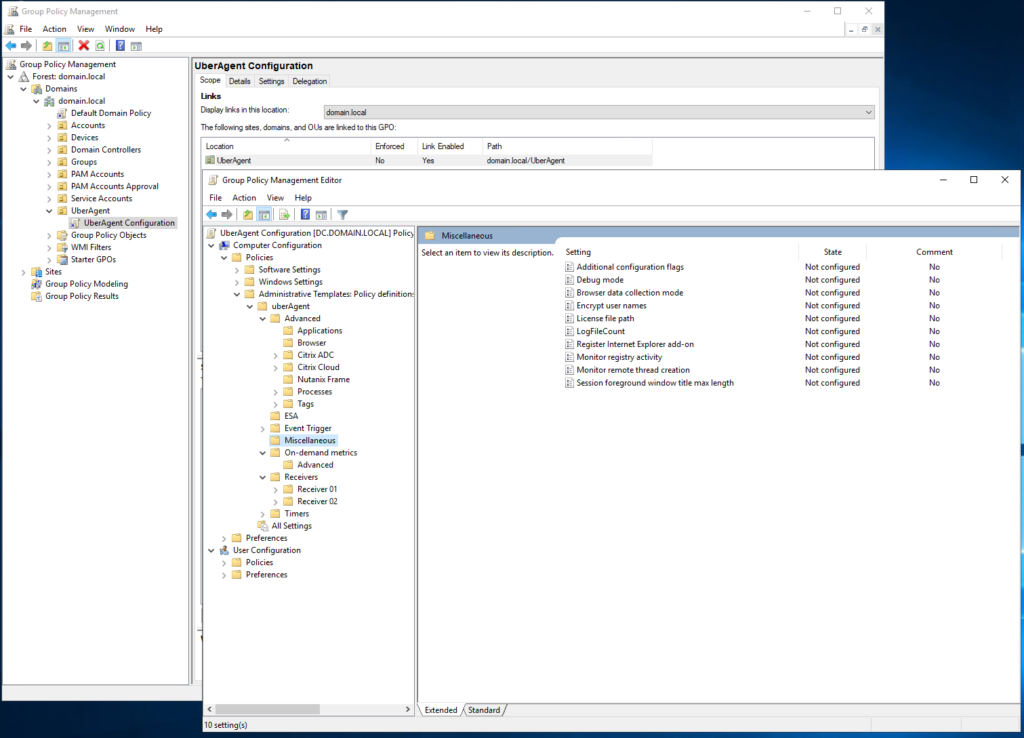
- Importing the files contained within the extracted zip under, uberAgent components\Group Policy\Administrative template (ADMX), and copied to \\domain.local\SYSVOL\domain.local\Policies\PolicyDefinitions.
You may run into a path length limitation error depending on where you extract the files, so you may find it better to extract near the root of C:\. In addition, if you are unable to access the previously specified SYSVOL directory on your domain controller, utilize the resolved path under C:\Windows\SYSVOL.
The first method requires you to deploy the configuration file along with the installation of the agent and does not automatically update when the agent is upgraded. Therefore, there are more manual steps involved in maintaining this method of configuration.
It would be nice if, upon an agent upgrade, there was a difference check done to detect if incompatible changes exist and a migration tool to automatically update the configuration file. To avoid that, you could utilize the Group Policy Administrative Template.
The added bonus with Group Policy is that you make deploying changes quicker and easier. If you utilize Advanced Group Policy Management (AGPM), you add change control of the configurations. In addition, different group policy objects (GPOs) can be utilized for custom settings in different organizational units (OUs).
Overall the differing methods offer a nice balance between endpoints that may not be a member of an Active Directory domain utilizing Group Policy, and more advanced installations that centralize configuration and allow for quick updating.
Tracking User Experience With In-Depth Data
With uberAgent installed and configured I dove into the data and explored the many metrics returned. I am not going to go into details on each and every data set but will highlight a handful that is indicative of the data and features. That being said, what types of data are collected?
- Machine Inventory
- SMB and Network Statistics & Issues
- Disk & Storage
- User Sessions
- Application Performance & Inventory
Contained within these broad categories is a wealth of information such as the types of applications and how they are performing. For example, the Application Performance dashboard breaks down applications into how they are performing, disk and network throughput, and overall responsiveness. This is great for diagnosing issues on a single machine or across an entire organization, a potential remedy for when a user states their computer is running slow!
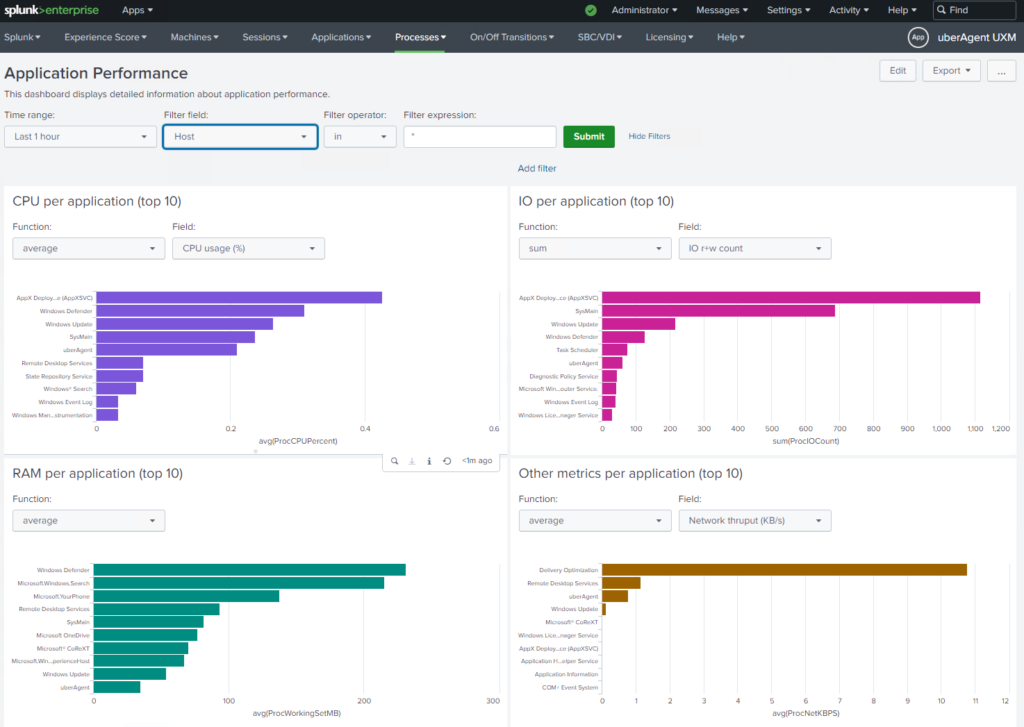
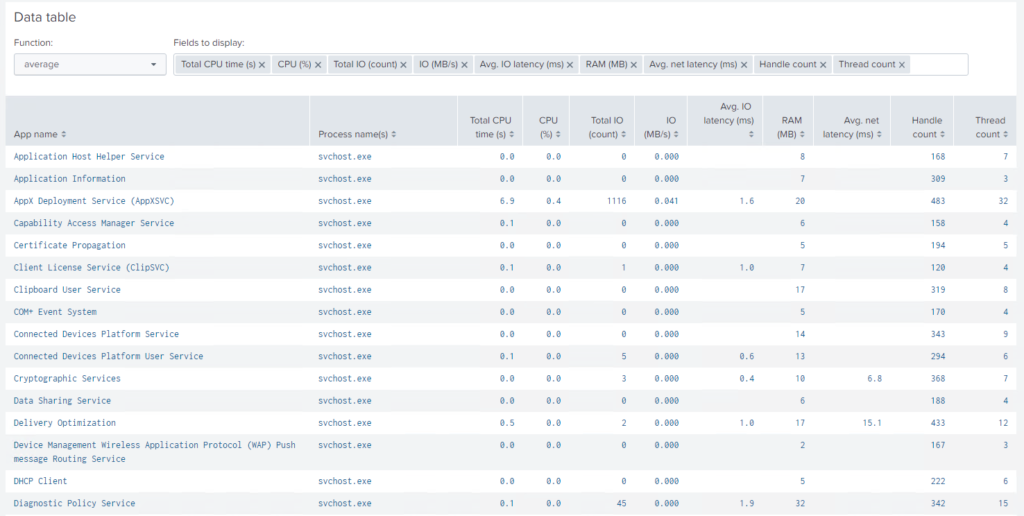
But it’s not just graphs, you can view the tabular data and build further reports and analyses from the collected data. This is true for most reports, you can view the in-depth data to see specifics and base decisions on hard data.
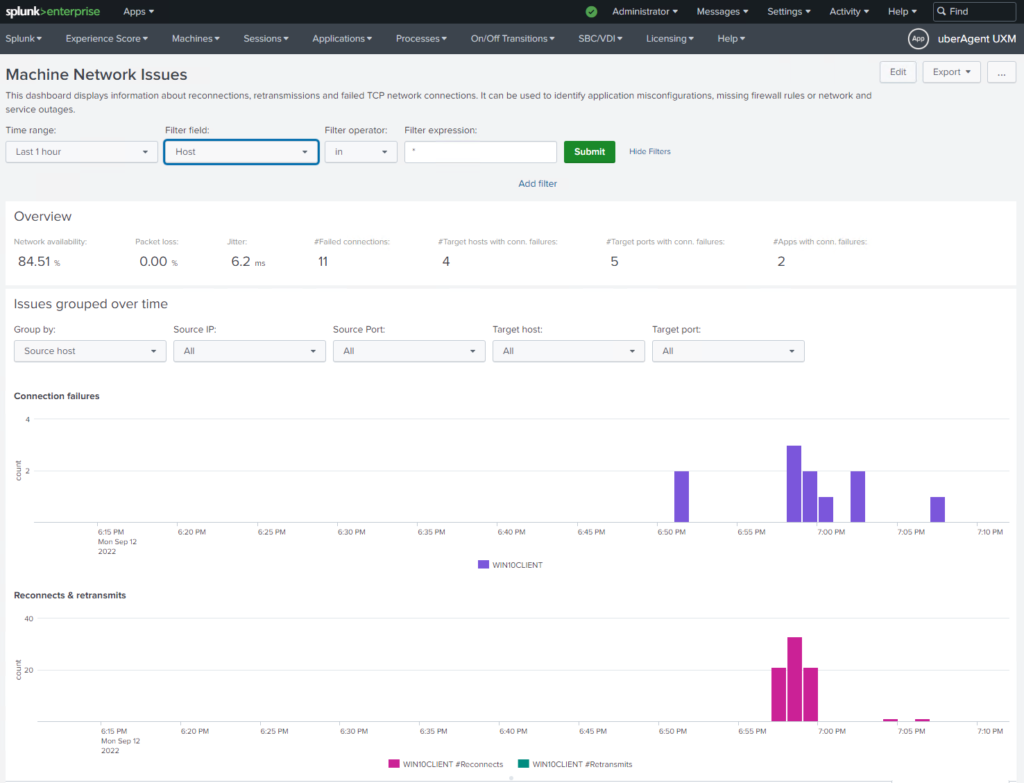
One issue from my helpdesk days that came up repeatedly was poor network performance. Built-in to uberAgent is a dashboard collection of network statistics such as packet loss and jitter. Not only can this be used to diagnose an entire department, but individual machines over time. The amount of time this type of reporting can save while troubleshooting and endpoint is substantial and a great benefit to those in the thick of it.
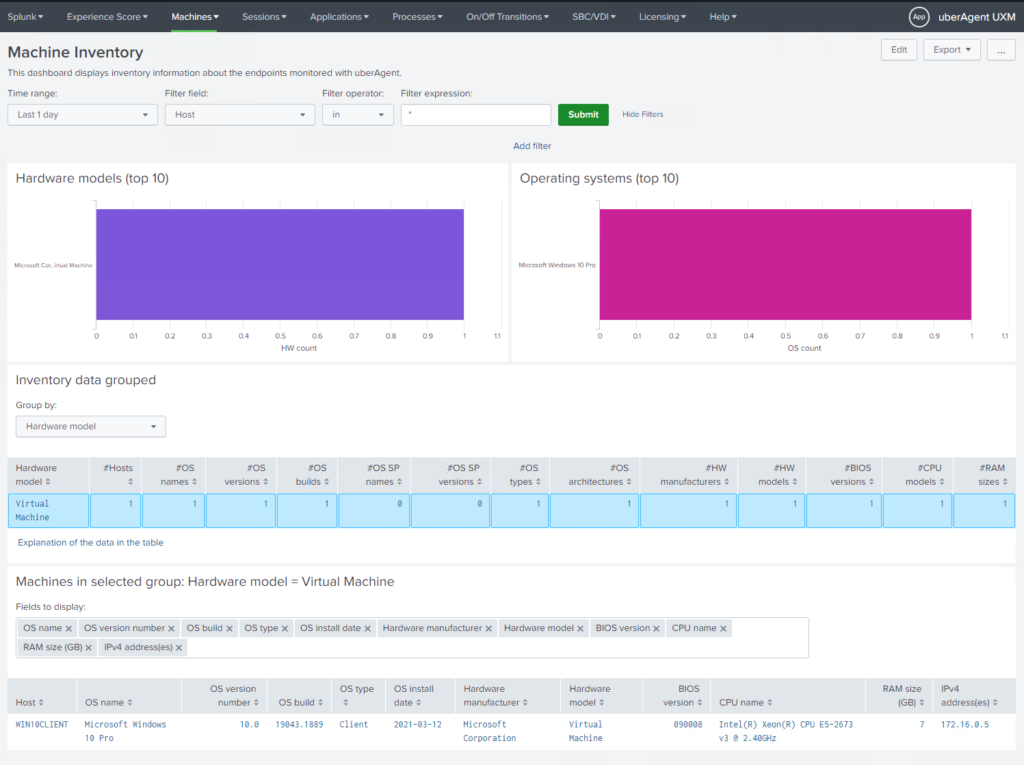
Of course, just understanding what machines exist in your environment is crucial to any IT organization. With this data in hand, you can make decisions on upgrades, both for hardware and software with the Machine Inventory dashboard.
These dashboards only scratch the surface of the metrics available from uberAgent, but for discovering potential issues in your environment uberAgent makes the process painless. The only enhancement I would like to see is more roll-up dashboards that collect potential issues and present them in a single place. This would help an organization quickly identify and remedy any potential issues quickly!
Protecting Your EndPoints with uberAgent ESA
Hand-in-hand with the user experience is protecting endpoints from potential harm. With so many threats in the wild, it’s important to alert quickly on potential issues. A separately licensed product from uberAgent UXM, the uberAgent ESA solution utilizes the same agent to report additional information on endpoint security states.
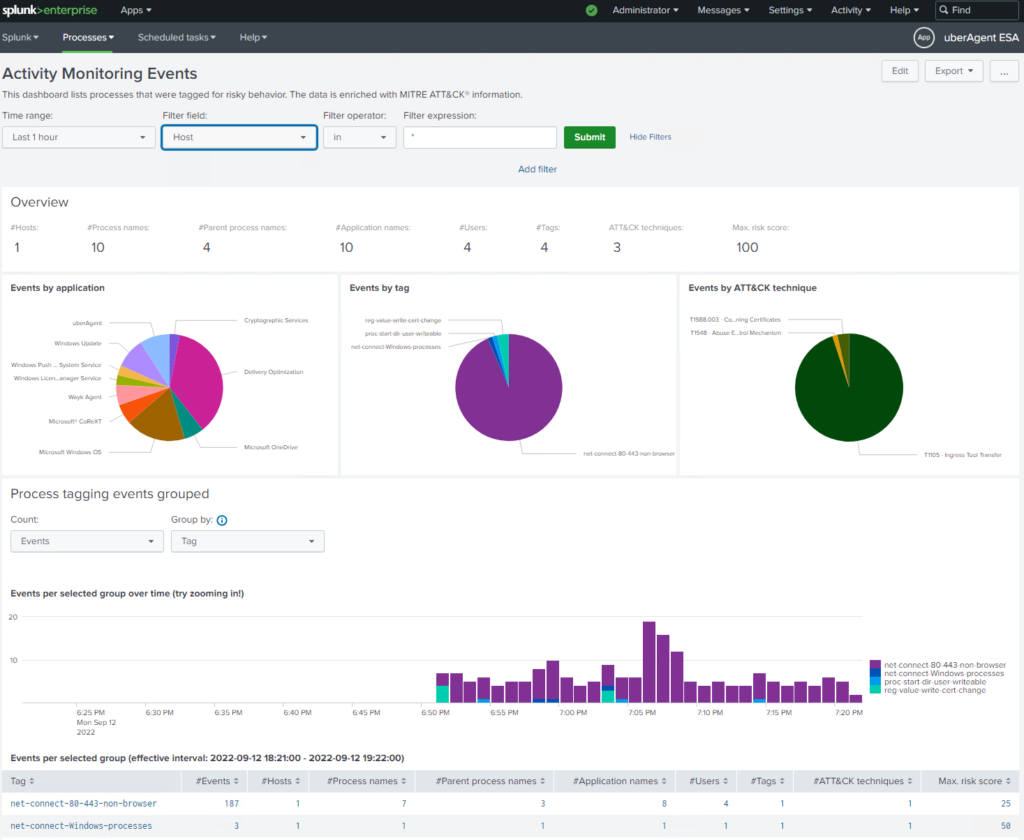
Once licensed, and with the correct Splunk dashboards installed, additional data becomes available. Tracking potential threats with useful pre-defined types are shown in the Activity Monitoring Events dashboard. Here the data is categorized by application, tag, or even the attack type.
Visibility into the potential attack vectors on an endpoint means that you can quickly hone in on a troublesome endpoint and determine the necessary action to take before business data is lost.
If there is an unknown process, that you need to dive further into, instead of taking over a user’s machine you can utilize the built-in dashboards to drill into a specific machine. This lets you troubleshoot an issue without disrupting a user, and find common issues that may spread across multiple machines.
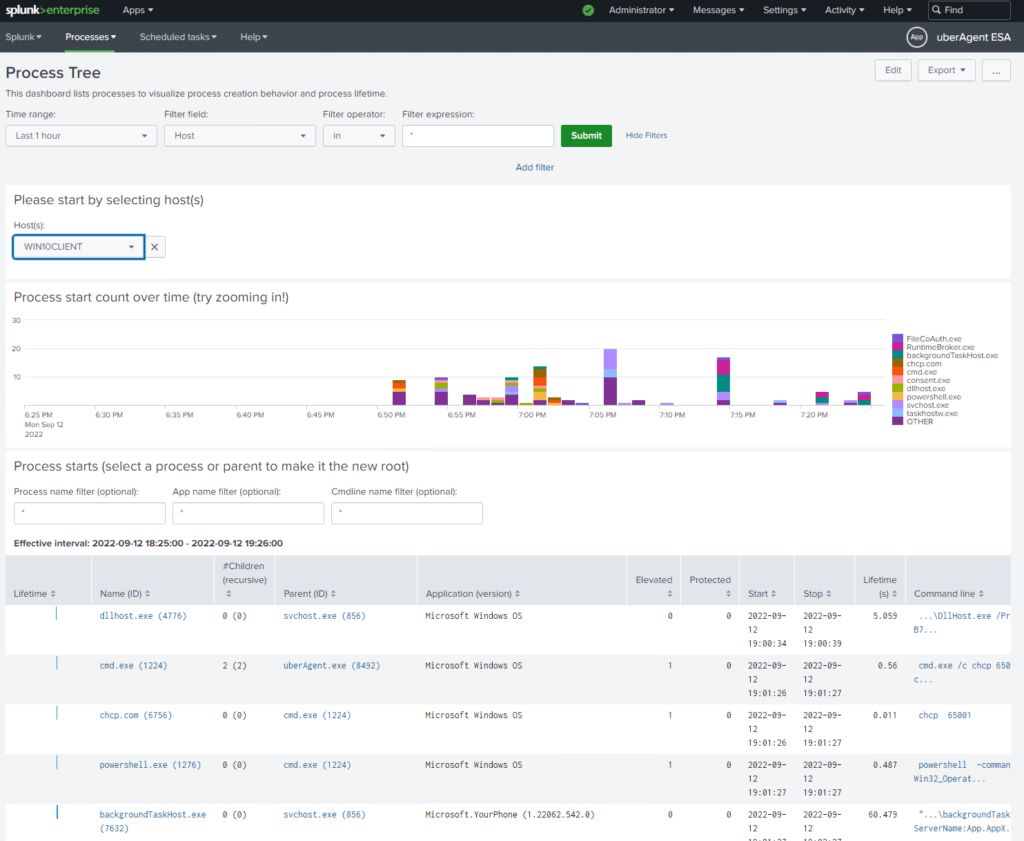
With this type of in-depth reporting, the job of a helpdesk technician becomes far easier and allows you to be proactive and search for potential issues rather than react when it may be too late!
Discovering Issues by Collecting Browser Metrics
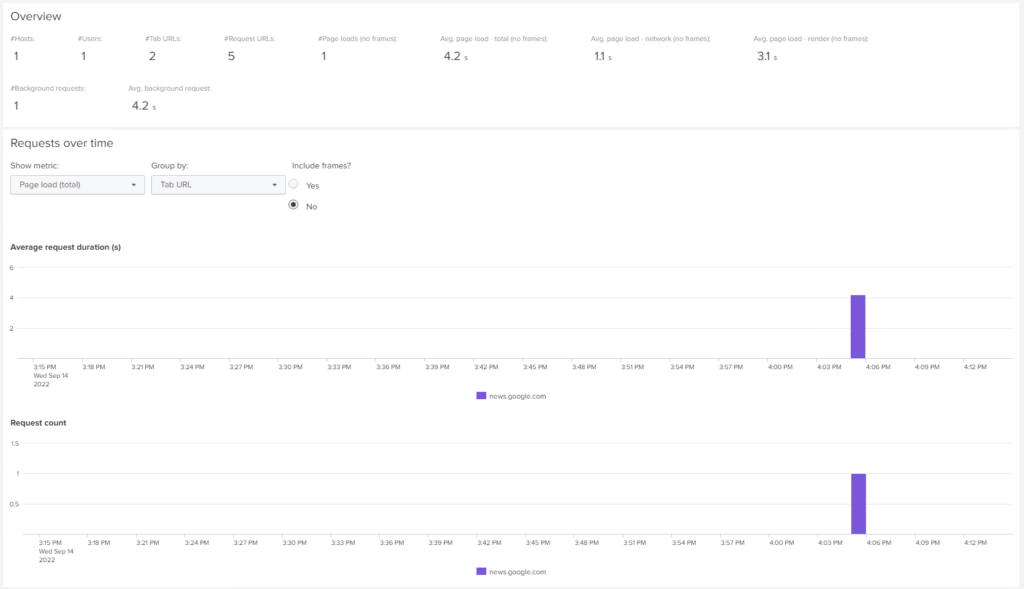
Finally, one additional measure that is often not included in other user monitoring systems is that of browser performance. After installing the appropriate browser extension, metrics on how a website is performing are sent to Splunk. This allows you to see if there are issues with loading sites, or poorly performing web applications. As there are many internal applications in use via organizations, this would be particularly helpful to find out if a user is experiencing an issue!
Going Further and Extending uberAgent
With all of the built-in dashboards, you may ask what customization is possible and what else you can do with uberAgent. There are a few ways that you can extend the agent to ingest additional data or alert on potential issues.
uberAgent has the ability to run custom scripts. This could be PowerShell, Python, VBScript, etc. Any script that can output a string in the format of key=value will be ingested. These scripts can be run on a timer (in milliseconds) or once per session, depending on the account method and type used.
An example of how this works is this simple PowerShell script shown below. This simply retrieves all DNS addresses contained in interfaces labeled with “Ethernet” and joins them with semicolons. Output in the format of key=value can be easily consumed by uberAgent.
$Addresses = Get-DnsClientServerAddress -AddressFamily IPv4 | Where-Object InterfaceAlias -Match 'Ethernet'

Write-Output ("DNSServers={0}" -F (($Addresses | Select-Object -ExpandProperty ServerAddresses) -Join ";"))
To implement this in an agent, create a new timer, here I named mine “Collect DNS Addresses”, set an interval, and the Script command to run.
############################################
# Timer 12
############################################

[Timer]
Name     = Collect DNS Addresses
Script   = PowerShell.exe "C:\Tools\Get-DNSAddresses.ps1"
Interval = 10000
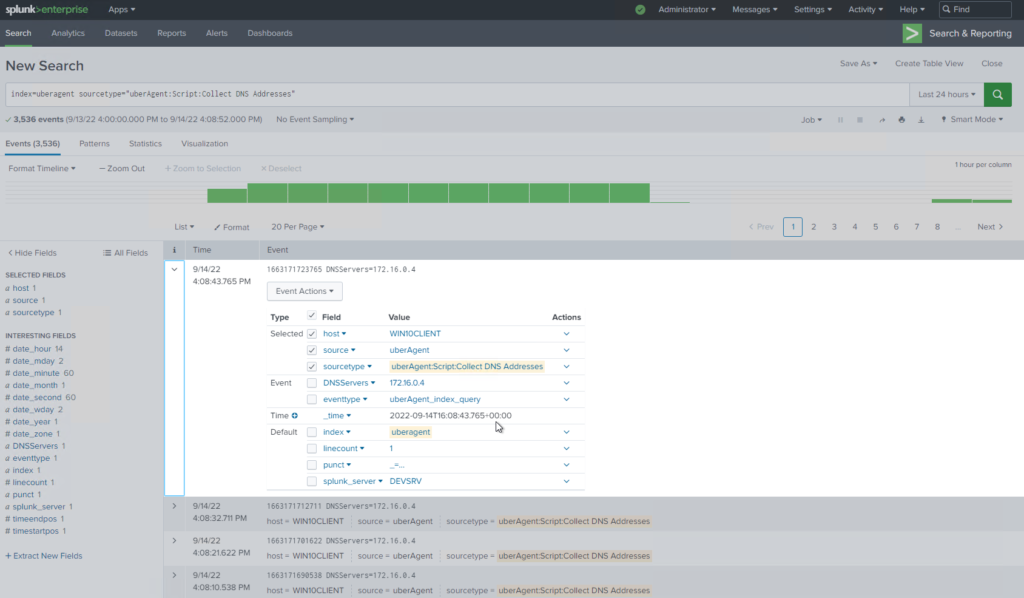
The ability to run virtually any type of script and ingest the data automatically and easily means that extending uberAgent to report on custom environment metrics is quick and easy. As you can see below, I am now able to query the data and return statistics on the fields collected.
The only aspect that would make this easier, is better documentation as to how to do this, mostly from the Splunk side. A how-to linked from the notes in the configuration reference would be ideal. That being said, with this data, the next steps are merely incorporating the metrics into an existing dashboard, or a new one of your own design!
The final component is automated alerting. Though this is not a feature of uberAgent with the appropriate backend, such as Splunk, you can leverage built-in alerting capabilities. In the case of Splunk, you can configure alerts on the metrics collected and automatically send emails to the correct users to jump on to a problem.
Impressions on uberAgent
Coming from a long history of system administration, I can say that having the types of metrics available from uberAgent would have been extremely helpful. The difference between what a user says is happening, and the data to back that up makes troubleshooting an issue far easier and quicker.
I would like to see more documentation on creating custom dashboards and in general more use-case-based scenarios on how to use and search through the data collected.
Extending this agent to have the types of pre-built dashboards for Splunk in other products, would give a lot of flexibility to organizations that have existing solutions. Building out the security solution further to track more threats, and present more data, would also help to really create an all-in-one package.
Overall though, this is a very easy-to-install and use product that does a great job of presenting metrics in a way that doesn’t require you to jump through hoops just to see and understand what is going on in your environment. Deploying the agent is quick and easy, as is configuring the agent for any number of scenarios.
Conclusion
If you are looking to enhance your user’s experience and proactively find and solve problems quickly, then uberAgent does a fantastic job of collecting and presenting the data. I recommend this for any number of organizations, both large and small!


