

One of the most ubiquitous tasks every IT professional must handle is monitoring. After all, IT operations staff is paid to keep services up and available to consumers at all times. You can bring up the latest and greatest services for your users but if you can’t keep them online, what’s the point?
Large organizations and enterprises can have thousands of critical services, each fulfilling a specific role. Gone are the days of staring up at a TV on the data center’s wall for red and green lights. Service count has expanded, and it’s no longer adequate to use a binary up/down model.
This post has been sponsored by SolarWinds. Learn more about or start a free trial for the SolarWinds APM Integrated Experience.
An Application Stack is like an Onion
The user experience, in the end, is the most important gauge of a service being “up” or “down.” But this requirement introduces an entirely new set of challenges. To do this, organizations must ensure every layer of the application stack is properly monitored. The application stack is like an onion. Peel one layer back, and you find another.
Now, you’re no longer monitoring a metric as simple as a lost ICMP packet destined to a server. Instead, you’re now monitoring the onion, which consists of the entire OSI model stack!
Who Manages the Manager?
Organizations have been relying on Application Performance Monitoring (APM) and infrastructure monitoring tools for years to address the complexities of today’s monitoring challenges. But another challenge pops up; managing relationships between the tools (and teams).
Let’s say a user calls the helpdesk to open a support ticket because they can’t get to a critical business web service. The helpdesk tech knows Server A runs that service on an Apache webserver. Checking the infrastructure monitoring tool, he sees that Server A’s web service is not running. He attempts to start it, and it immediately stops again.
- Is there a problem with the server instance itself?
- Perhaps there’s an Apache web configuration issue?
- Did the development team inadvertently introduce a bug that’s causing Apache to shut down?
The helpdesk tech has no idea. The ticket then gets routed across five teams each with their own monitoring tools configured to ensure functionality in their own space is working.

After several days, the ticket eventually gets to development to discover a tiny code change in a method thought to be used rarely was the issue. New code is pushed to Server A, and the ticket is closed.
Sure, the problem is fixed but at what cost? It took days and multiple teams to discover the root cause. Application stacks can run deep, each with multiple teams managing only a single layer of that stack.
We have a team and tool sprawl problem. Besides that, each tool just monitors its own area. When all we care about is the user experience, why do we only monitor each layer of the stack? This is where SolarWinds APM Integrated Experience comes in.
Introducing the SolarWinds APM Integrated Experience
As mentioned earlier, a great user experience doesn’t come from a single source. A great experience is delivered via applications running on infrastructure with many components in between.
In the SolarWinds’ ecosystem, operators use:
- AppOptics for infrastructure and application monitoring
- Pingdom for user-based monitoring
- Loggly for log management and analytics
All three of these tools work in combination to help organizations maintain a great user service experience. But, they have one drawback; they are all focused on a single area. A user experience is an umbrella that should include all of these tools. APM Integrated Experience is that umbrella.
SolarWinds APM Integrated Experience brings together these popular SolarWinds tools under one roof. It allows you to track down relationships and go deep all the way down to a single line in an obscure log file.
Using the APM Integrated Experience
Now that you’re familiar with where APM Integrated Experience fits into the monitoring and observability ecosystem let’s go over a demo showcasing some of its features.
Production environments are not for experimentation or to be taken lightly. But, to continuously provide more value to your consumers, you must routinely introduce changes through new features, bug fixes, and even new applications.
Let’s say you’re introducing a new feature to a booking service in your application. This service runs on a web tier and is critical to your organization. As soon as you roll out the update to the booking service, the help desk immediately begins receiving calls from angry users.
You need to get to the bottom of this booking service feature problem immediately.
1. Run a Transaction Check
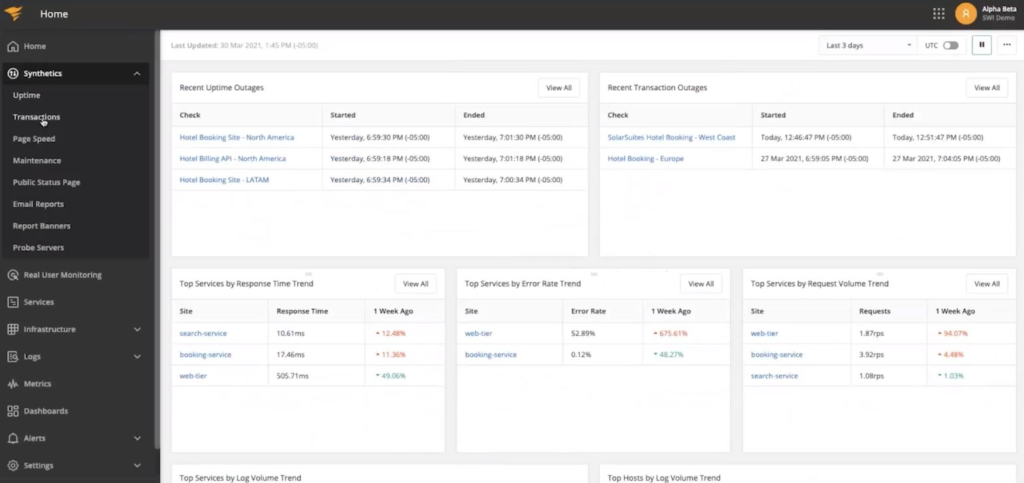
In the SolarWinds APM Integrated Experience, navigate to the Transaction Check Test page by clicking on the Synthetics dropdown and then click on Transactions.
The Transactions report provides extensive reporting on individual transactions being processed by your application.
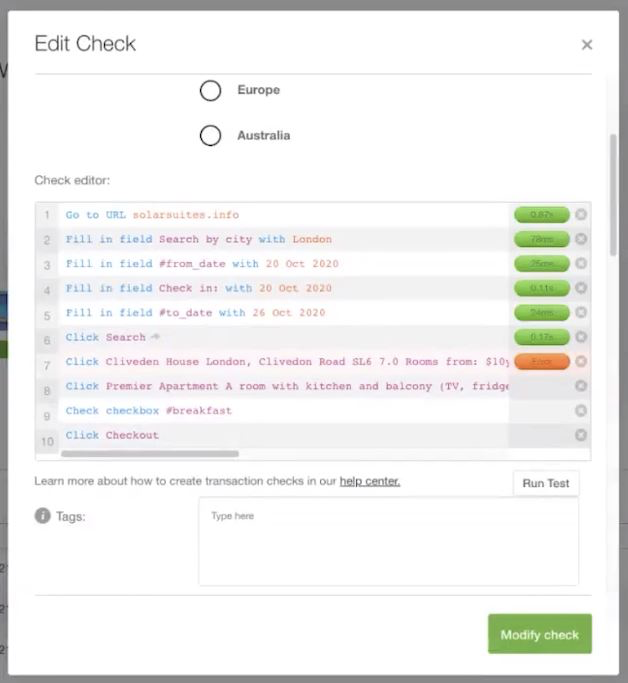
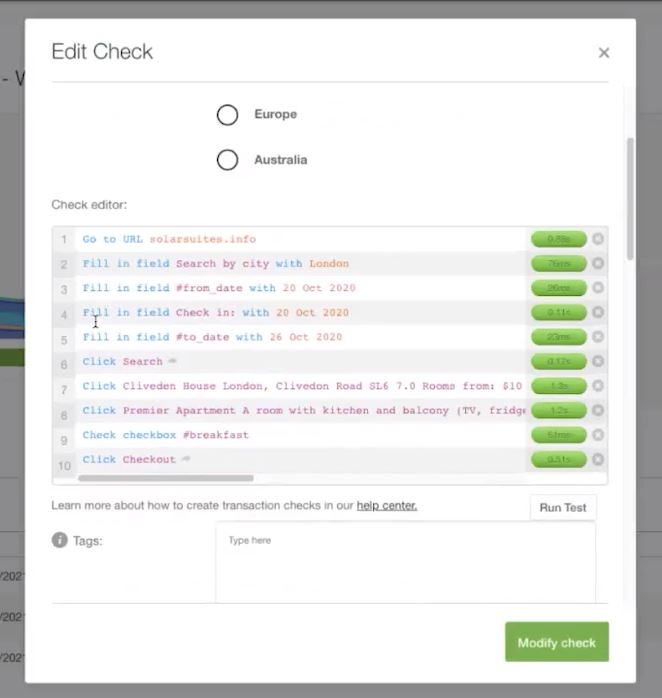
Run a new test by clicking the Run Test button to simulate a real user interaction experience. This test will break down transactions into steps like filling in text boxes, checking boxes, and clicking buttons to simulate real user actions.
The Transaction Check test, in real-time, performs common user actions and measures the performance of each transaction. This step-by-step process gives you a feel for what the user may be experiencing and gives you red/green visual cues to where a potential problem might lie.
In this example check, notice the #9 transaction has failed. For some reason, when the test enabled the #breakfastpjd checkbox, something unexpected happened. Let’s figure out what went wrong.
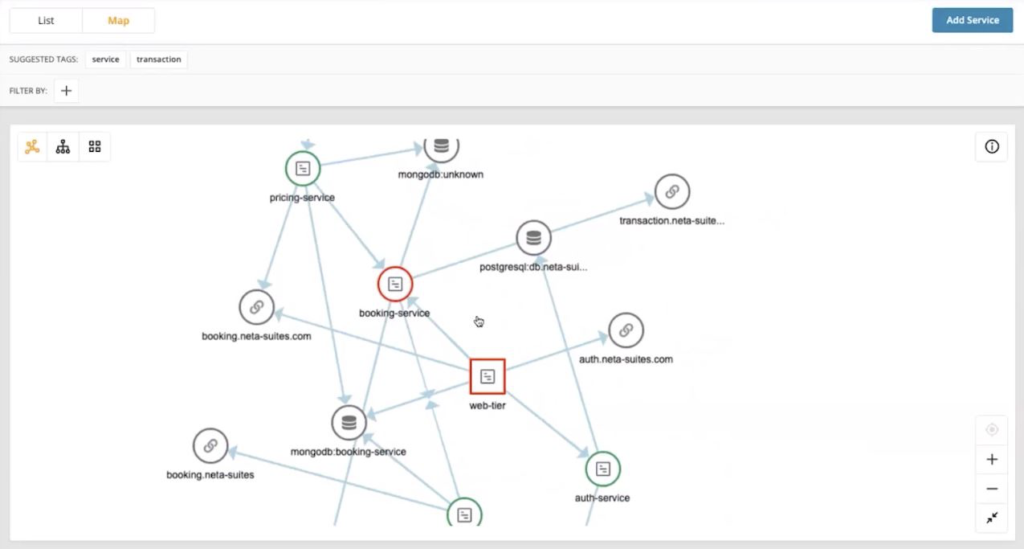
2. Investigate the Service
Once you can confirm where the transaction is failing, it’s time to dig further and inspect the service. Perhaps the transaction check above failed in the booking service. You can see below that the booking service and the web tier hosting that service is in red indicating a problem.
Now, click on Services and notice that the service is not performing. Both the Average Response Time and Requests Rate is up.
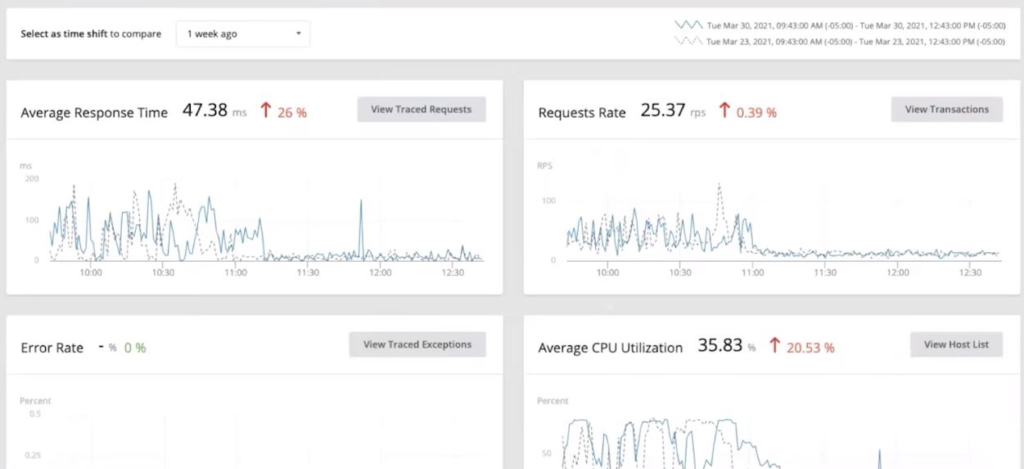
To dig in deeper, click on Traced Requests. This handy feature provides a heat map showing activity along a timeline.
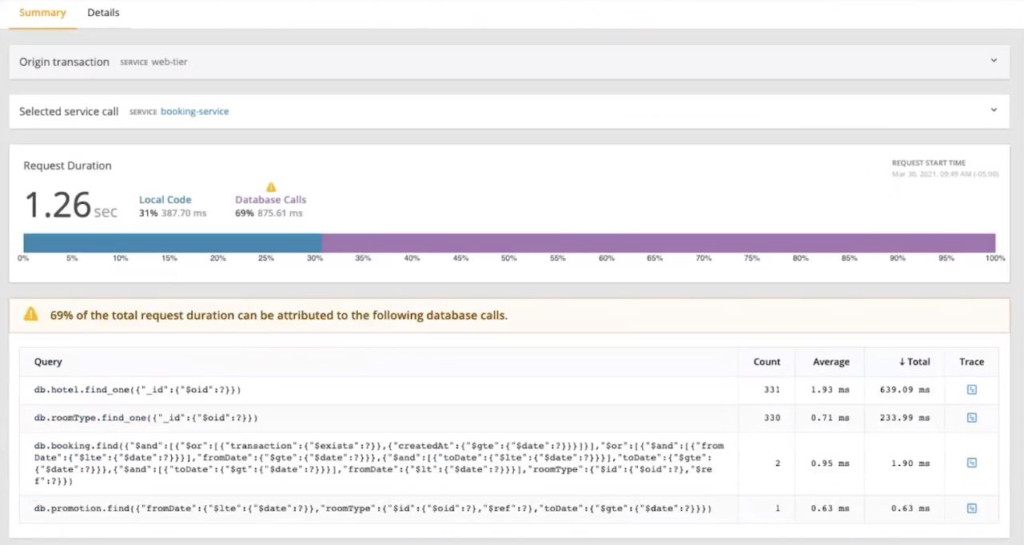
Click on a transaction outlier on the heat map and you notice that there are too many requests to the database. You can see this in the Request Duration box that breaks up local code execution with Database calls.
You can also see below that the APM Integrated Experience shows a warning indicating that database calls have consumed 69% of the total request duration.
3. Get Granular with Logs
You now know there’s a problem with the database, but what? You need to dig down further and inspect the logs.
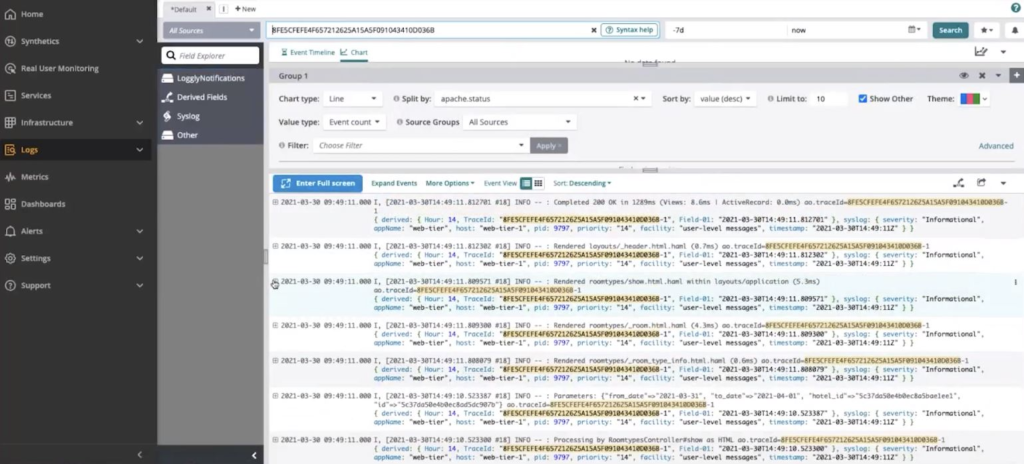
- Click on Logs in the left-hand pane to dive deeper into what’s going on.
- Now search for the trace ID captured from earlier in the logs. You now get an idea of what’s the problem is to fix it.
4. Fix, Confirm and Monitor
Now that you know exactly what’s went wrong, fix the code. Once that’s done, run another transaction test to confirm the transaction no longer fails. This check now indicates the database is no longer hitting a warning threshold.
If the previously-failing transaction is now green, you can be sure you’ve fixed the bug.
Finally, you now know this might be a potential problem in the future and should monitor it. To ensure the problem doesn’t crop up again, set a monitor to continuously test the application’s performance to be notified of any other issues in the future!
Conclusion
The APM Integrated Experience gives you the tools to keep digging. You can go from reproducing the exact error to recognizing the failing service all of the way down to a single line of a log causing the problem.
You don’t have to hop around between tools with the APM Integrated Experience. It accelerates the troubleshooting process and ultimately makes for a much happier customer!


