


If you are stressing over data analysis and manually carrying out query statements or manual imports, why not consider using the Power BI Data Gateway? With Power BI Data Gateway, you can simplify and virtualize data analysis.
In this tutorial, you will learn how to set up data sources seamlessly and efficiently using Azure SQL Server and On-premises data gateway.
Improve your day-to-day data visualization by connecting sources to your Power BI Data Gateway!
Prerequisites
This tutorial will be a hands-on demonstration. To follow along, be sure you have the following:
- Power BI installed on your local machine, the version in this tutorial is 2.97.
- An account on the Azure Portal.
Connecting On-premises to Power Bi Data Gateway
On-premises data gateway bridges the gap between Power-Bi and cloud-related apps or software, creating a path where you can securely move your data from one end to another. Although the gateway is not responsible for transferring data, the gateway creates a server or a medium to transfer your data.
Before connecting the on-premises data gateway to Power BI, you must install the standard gateway on your local machine.
Check the requirements for On-Premises Gateway installation.
1. Download the standard gateway file, and open the installer once downloaded.
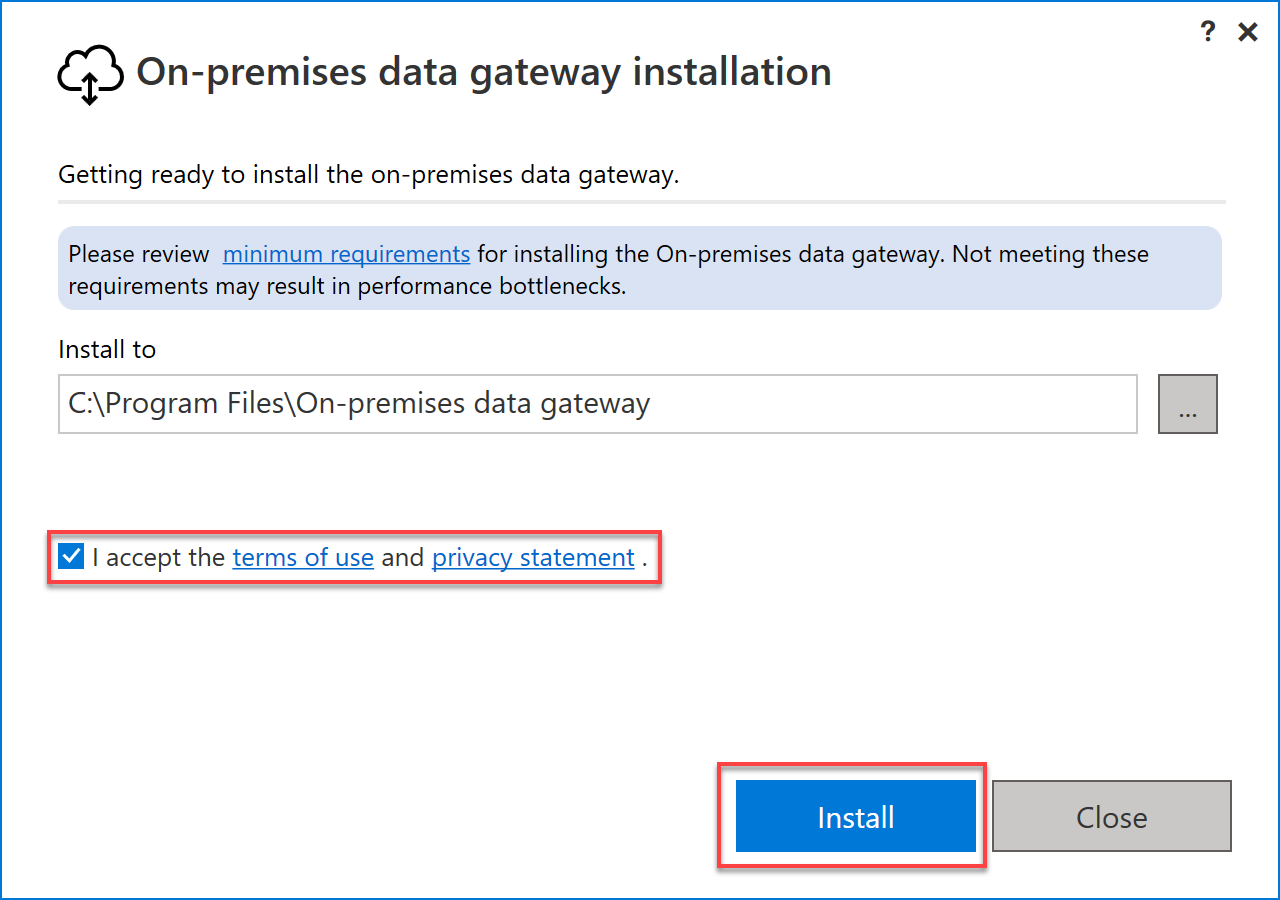
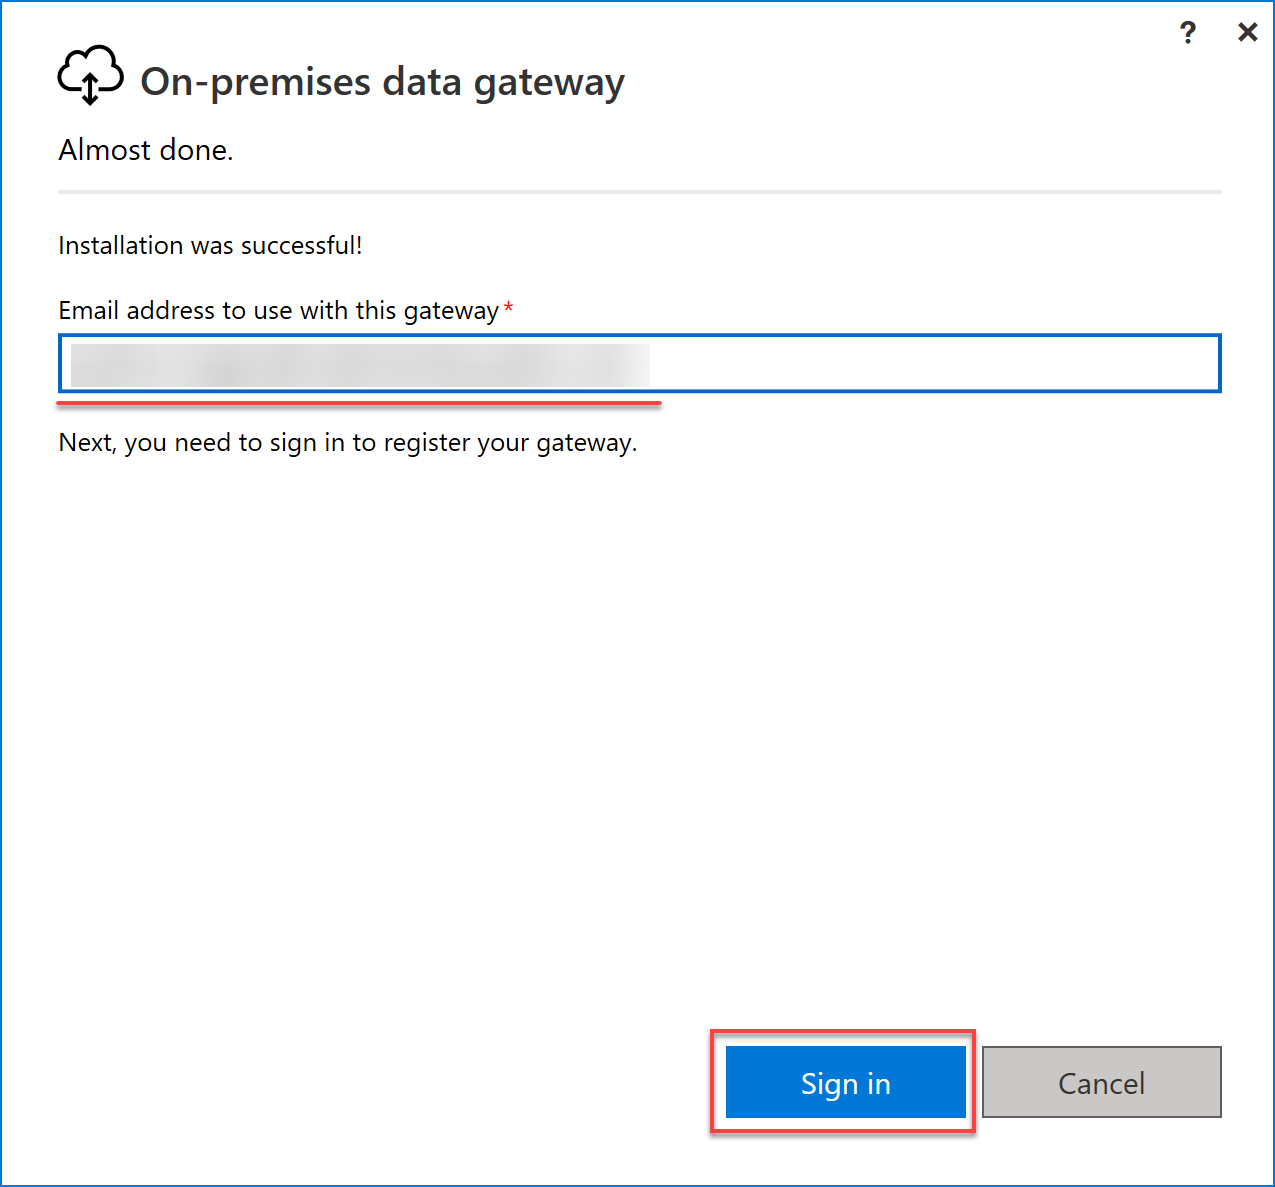
2. Next, provide the email address you want to connect to the gateway and click Sign In. Ensure the email address is the same as the one connected to your Power Bi account.
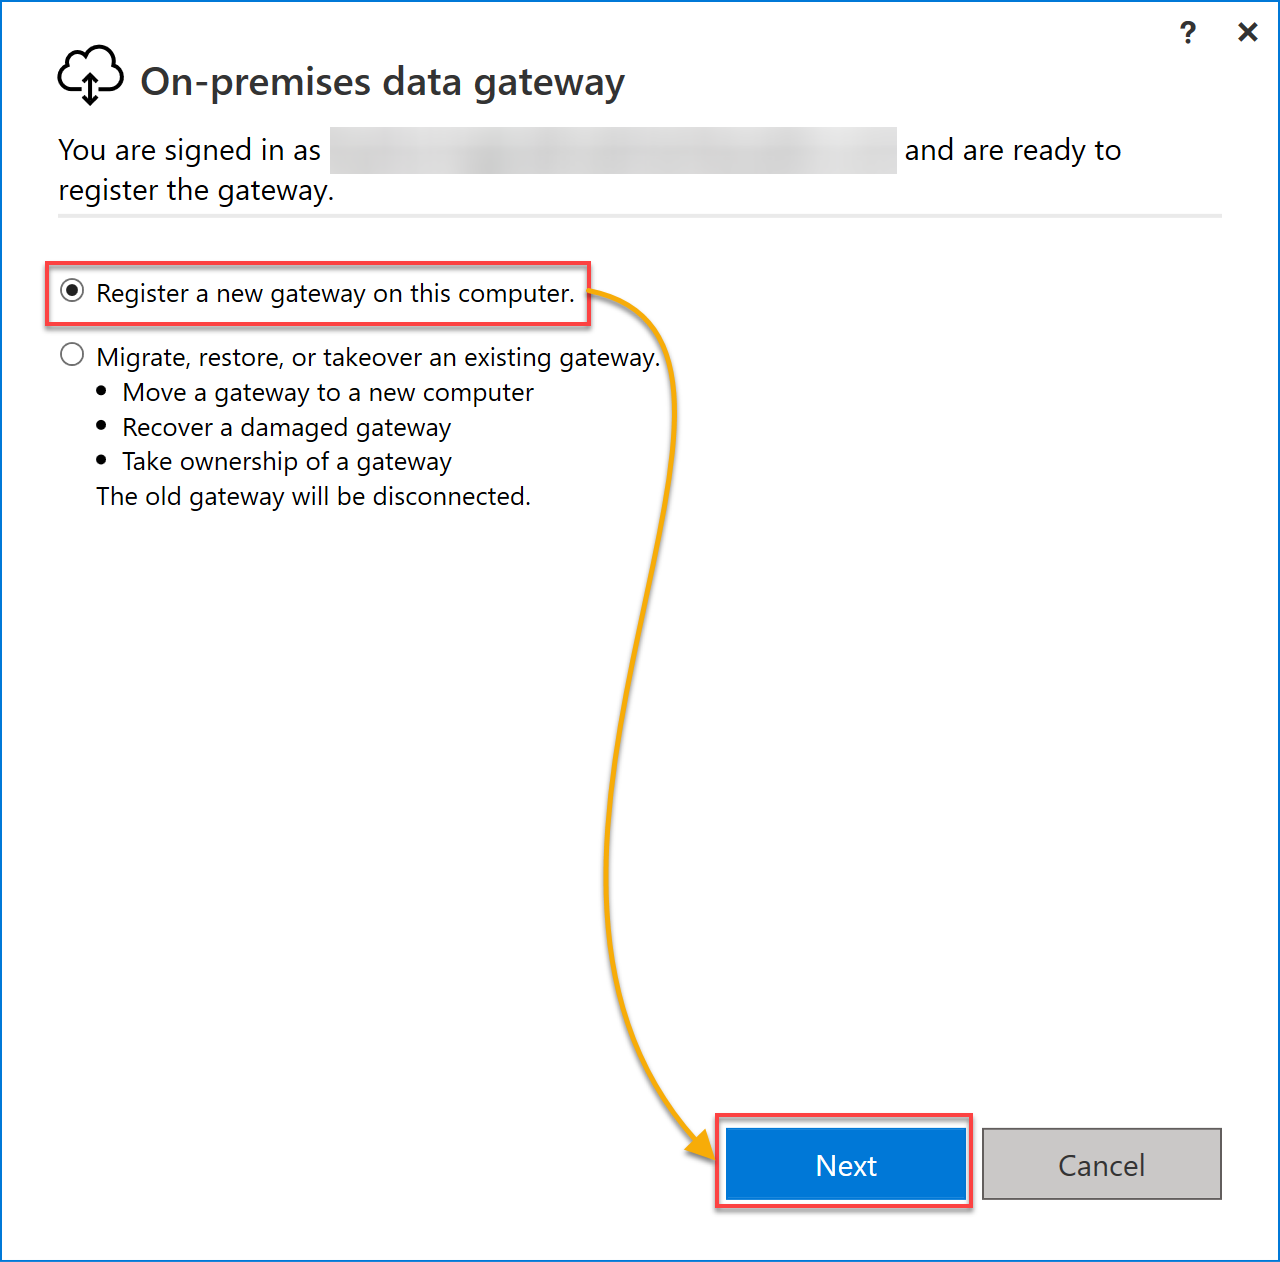
3. Once signed in, choose the Register a new gateway on this computer option, and click Next. This option creates a new gateway on the On-premises data gateway.
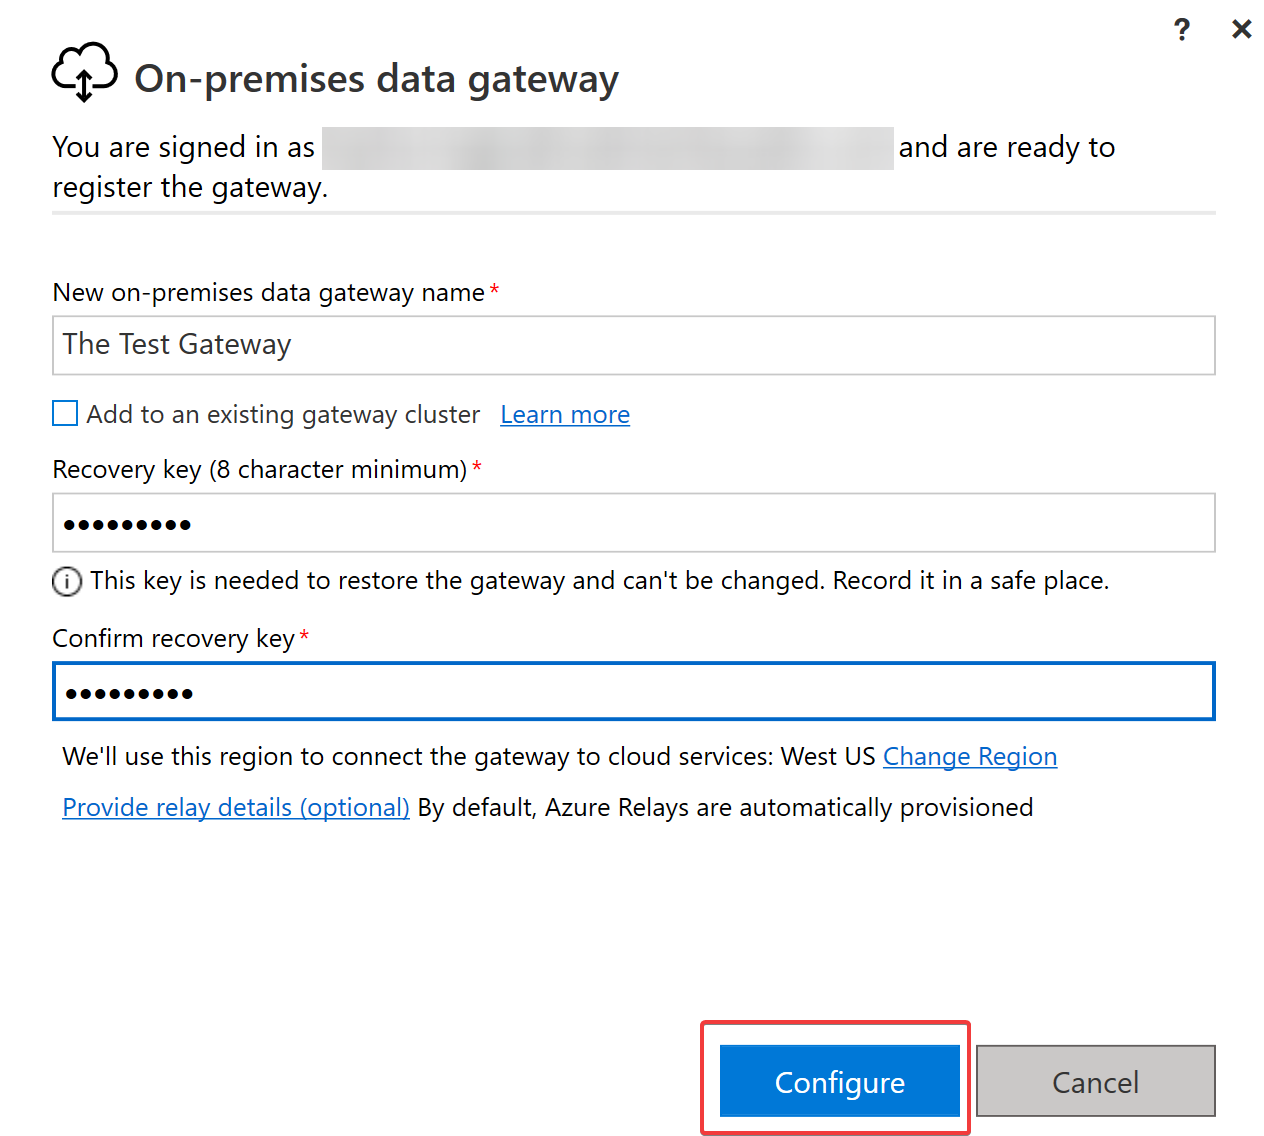
4. Now, configure the on-premises data gateway with the following:
- Provide an on-premises data gateway name.
Optionally, tick the Add to an existing gateway cluster box to add the data gateway to an existing cluster.
- Provide, and confirm a Recovery key that consists of a minimum of eight characters. This key is stored and used to verify your ownership when you lose access to the on-premises gateway.
- Click Configure to save your settings and set up your created on-premises data gateway.
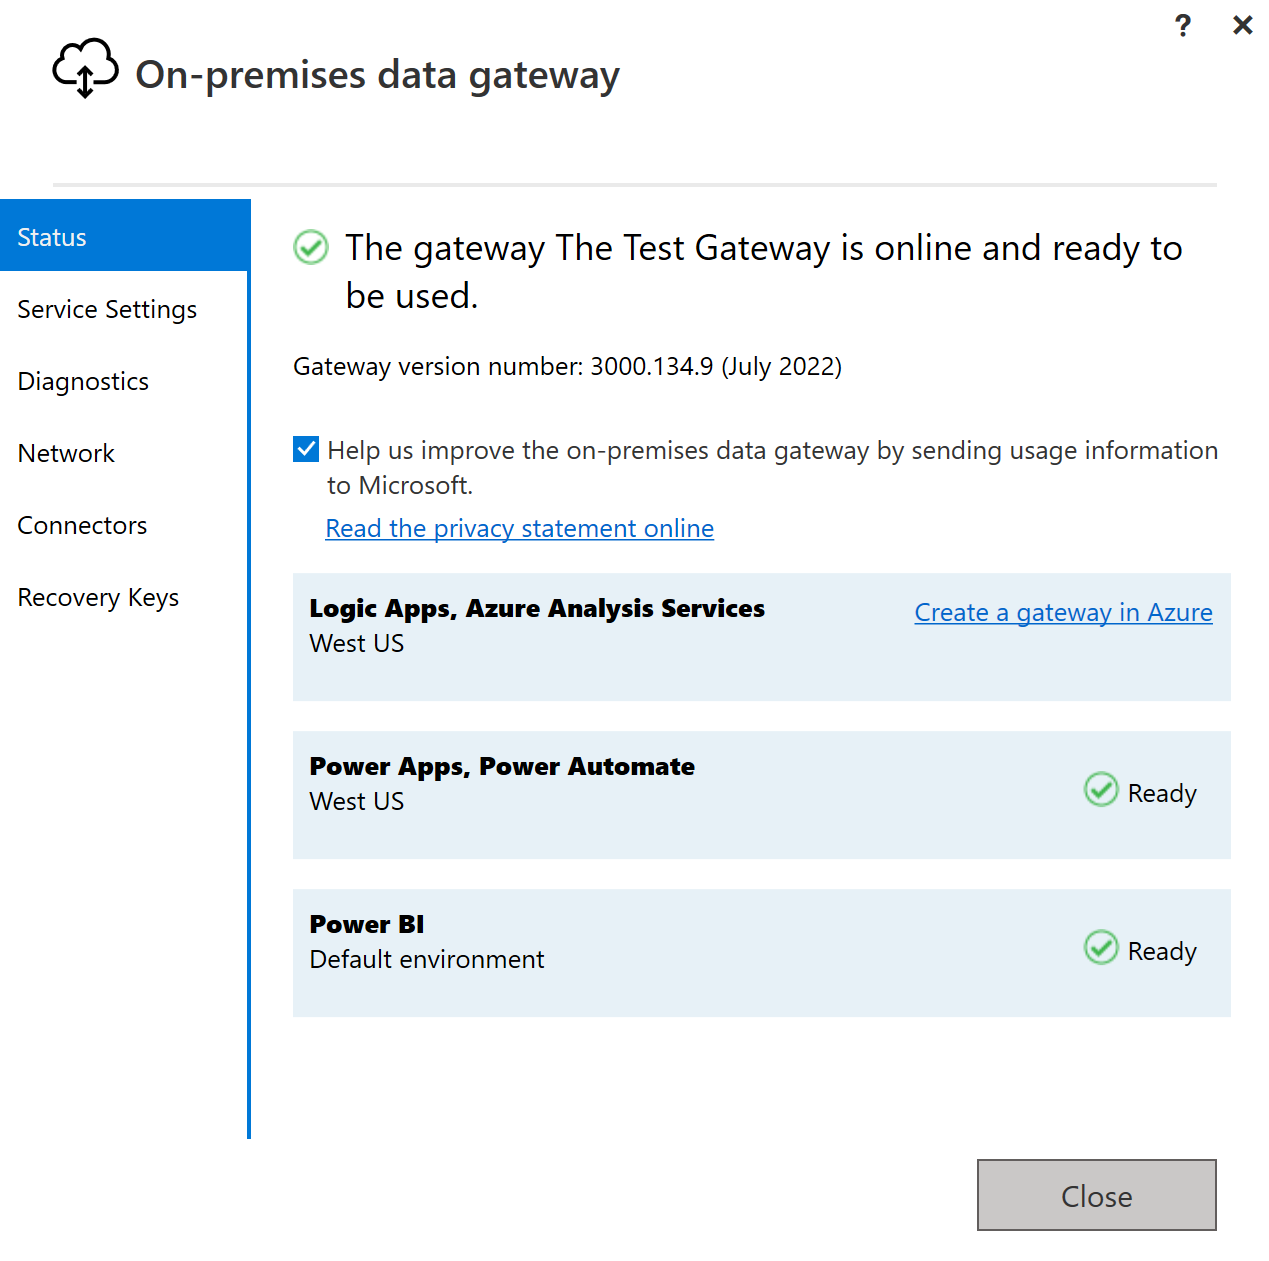
Below, you can see a page that confirms your gateway has been configured and is ready for use.
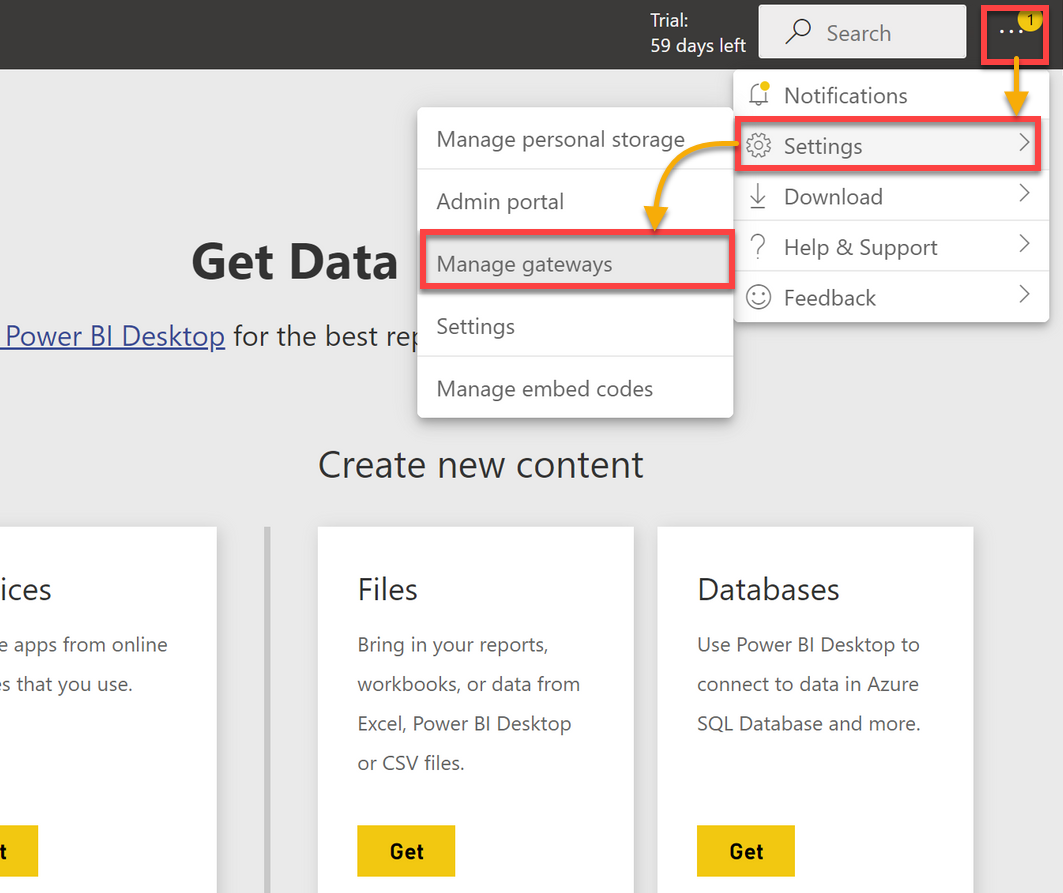
5. Open your Power BI app or workspace, click on the ellipsis (three dots) on the top-right → Settings → Manage gateways to access all your connected gateways or data sources.
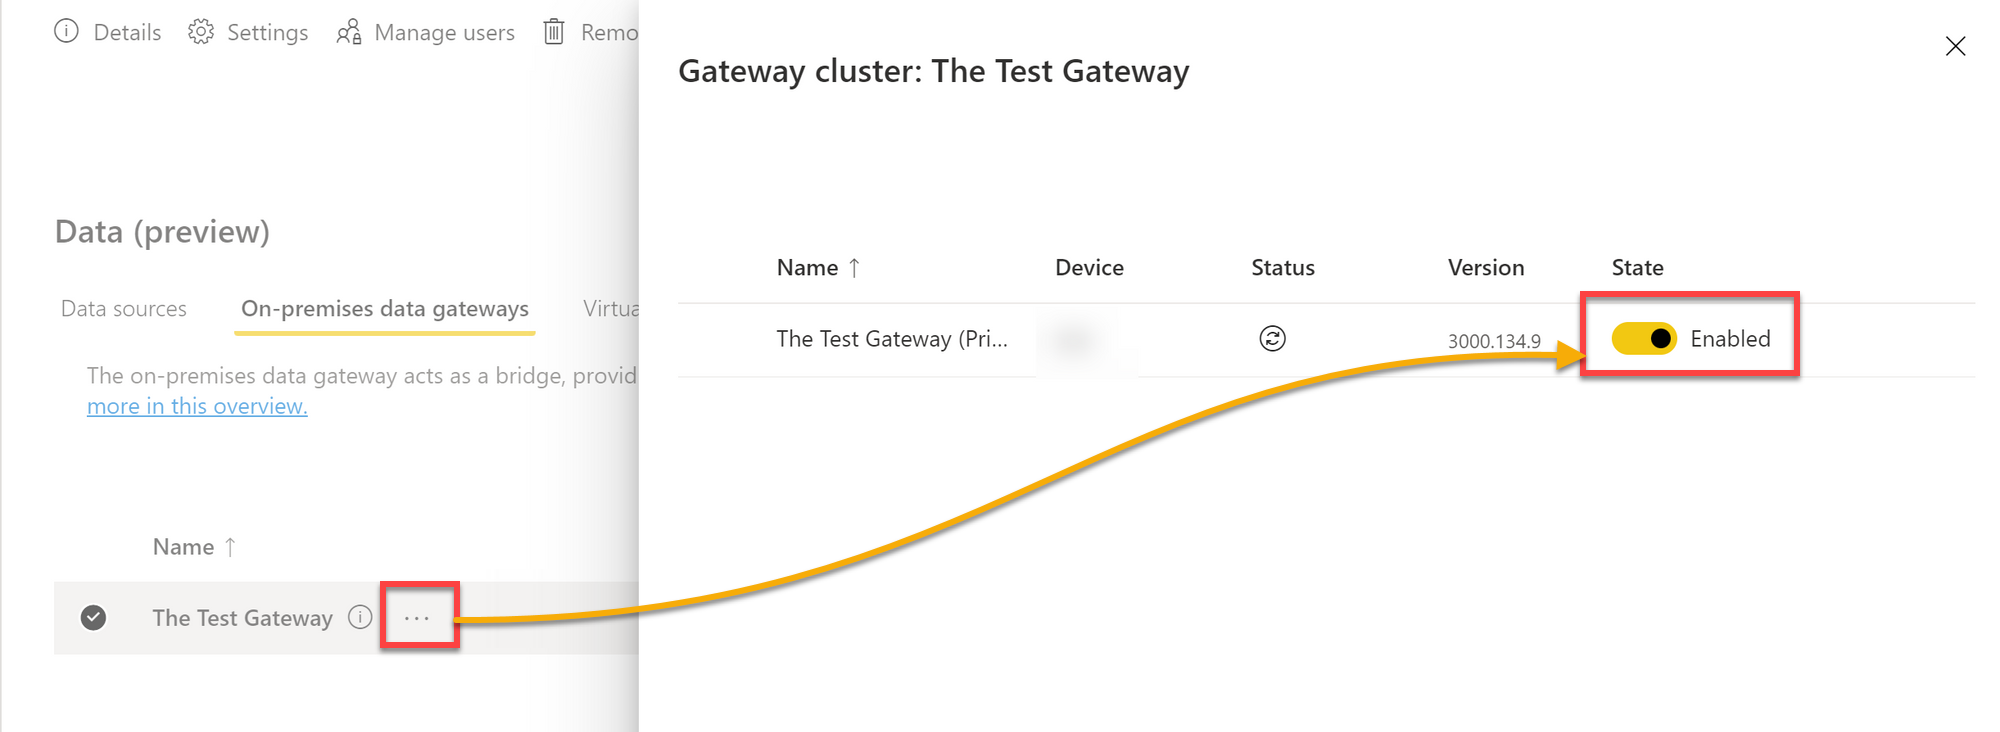
6. Click the ellipsis next to your data gateway’s name and ensure the gateway is enabled from the blade that opens to the right.
The Enabled status, as shown below, indicates the gateway is active and online.
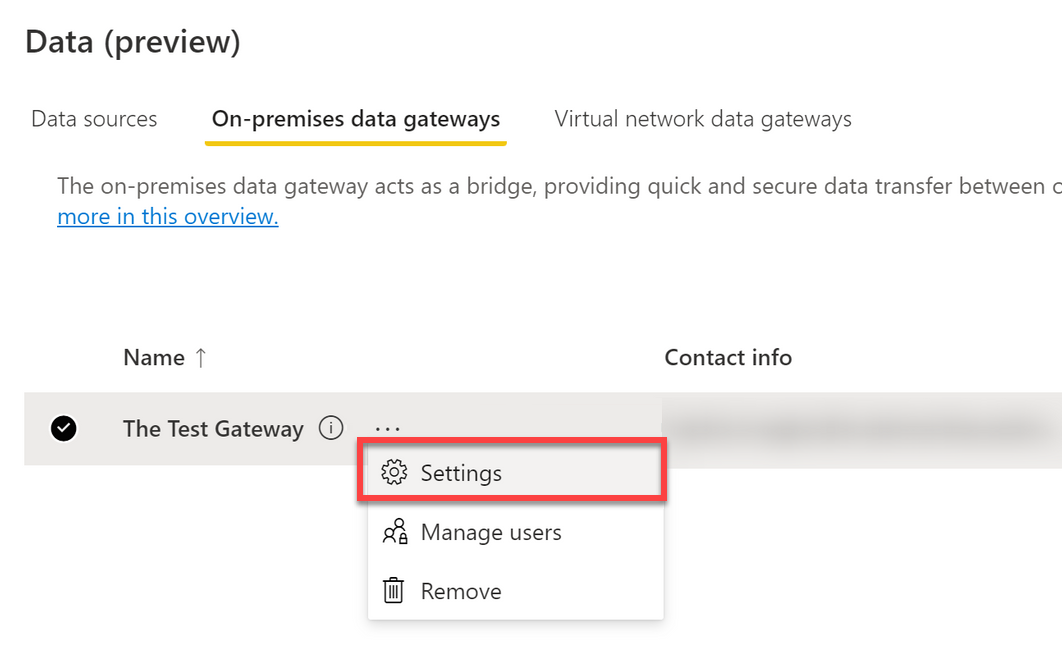
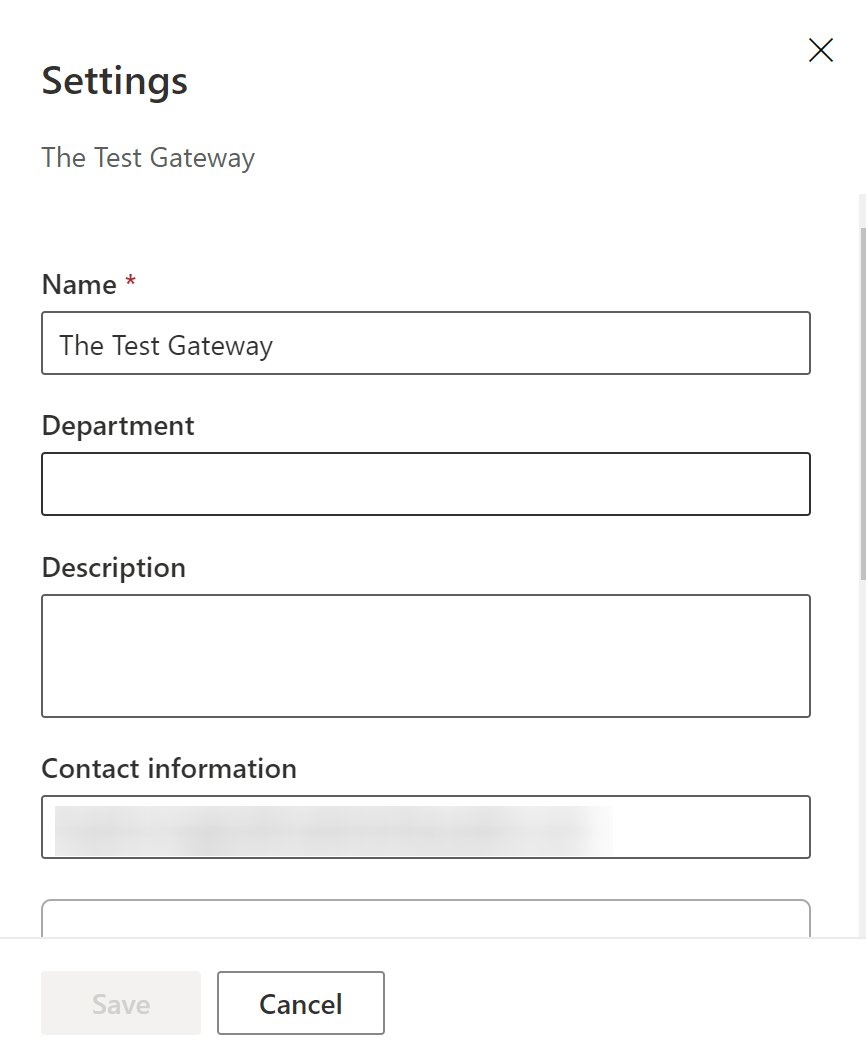
7. Next, click on the ellipsis again beside the data gateway and choose Settings to configure your gateway cluster settings.
8. Configure the settings below, but leave the Description and Department fields empty.
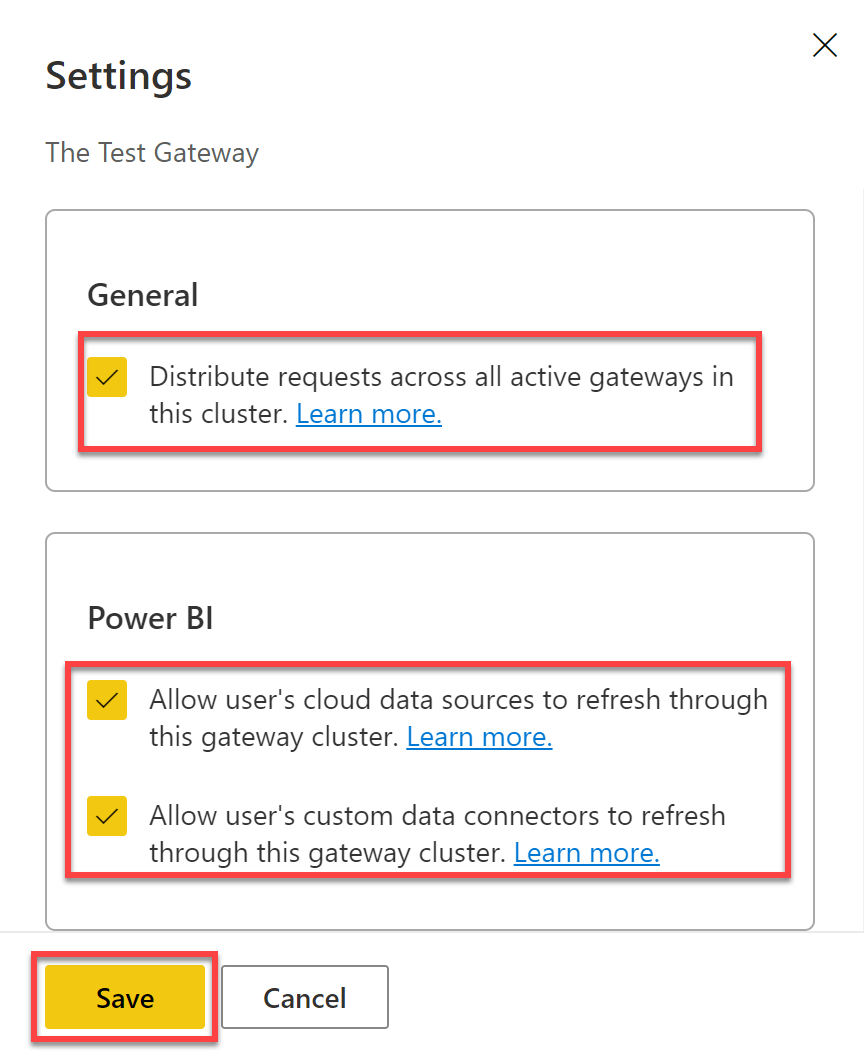
9. Lastly, tick all the boxes, and click Save to save the settings, and you have successfully connected the on-premises data gateway source to your Power BI account.
Now, you can easily send data through this source using SQL Server, Azure, or AWS data sources.
Connecting Azure SQL Database to Power BI
By connecting Azure and Power BI, you can perform data processing into analytics and report that provides real-time insight into any business or company. They both can develop complex business and intellectual solutions using built-in connectivity.
Don’t worry. You don’t need to write code to connect Azure tools and software to Power BI.
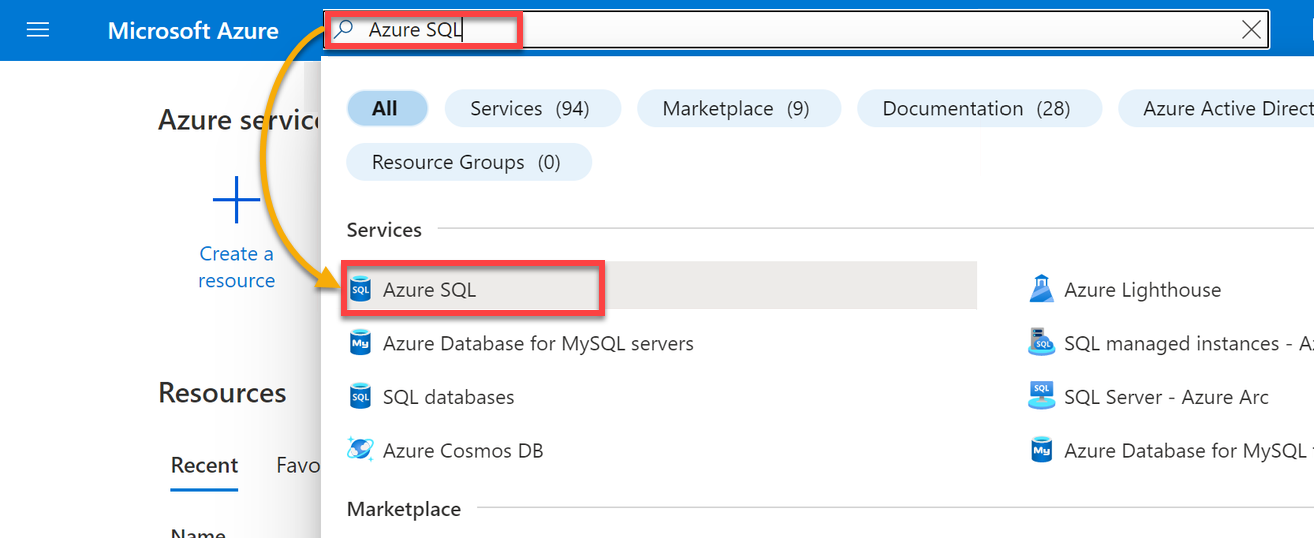
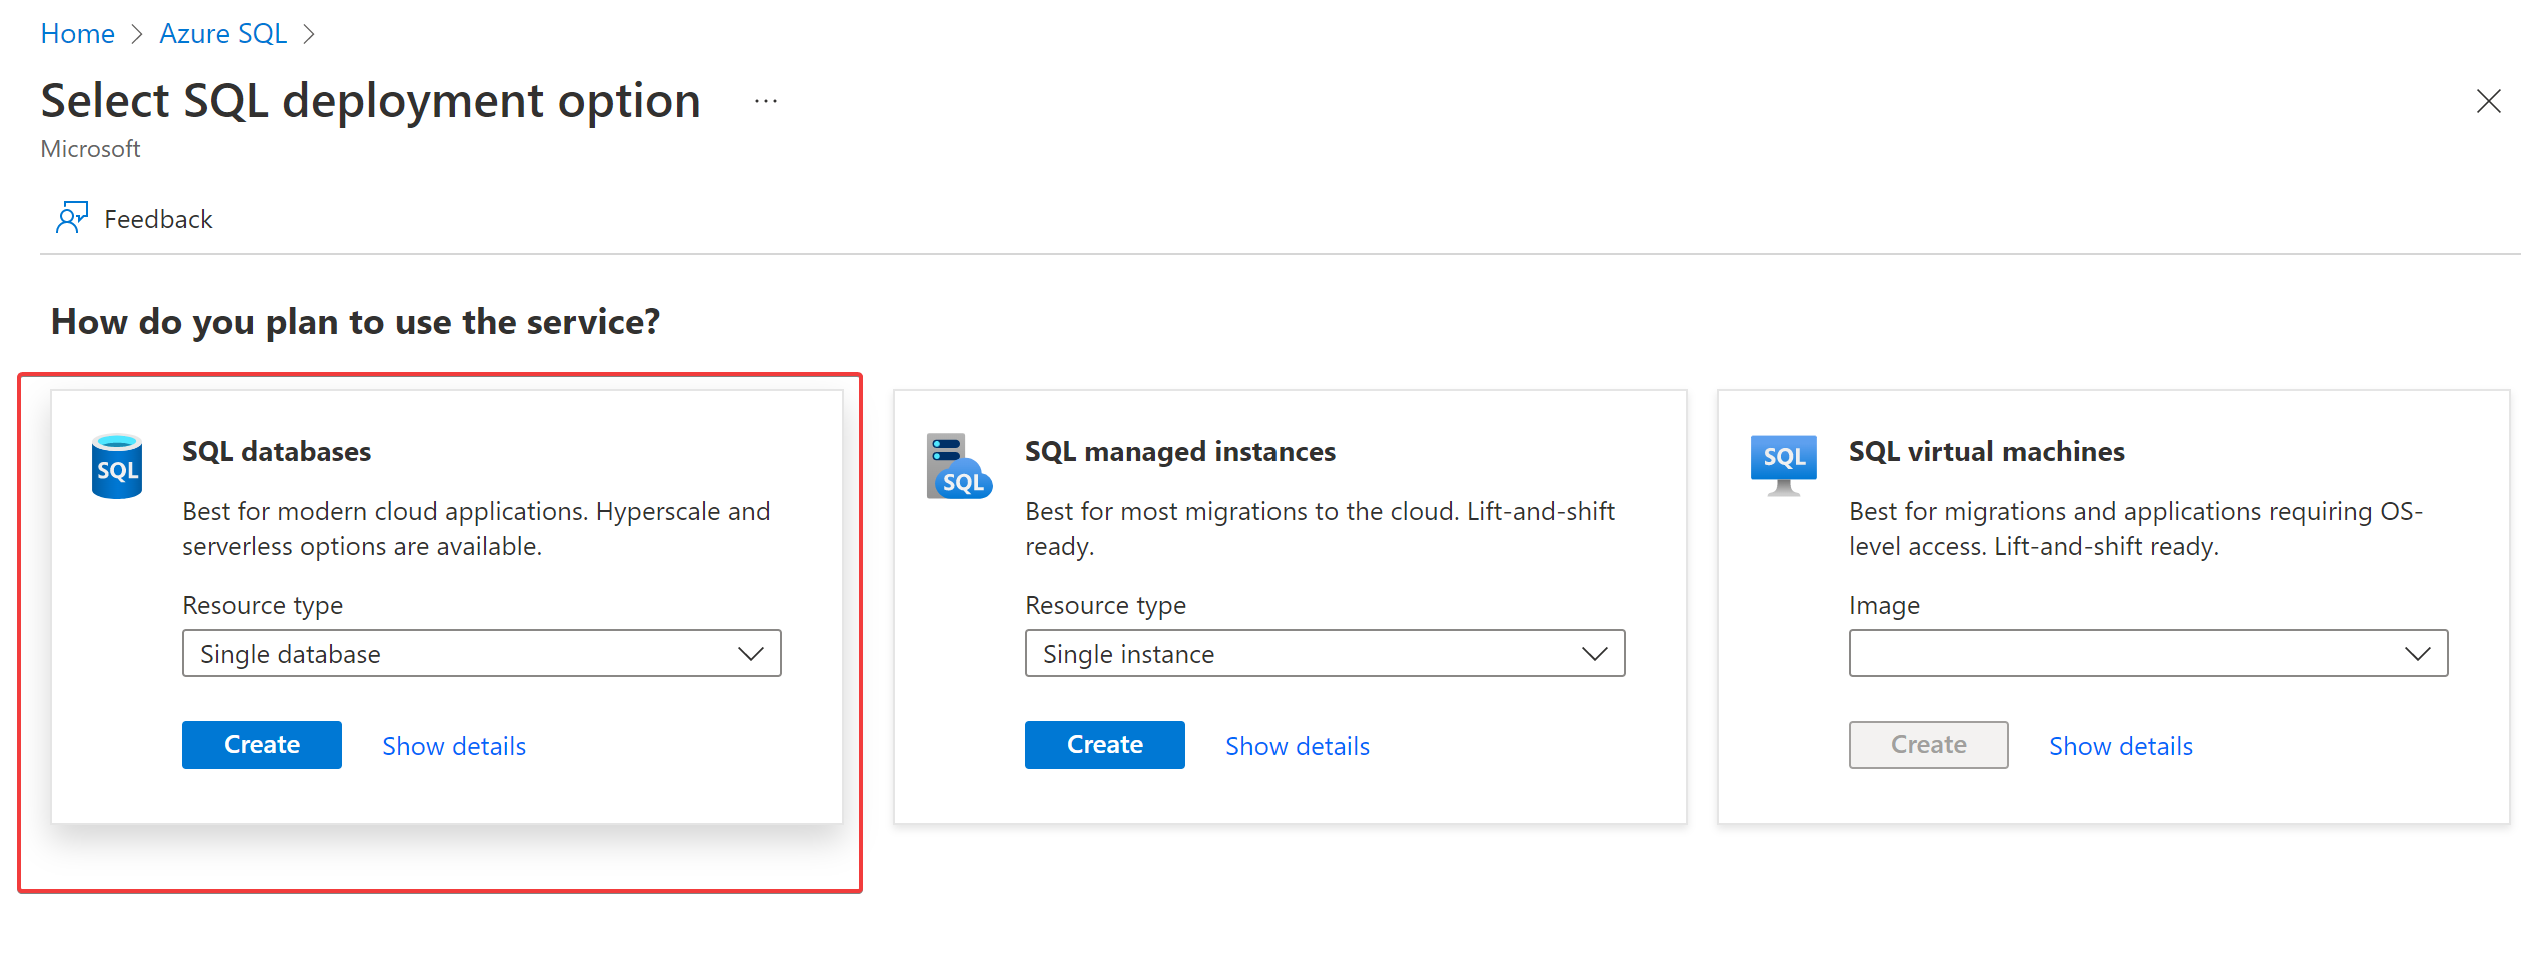
1. On the Azure Portal, search for Azure SQL and select the Azure SQL service that comes up to access Azure SQL.
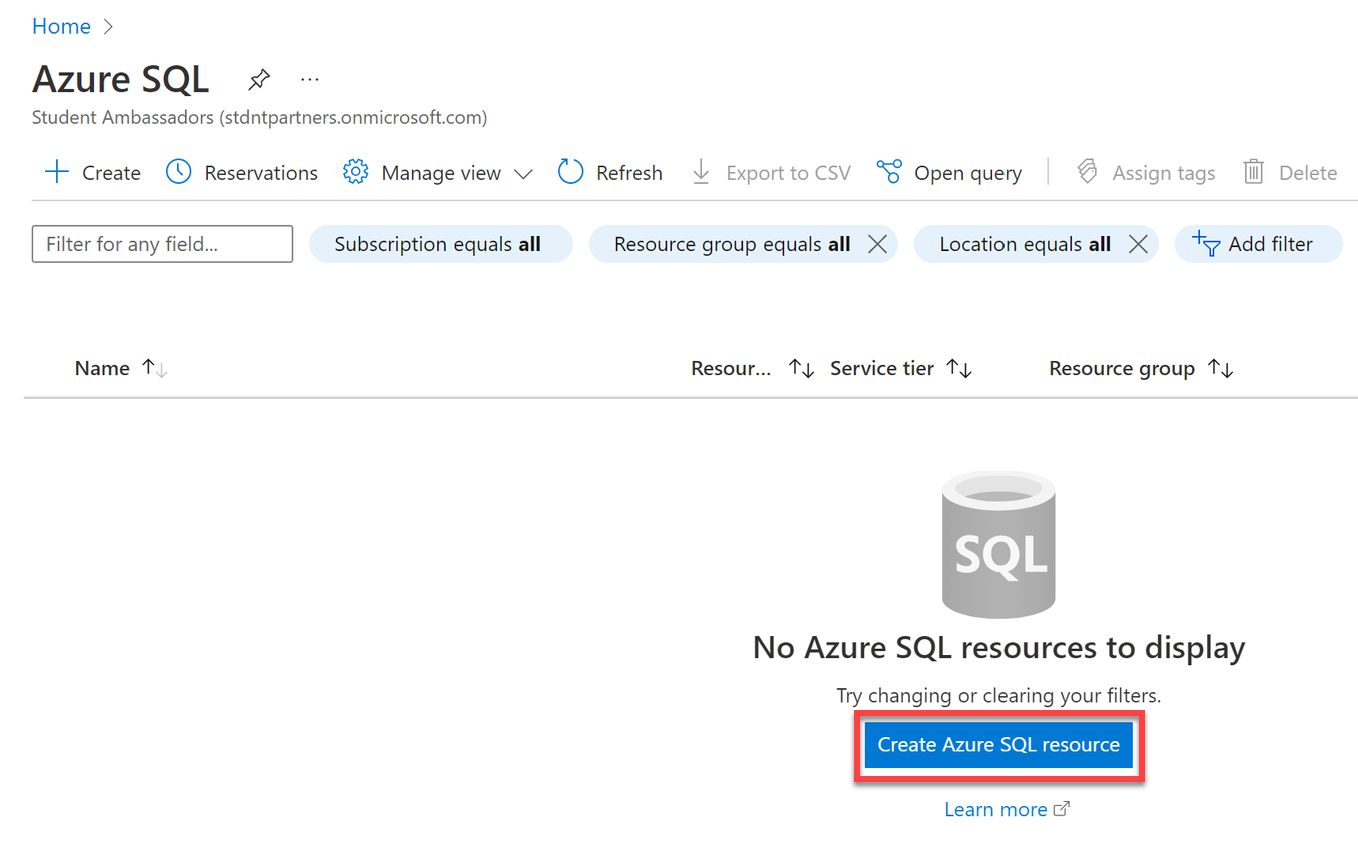
2. On the Azure SQL page, click Create Azure SQL resource, which opens a configuration setting for the Azure SQL resource page.
3. Click Create under SQL databases to create a single database.
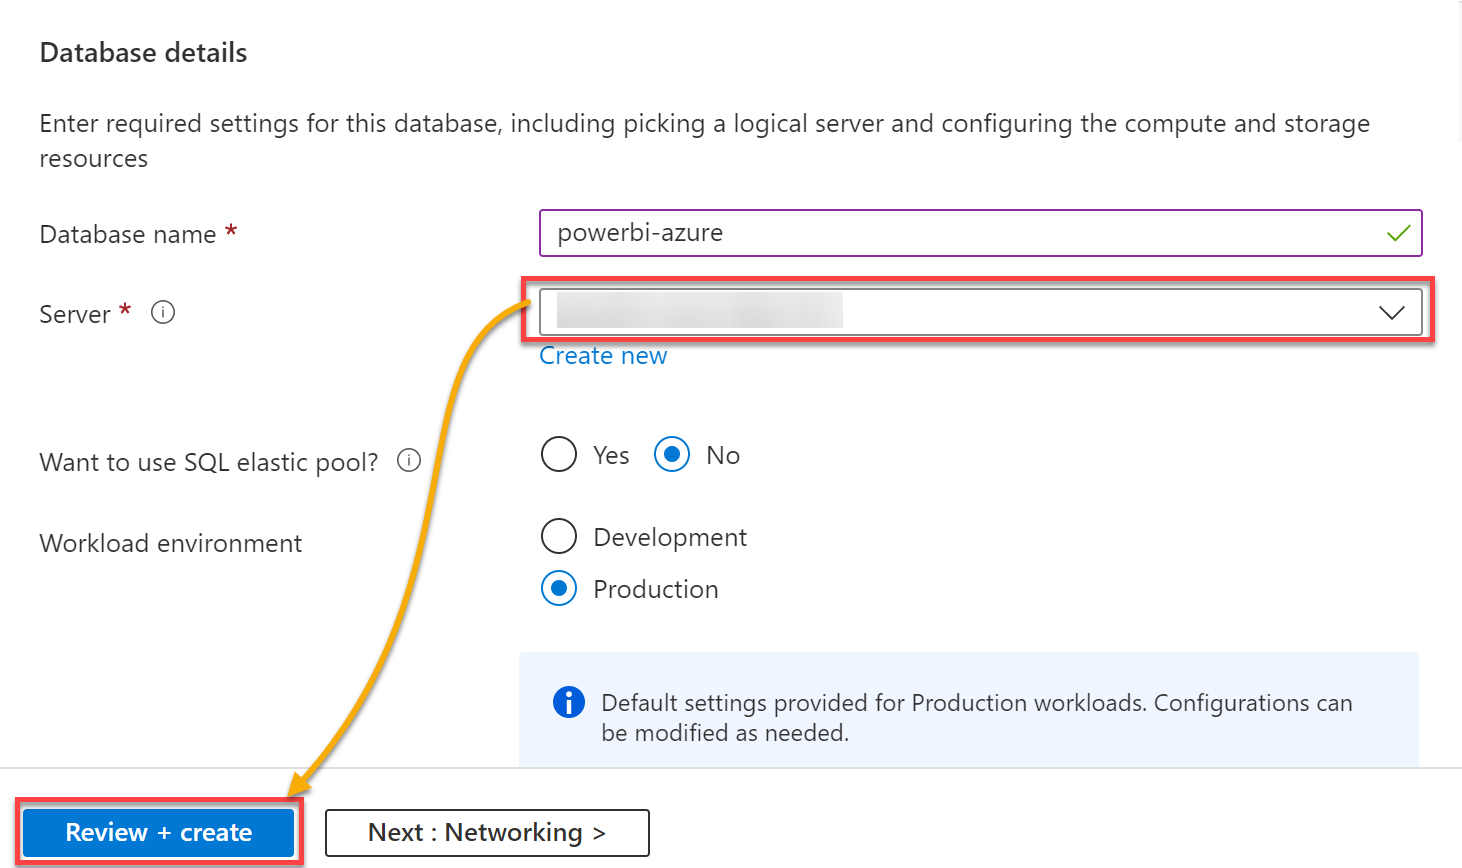
4. Provide a descriptive Database name, and click on the Create new link to create a new server first.
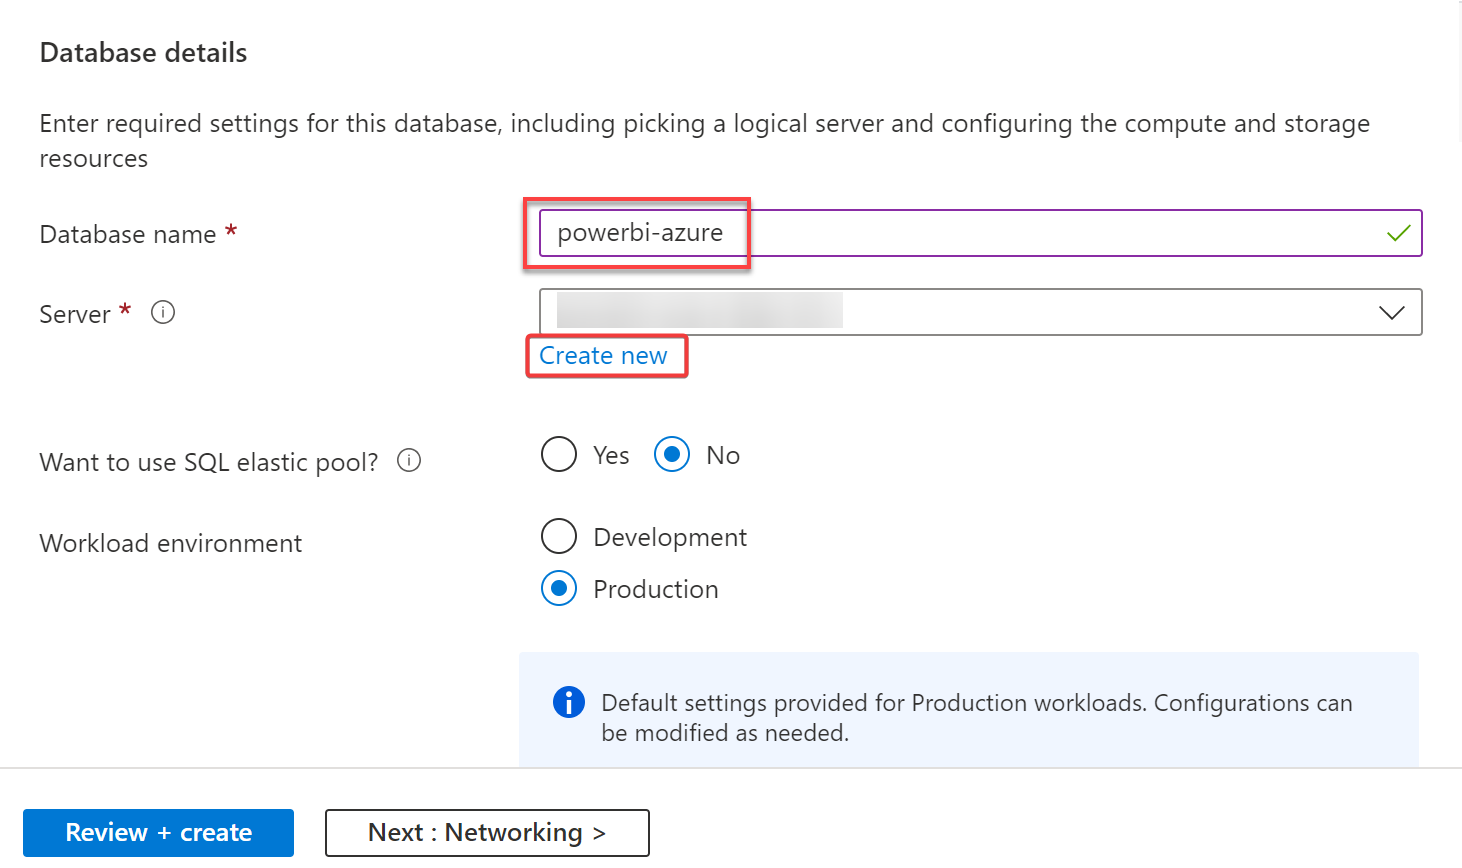
5. Input a unique server name, and select a location nearest to you.
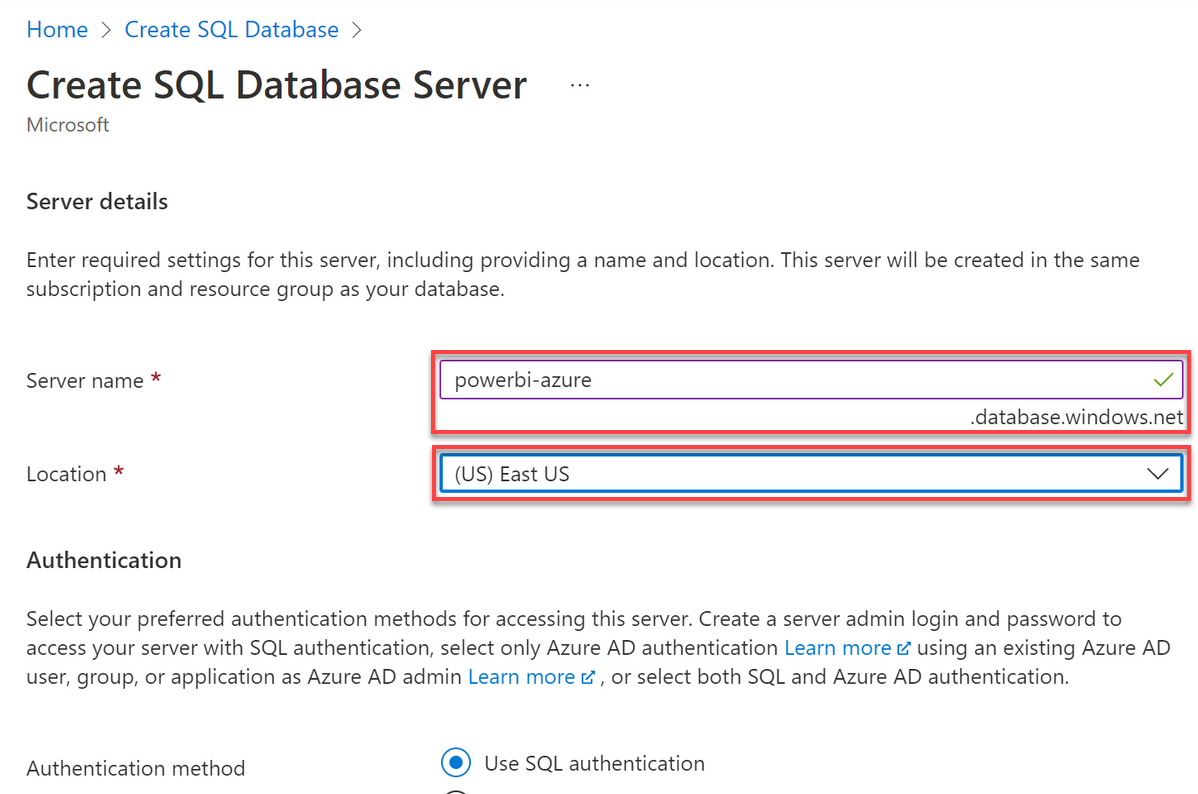
6. Scroll down to the Authentication section, and configure the authentication with the following:
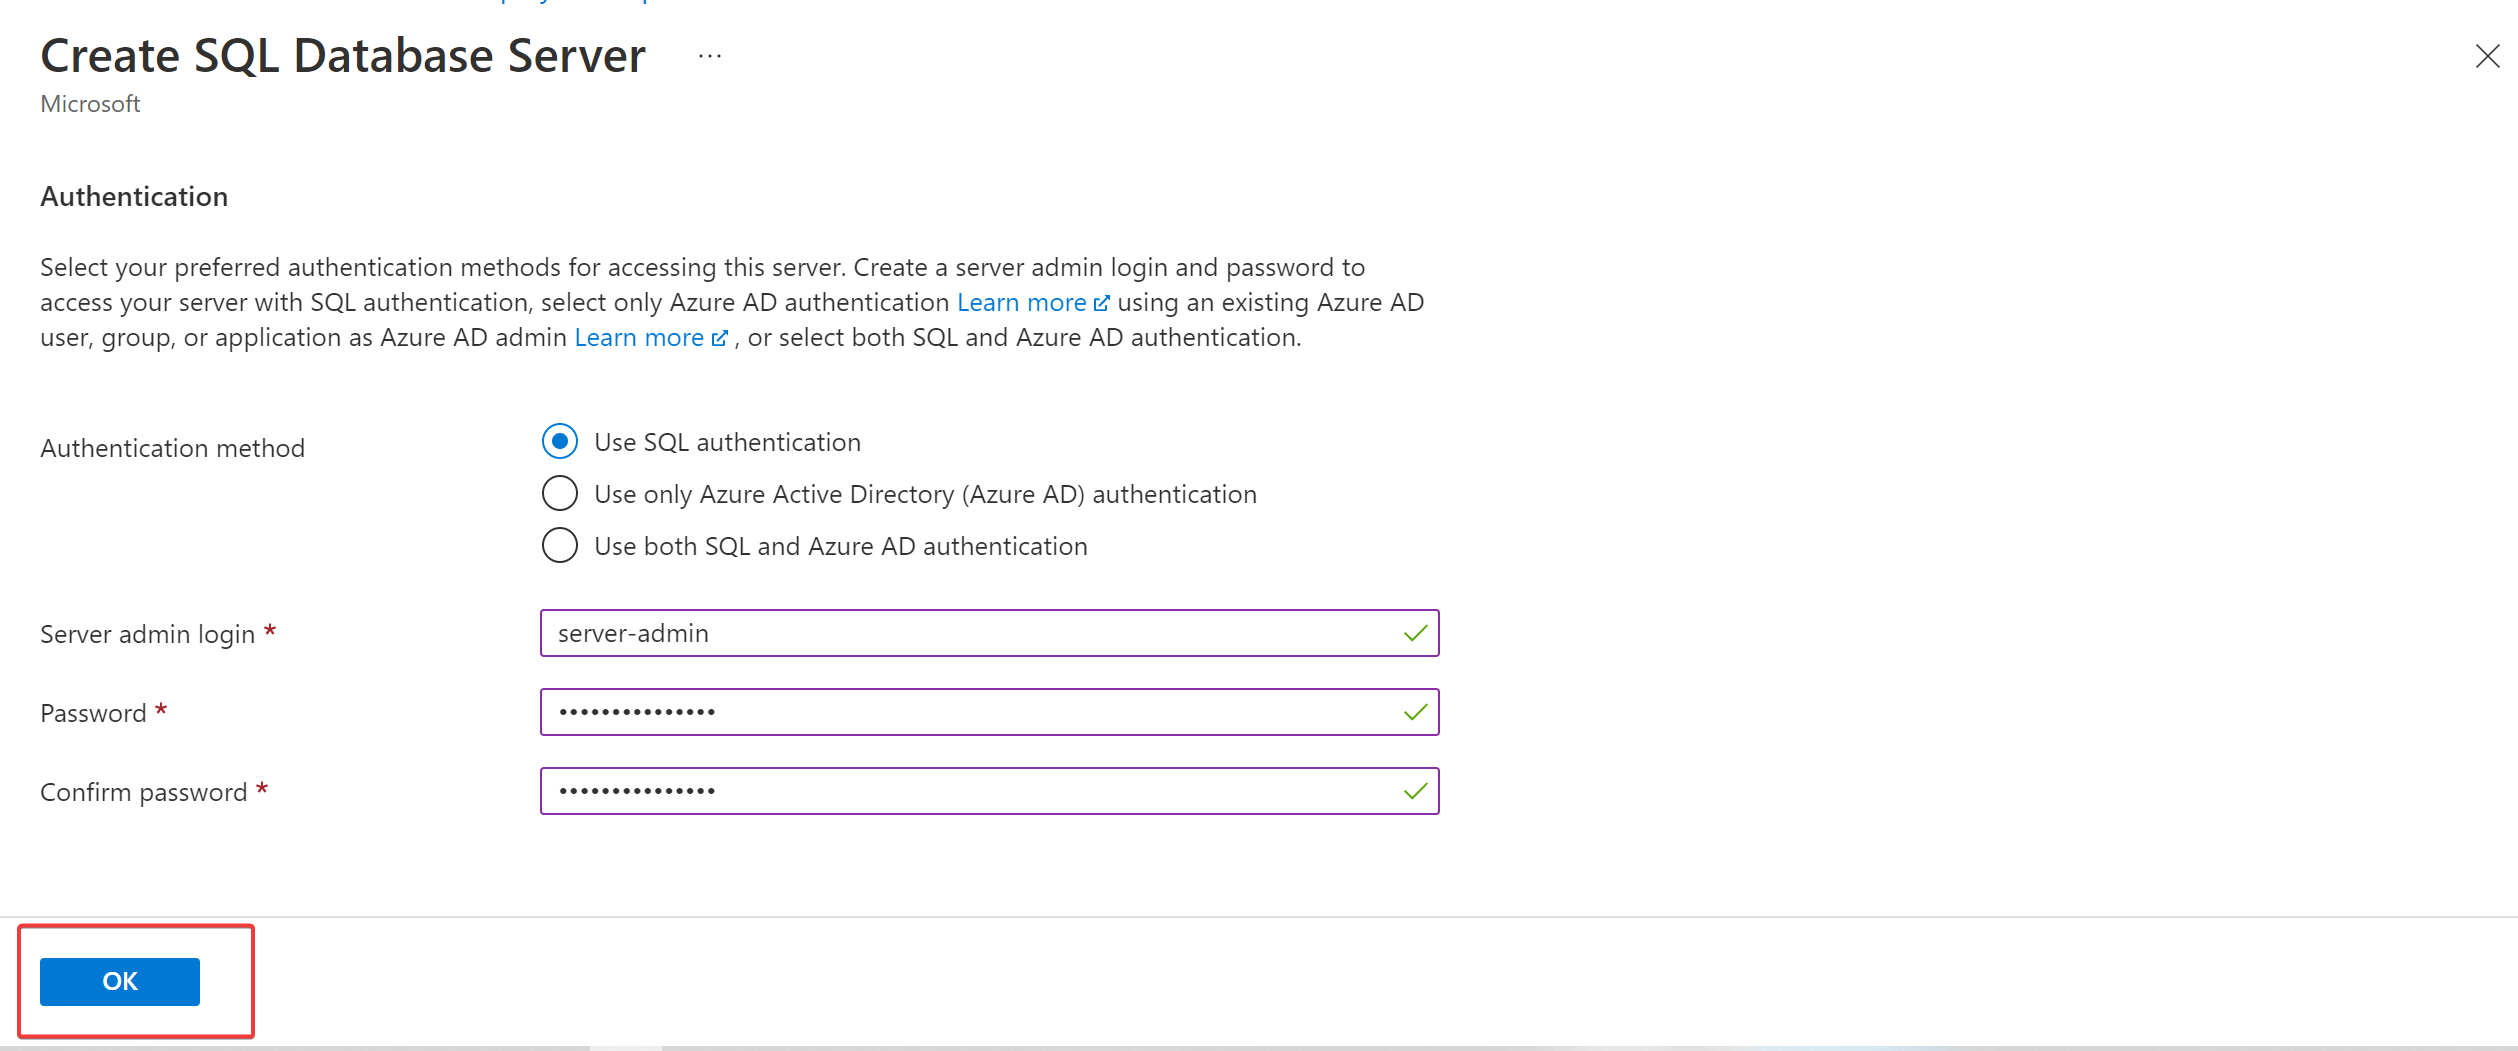
- Authentication method – Choose the Use SQL authentication.
- Server admin login, Password, Confirm password – Provide an admin name (server-admin) and password.
- Click OK to create SQL admin details for our SQL database.
7. Back to the database settings, select the created server as the server, leave other options on default, and click Review + Create.
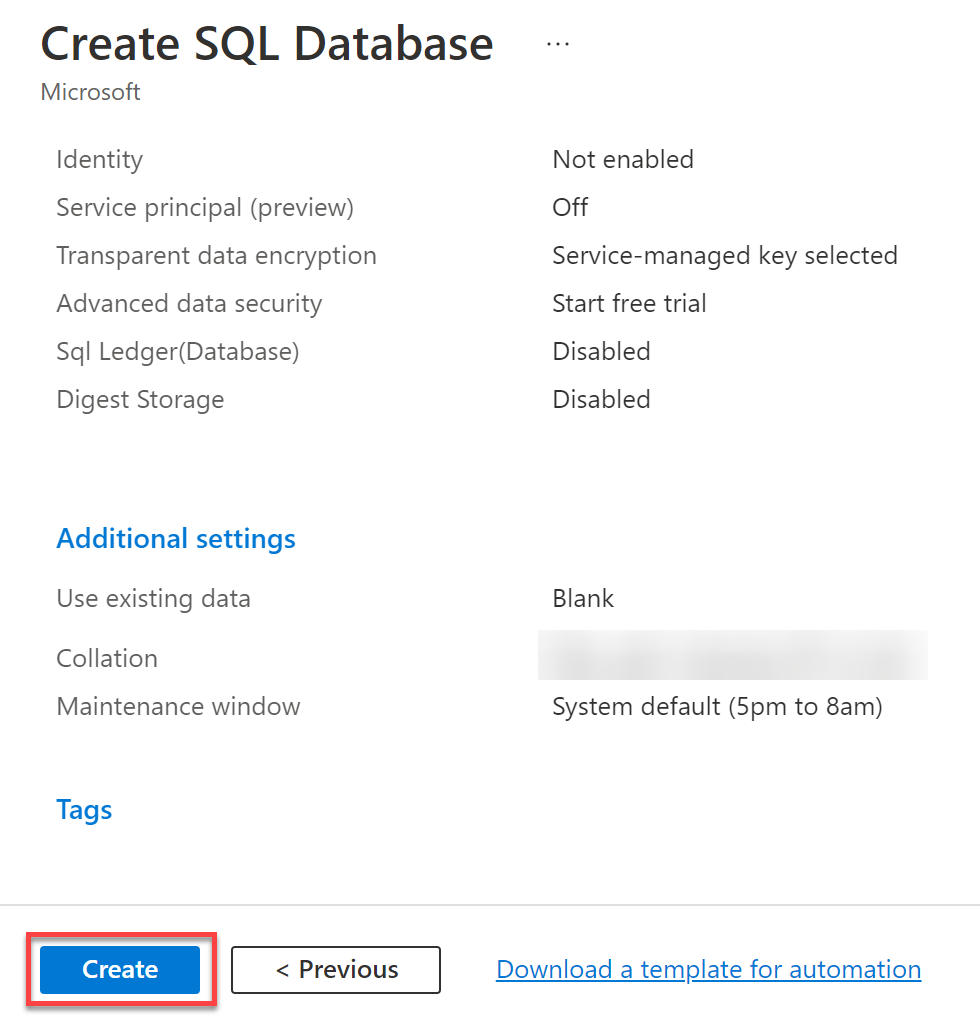
Your browser redirects to a page where you can review the configured settings for the database (step eight).
8. Review the configured settings for your database and click Create to create the SQL database, which takes some time to complete.
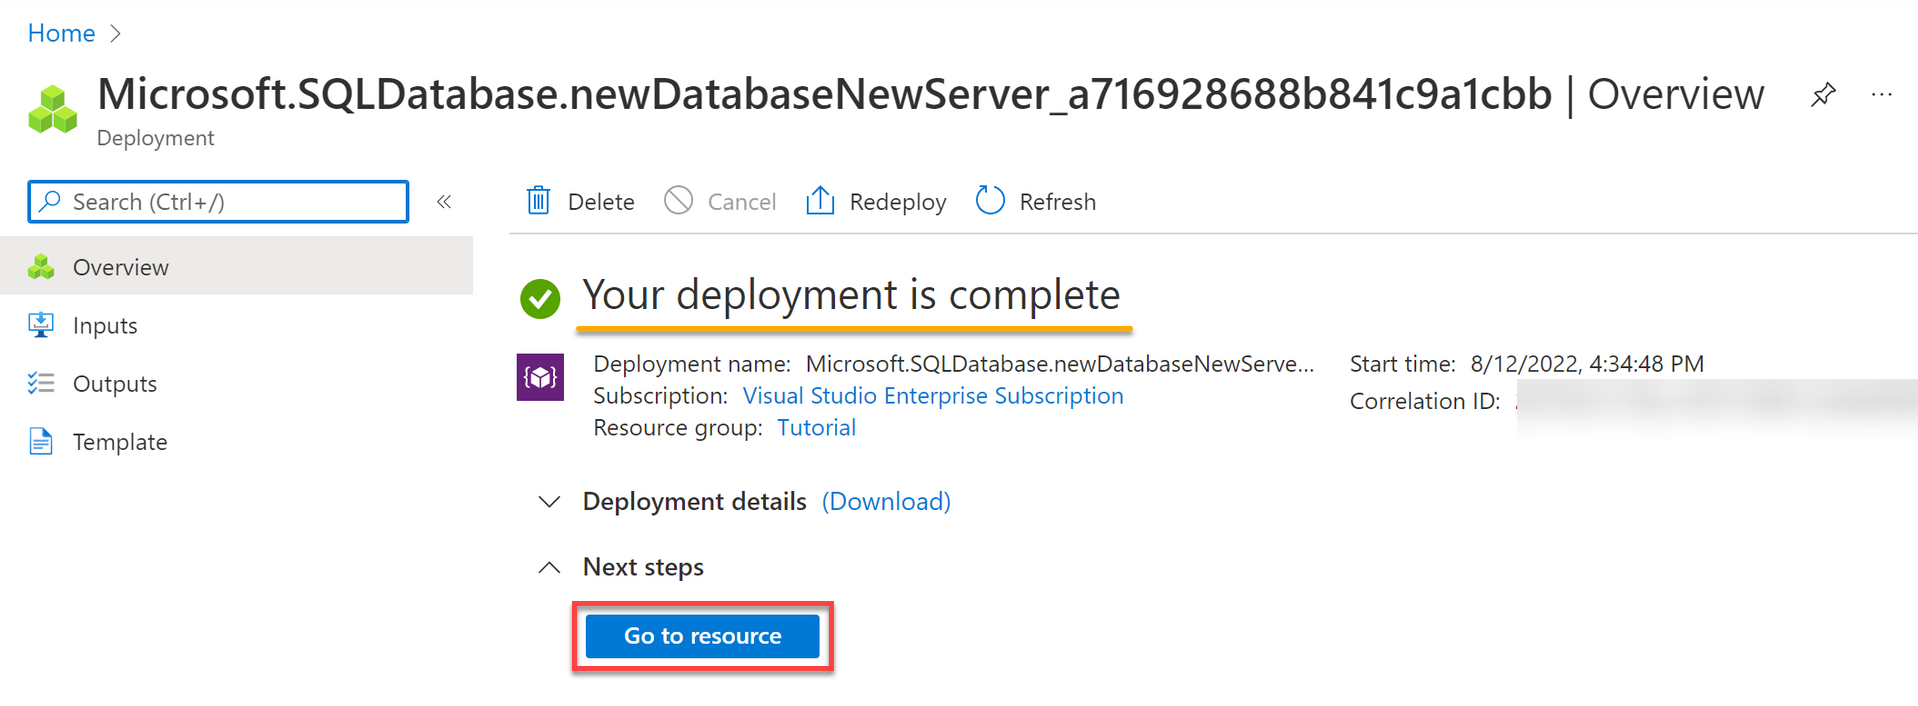
Once created, your browser redirects to a page where you can see the deployment status (step nine).
9. After successful deployment, click Go to resource to access the newly-created resource.
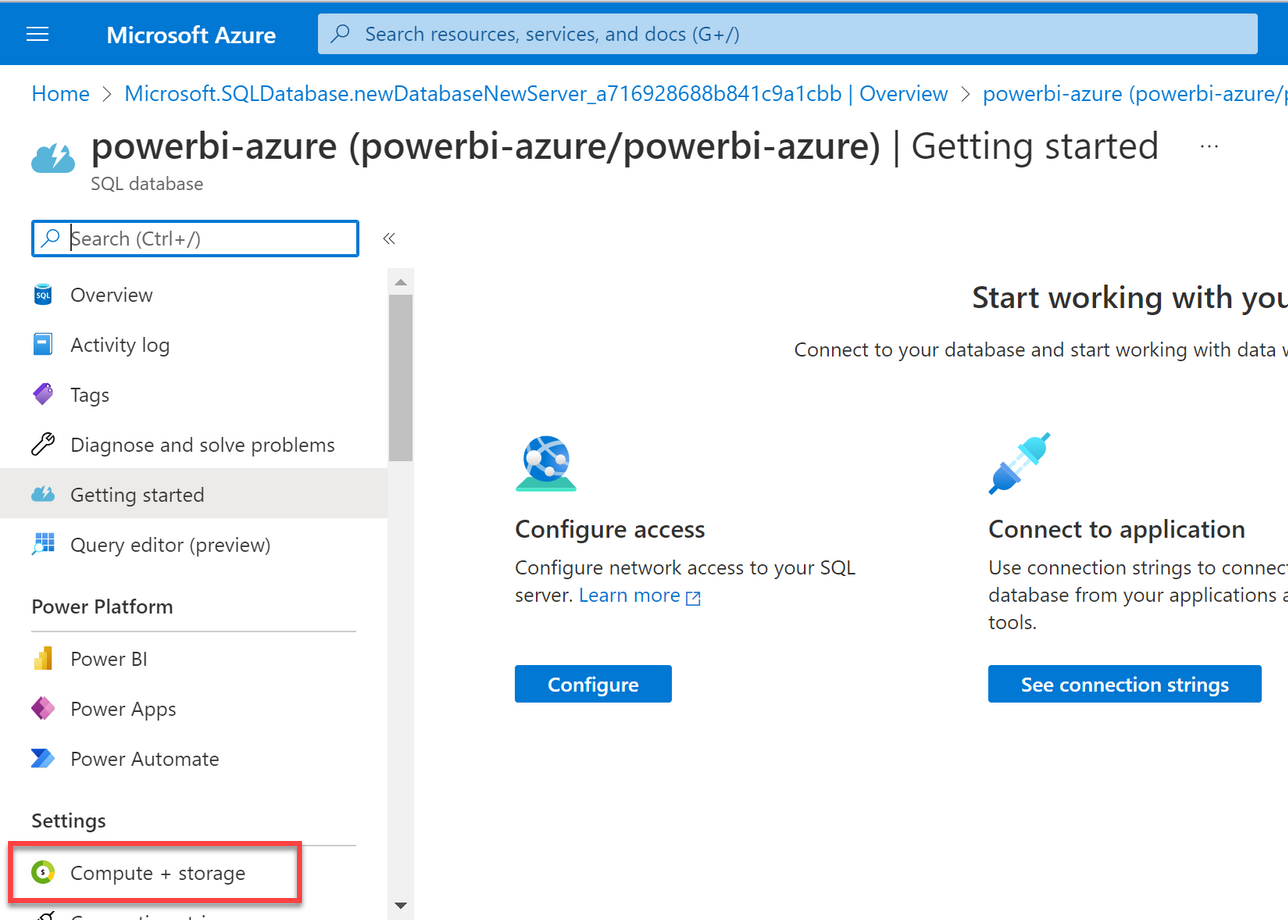
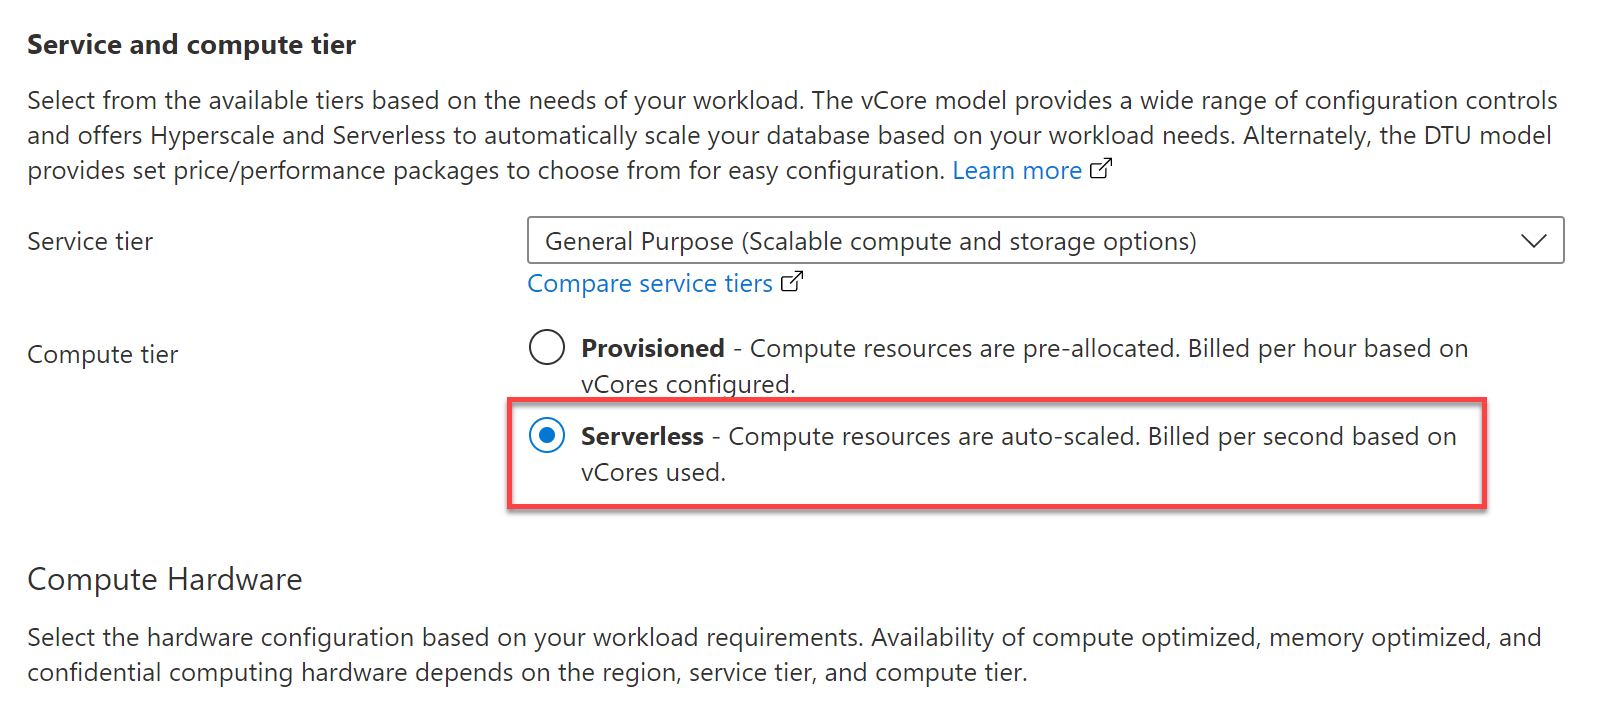
10. Once the resource’s dashboard, click Compute + Storage under the Settings section (left panel) to initiate configuring your SQL server storage settings.
11. Now, select the Serverless option to make your database auto-scale and cost less.
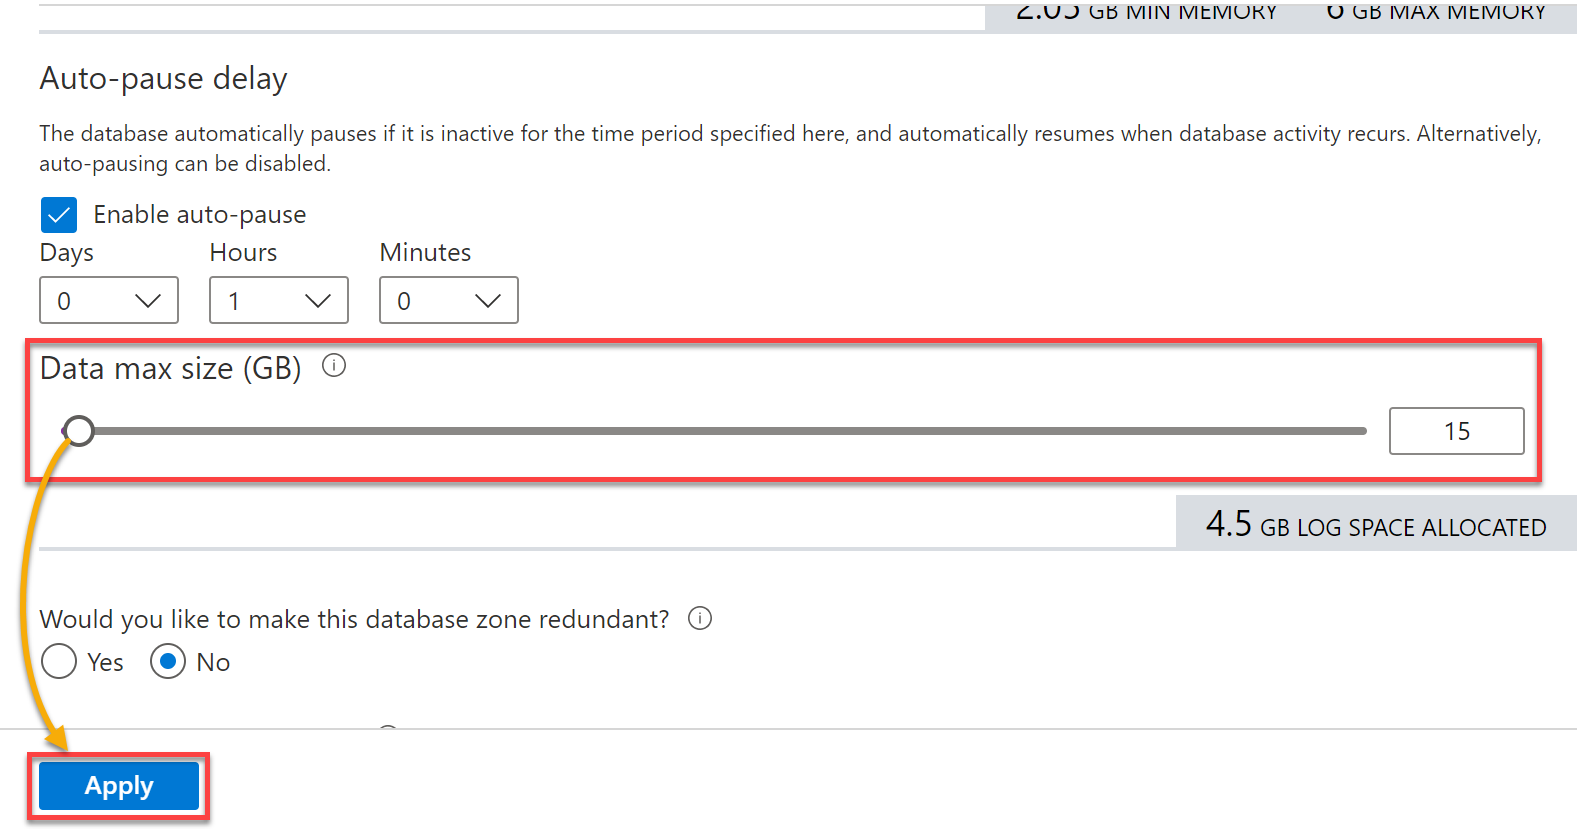
12. Drag the slider to minimize the data size, as shown below, and click Apply to save the settings. This tutorial uses 15GB for demonstration.
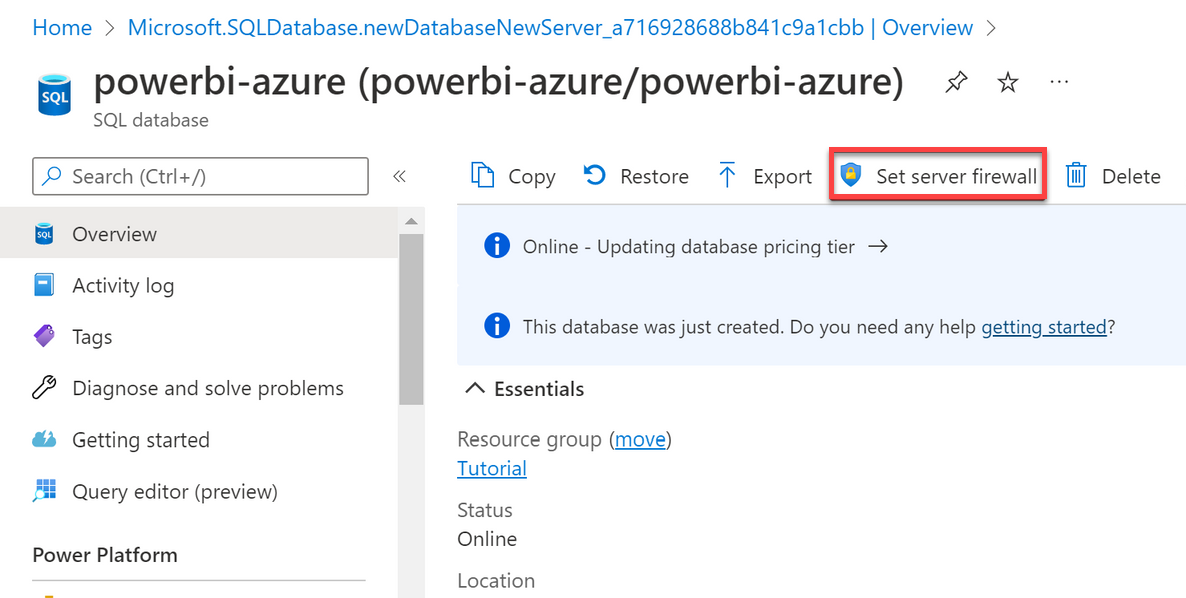
13. Back to the resource’s dashboard, click on Set server firewall to initiate setting up a firewall to access your data from the Power BI desktop and visualize your data.
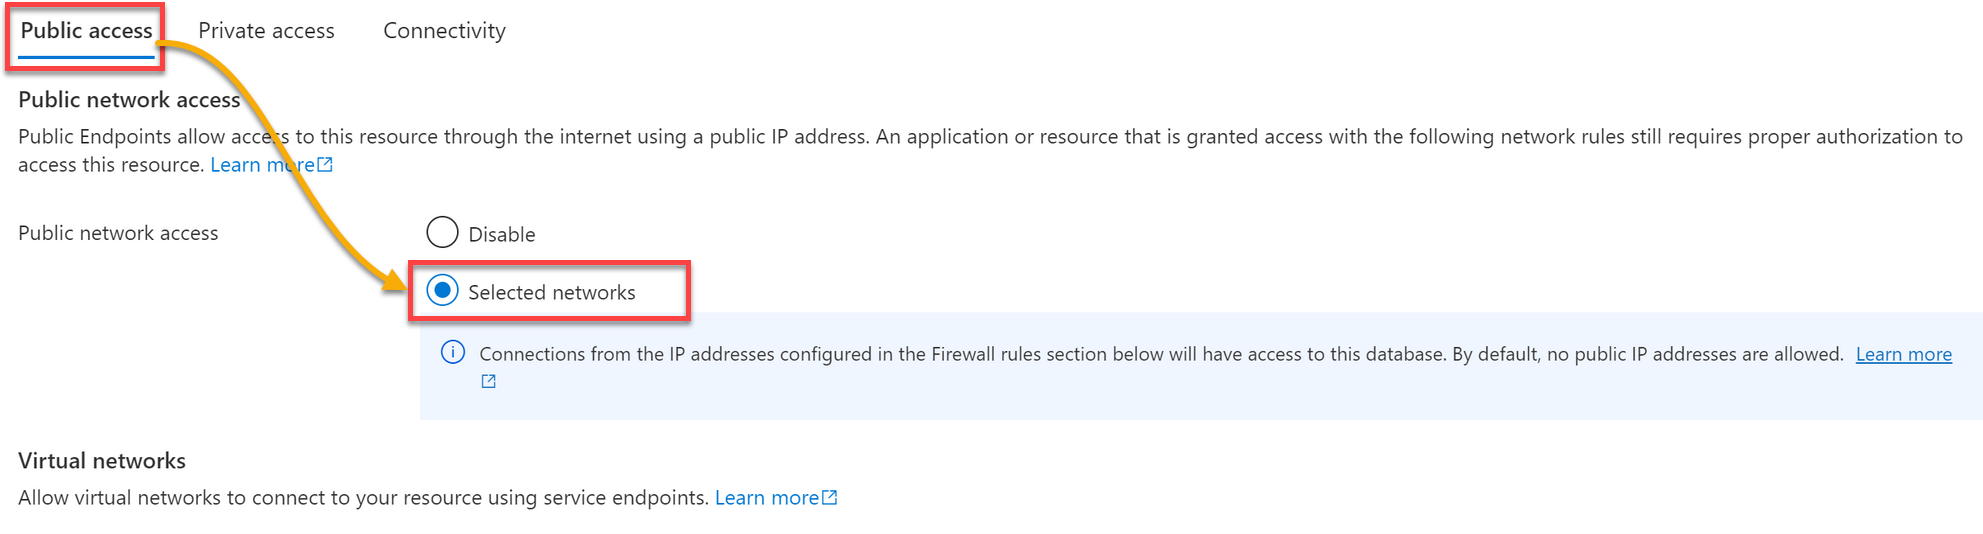
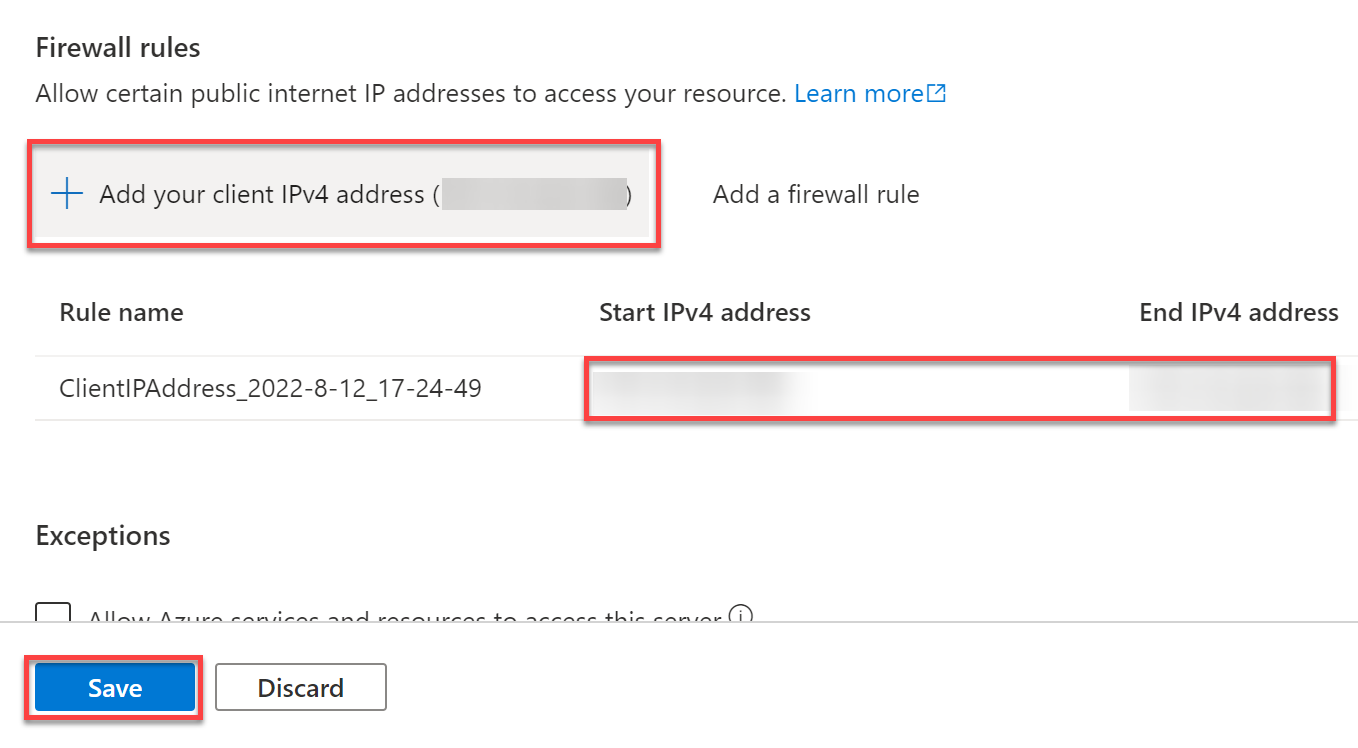
14. Under the Public access tab, click Selected networks to add an IP address.
15. Next, scroll down to the Firewall rules section, click on Add your client IPv4 address or set the start IP address and end IP address to 0.0.0.0.
Once you’ve added your client IP address, click Save to save the configuration.
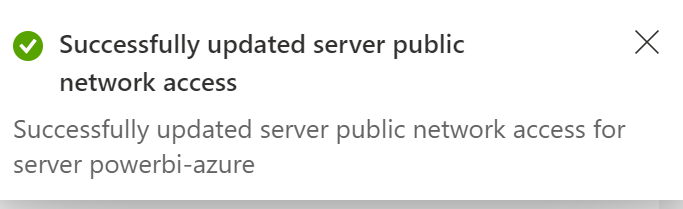
Once done, you will see the confirmation message shown below.
Creating Data in Azure SQL Database to Visualize
You now have an Azure SQL database and a server, and you’re ready to dig into creating data or querying the database to visualize on Power BI. The Azure SQL server offers a query editor that lets you write queries, create tables, and add data to created tables.
To start creating data in Azure SQL database:
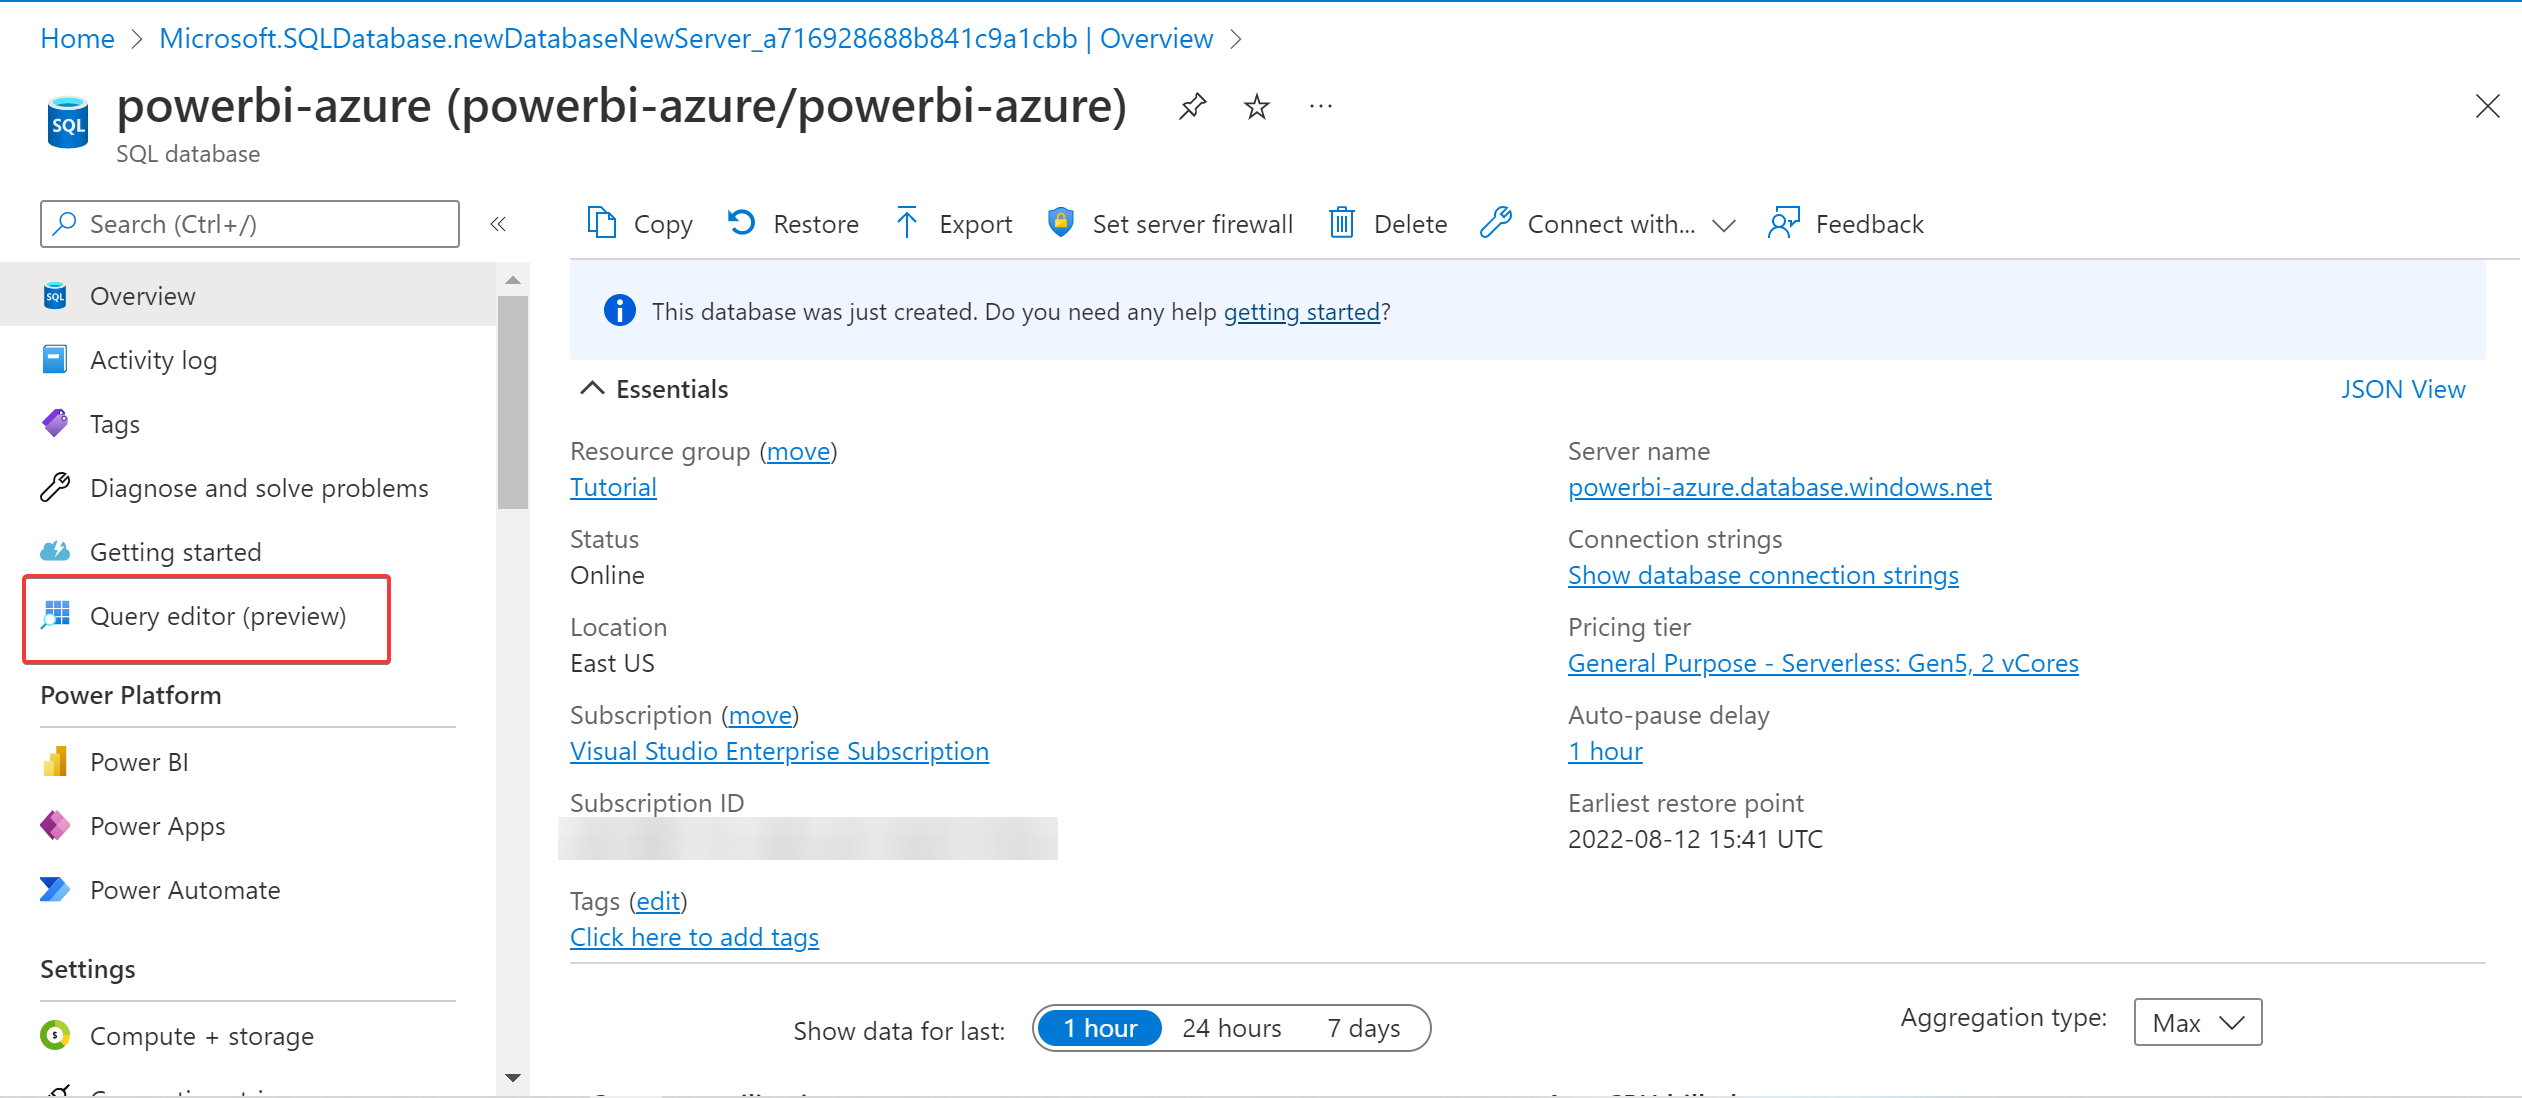
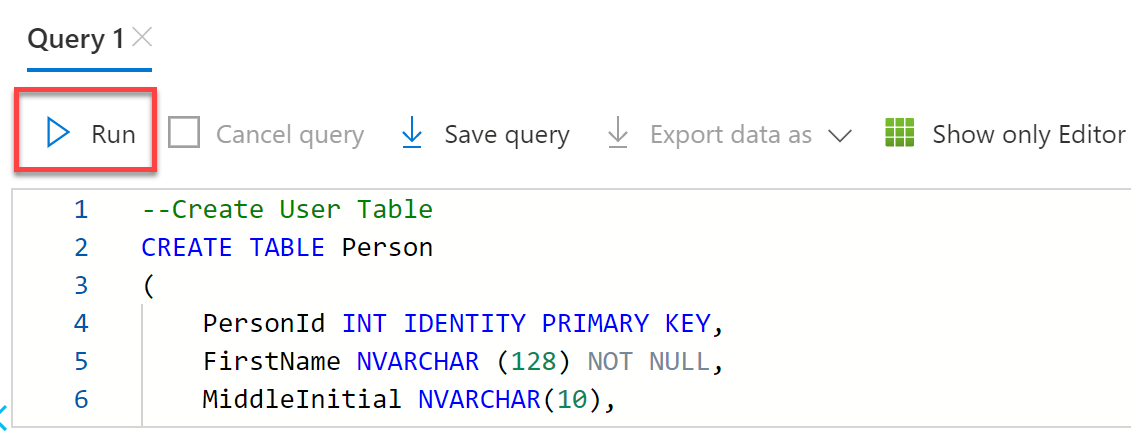
1. On your resource’s dashboard, click Query editor to add a query.
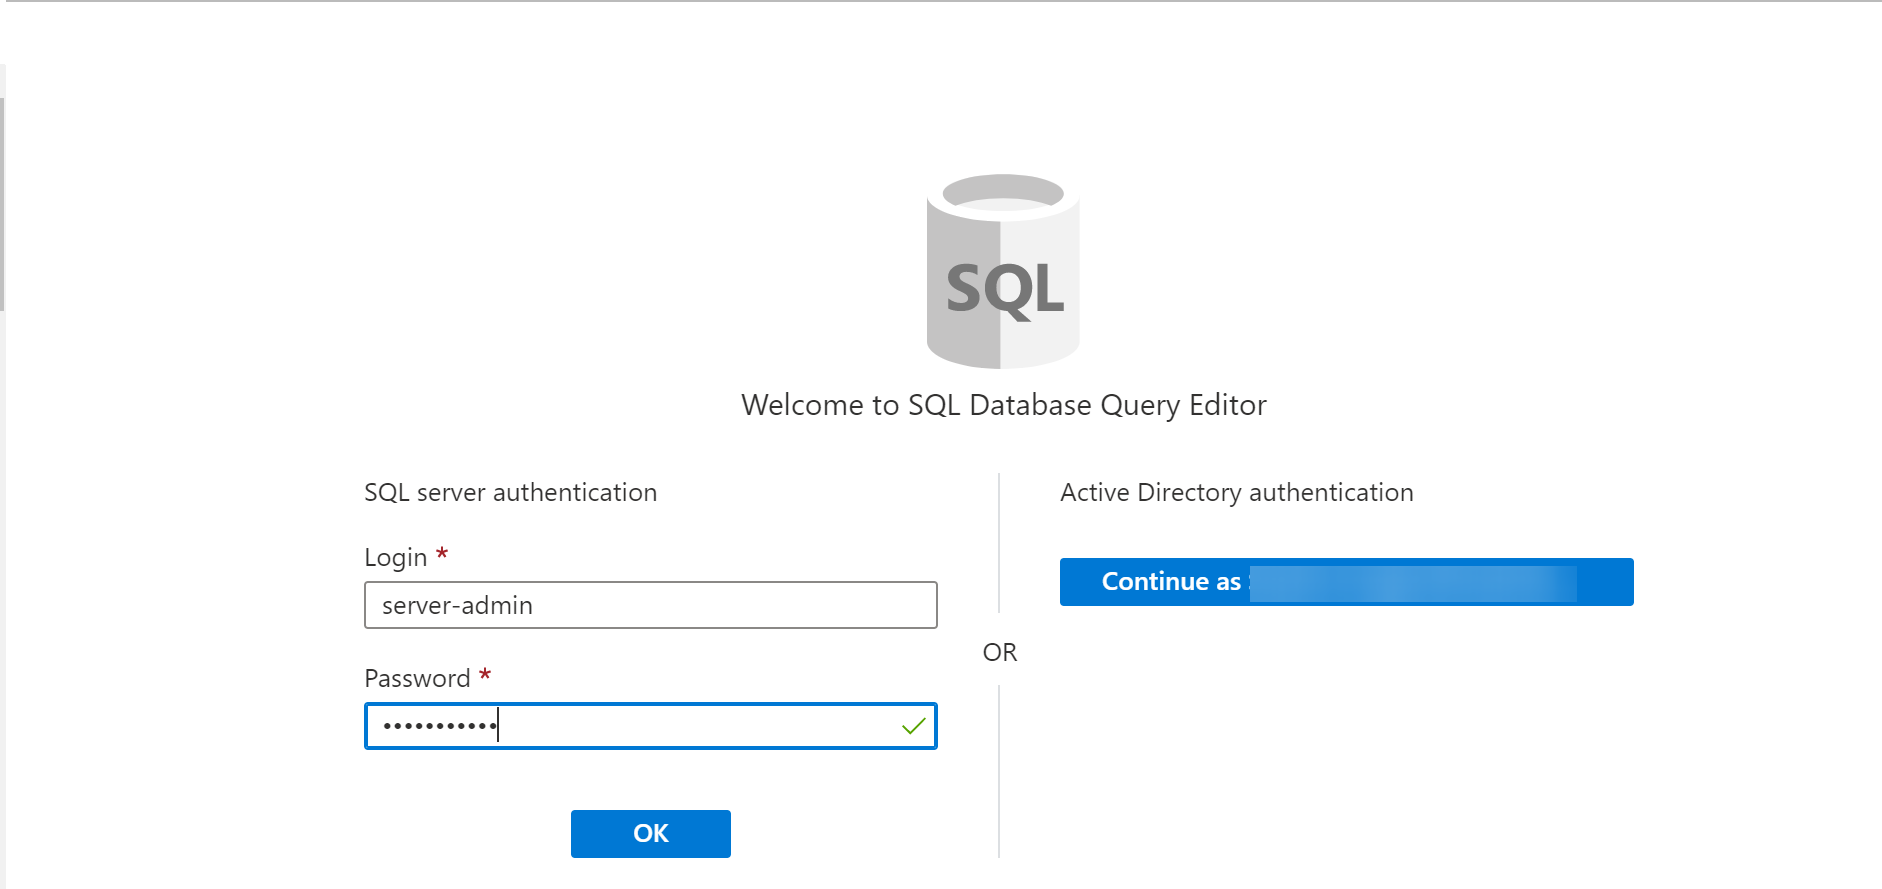
2. When prompted, provide the SQL admin details you set in step six of the “Connecting Azure SQL Database to Power BI” section, and click OK to sign in.
Once signed in, you will see a query editor like the one below.
3. Copy and paste the following query to the SQL query editor, which creates four tables named Person, Student, Course, and Credit.
-- Create a User Table

CREATE TABLE Person
(
	PersonId INT IDENTITY PRIMARY KEY,
	FirstName NVARCHAR (128) NOT NULL,
	MiddleInitial NVARCHAR(10),
	LastName NVARCHAR(128) NOT NULL,
	DateOfBirth Date NOT NULL,
)

-- Create Student Table

CREATE TABLE Student
(
	StudentId INT IDENTITY PRIMARY KEY,
	PersonId INT REFERENCES Person (PersonId),
	Email NVARCHAR(256),
)

-- Create a Course Table

CREATE TABLE Course
(
	CourseId INT IDENTITY PRIMARY KEY,
	Name NVARCHAR(50) NOT NULL,
	Teacher NVARCHAR (256) NOT NULL,
)

-- Create Credit Table

CREATE TABLE Credit
(
	StudentId INT REFERENCES Student (StudentId),
	CourseId INT REFERENCES Course (CourseId),
	Grade DECIMAL(5,2) CHECK (Grade <= 100),
	Attempt TINYINT,
	CONSTRAINT [UQ_studentgrades] UNIQUE CLUSTERED
		(
		StudentId, CourseId, Grade, Attempt
		)
)
4. Now, click on Run to execute the query.
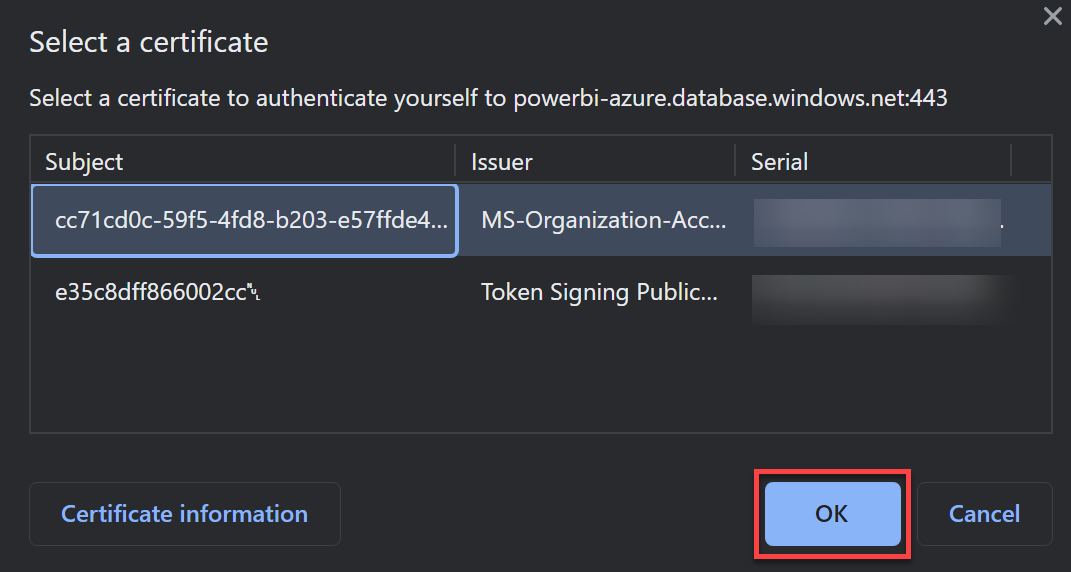
5. Click OK to close and continue querying when prompted with the certificate associated with your Azure account, as shown below.
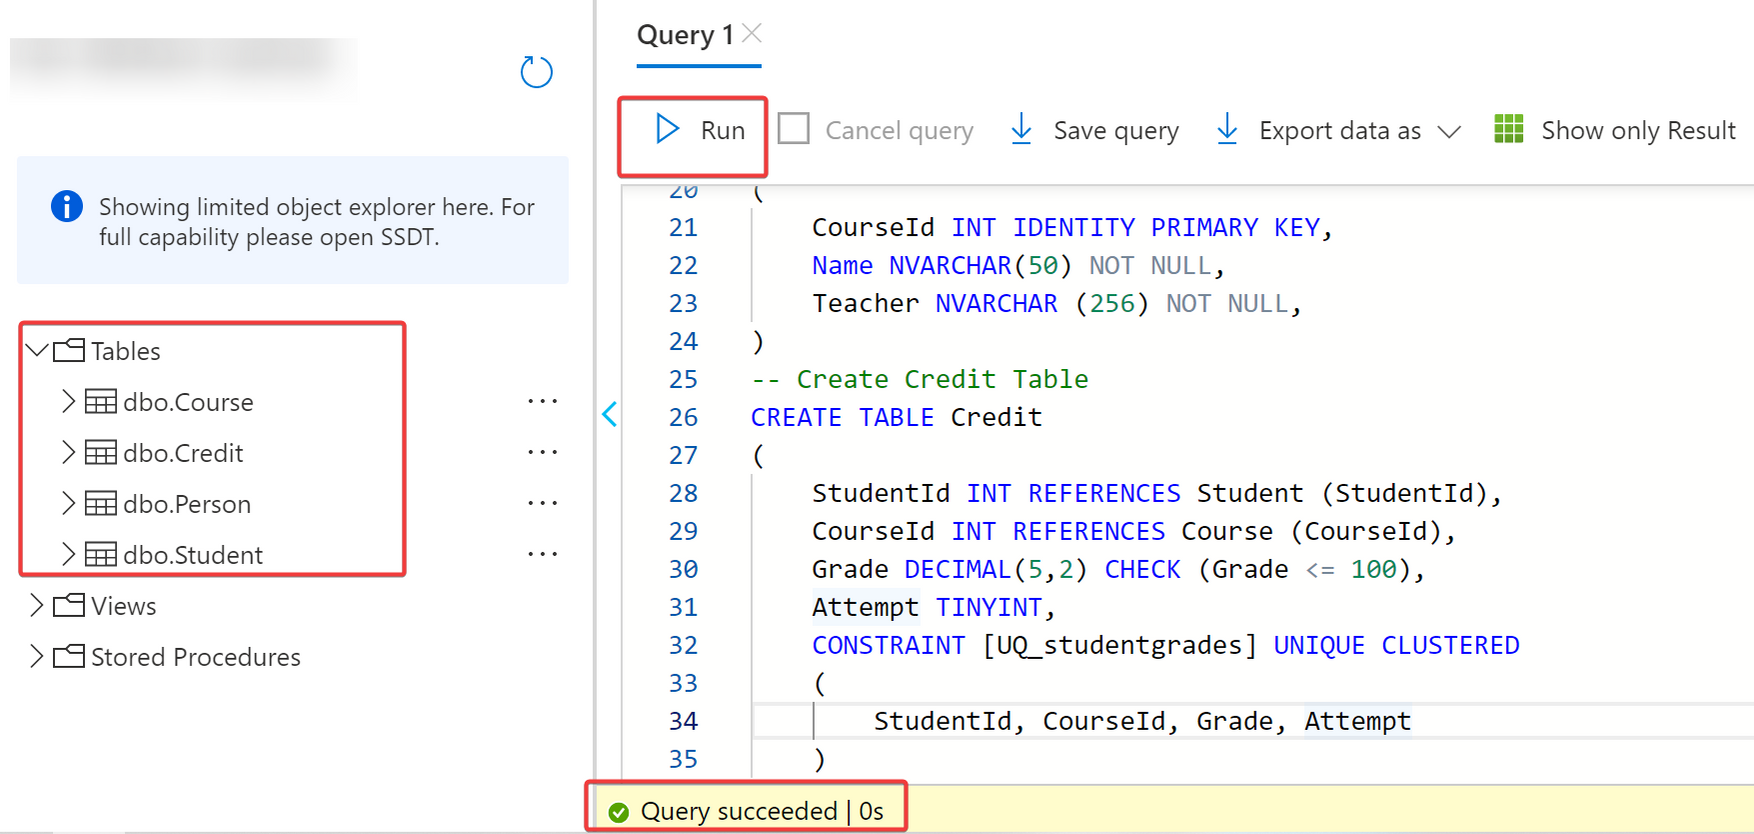
6. Next, click Run again to execute the query in the editor. Once successful, you will see the Query succeeded message at the bottom of the query editor section.
You can see the tables created after running the query on the left panel.
7. Select the dbo.Course table, and run the following query, which returns 100 records.
SELECT TOP (100) * FROM [dbo].[Course];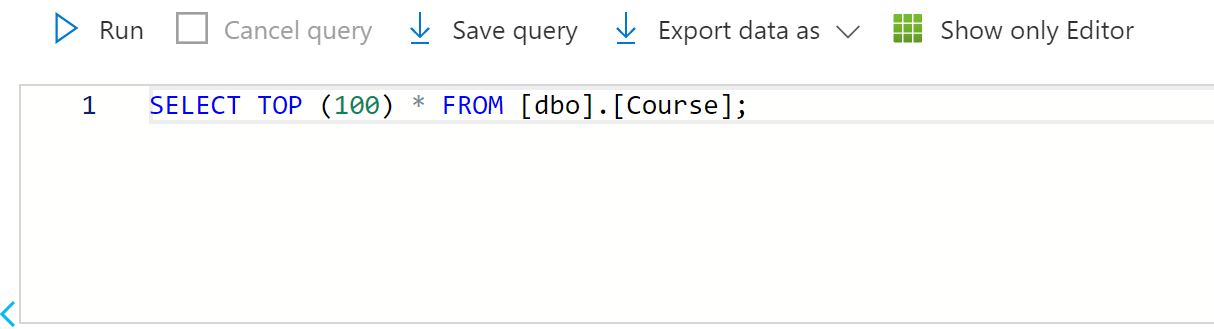
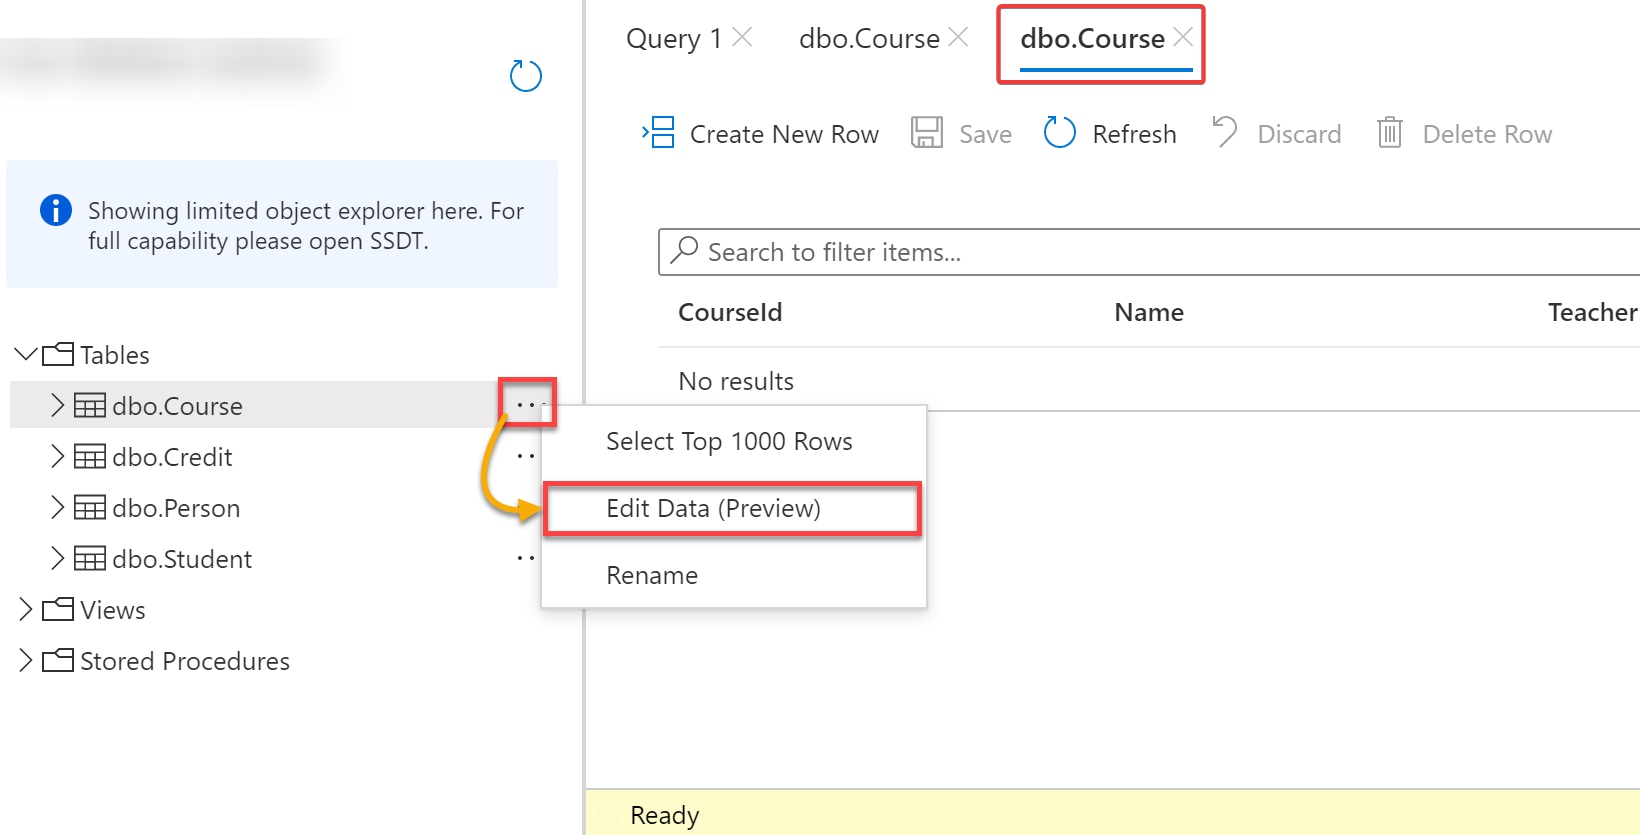
8. Now, select the dbo.Course under Tables (left panel), click the ellipsis (three dots) → Edit Data (Preview) to access the table’s data.
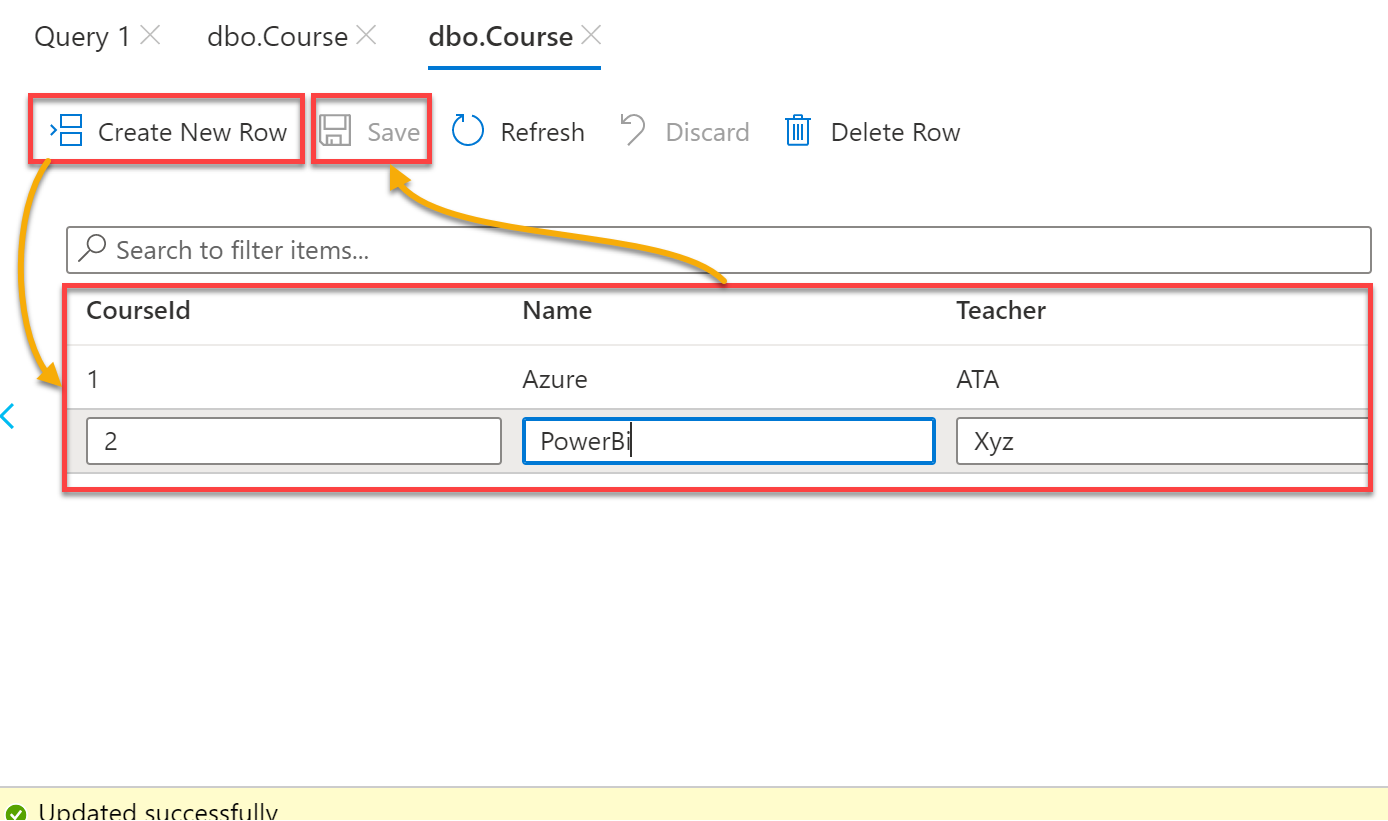
9. Finally, click Create New Row to add data to the table, and click on the Save button to save the new data.
Visualizing Data from Azure SQL Database to Power BI
What better ways to achieve data analysis? Visualizing data from Azure SQL database to Power BI will surely pique your interest.
To visualize your data on Power BI:
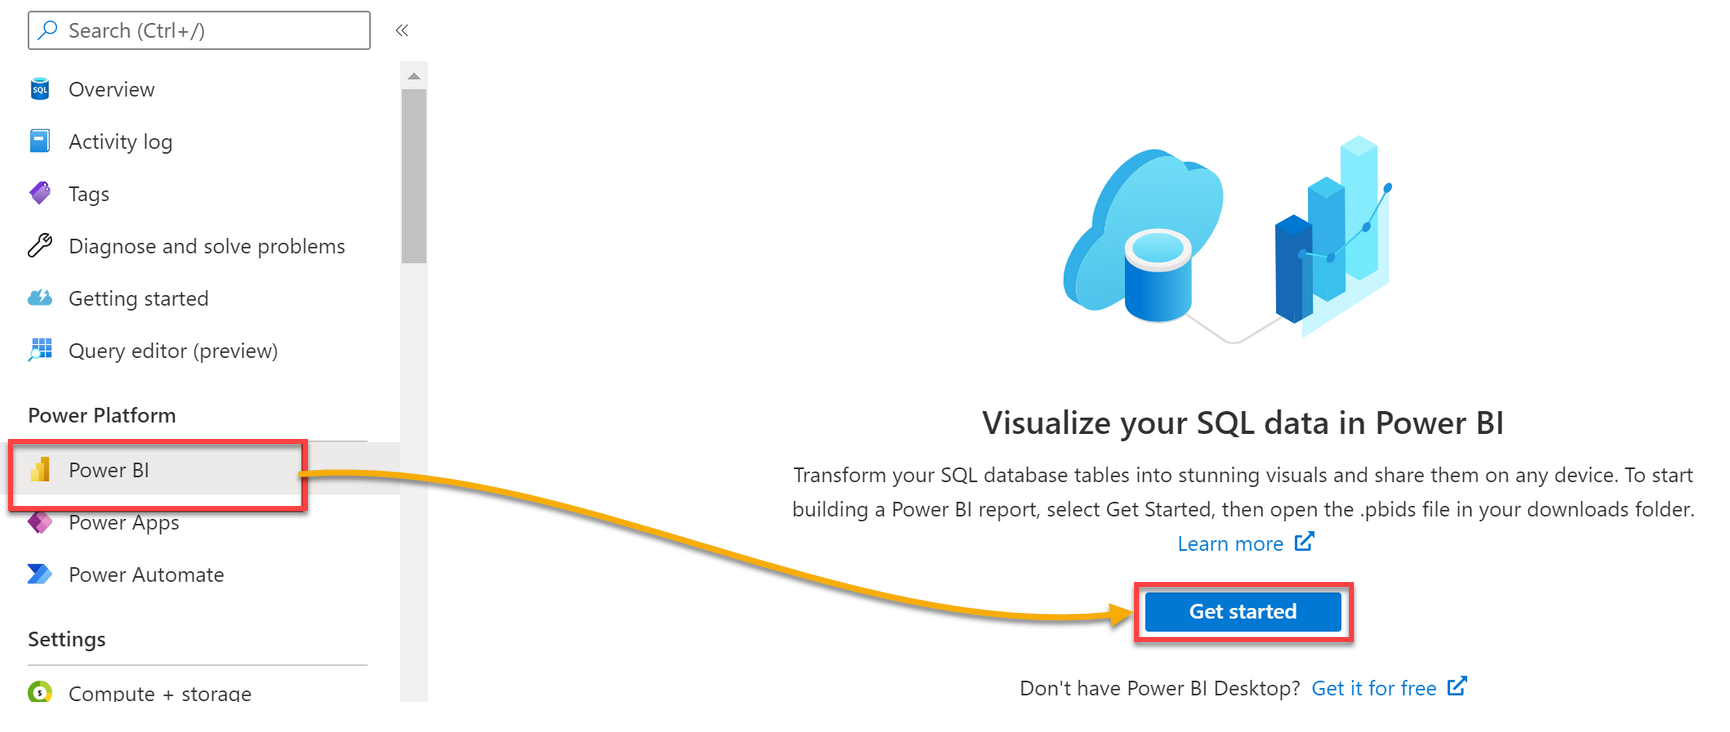
1. Click Power BI on your Azure Portal’s overview page → Get started, and a .pbids file will be downloaded.
Double-click on the downloaded .pbids file to open it on your Power BI desktop.
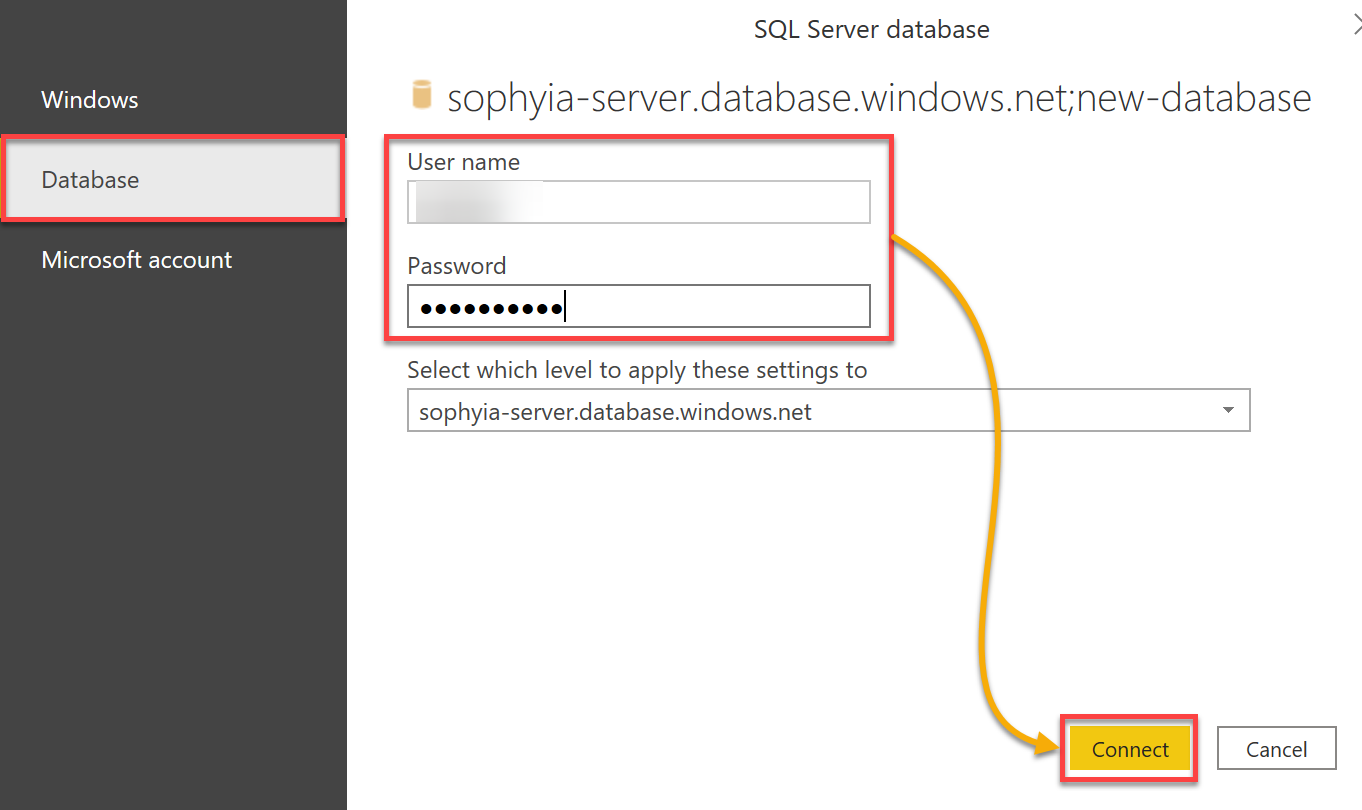
2. Next, select Database (left panel), provide your SQL admin and password and click Connect to connect to your SQL Azure database.
Once connected, a new page pops up to see the data on your Azure SQL database (step three).
3. Tick the box of the Course table, and click Load to load the table’s data on Power BI.
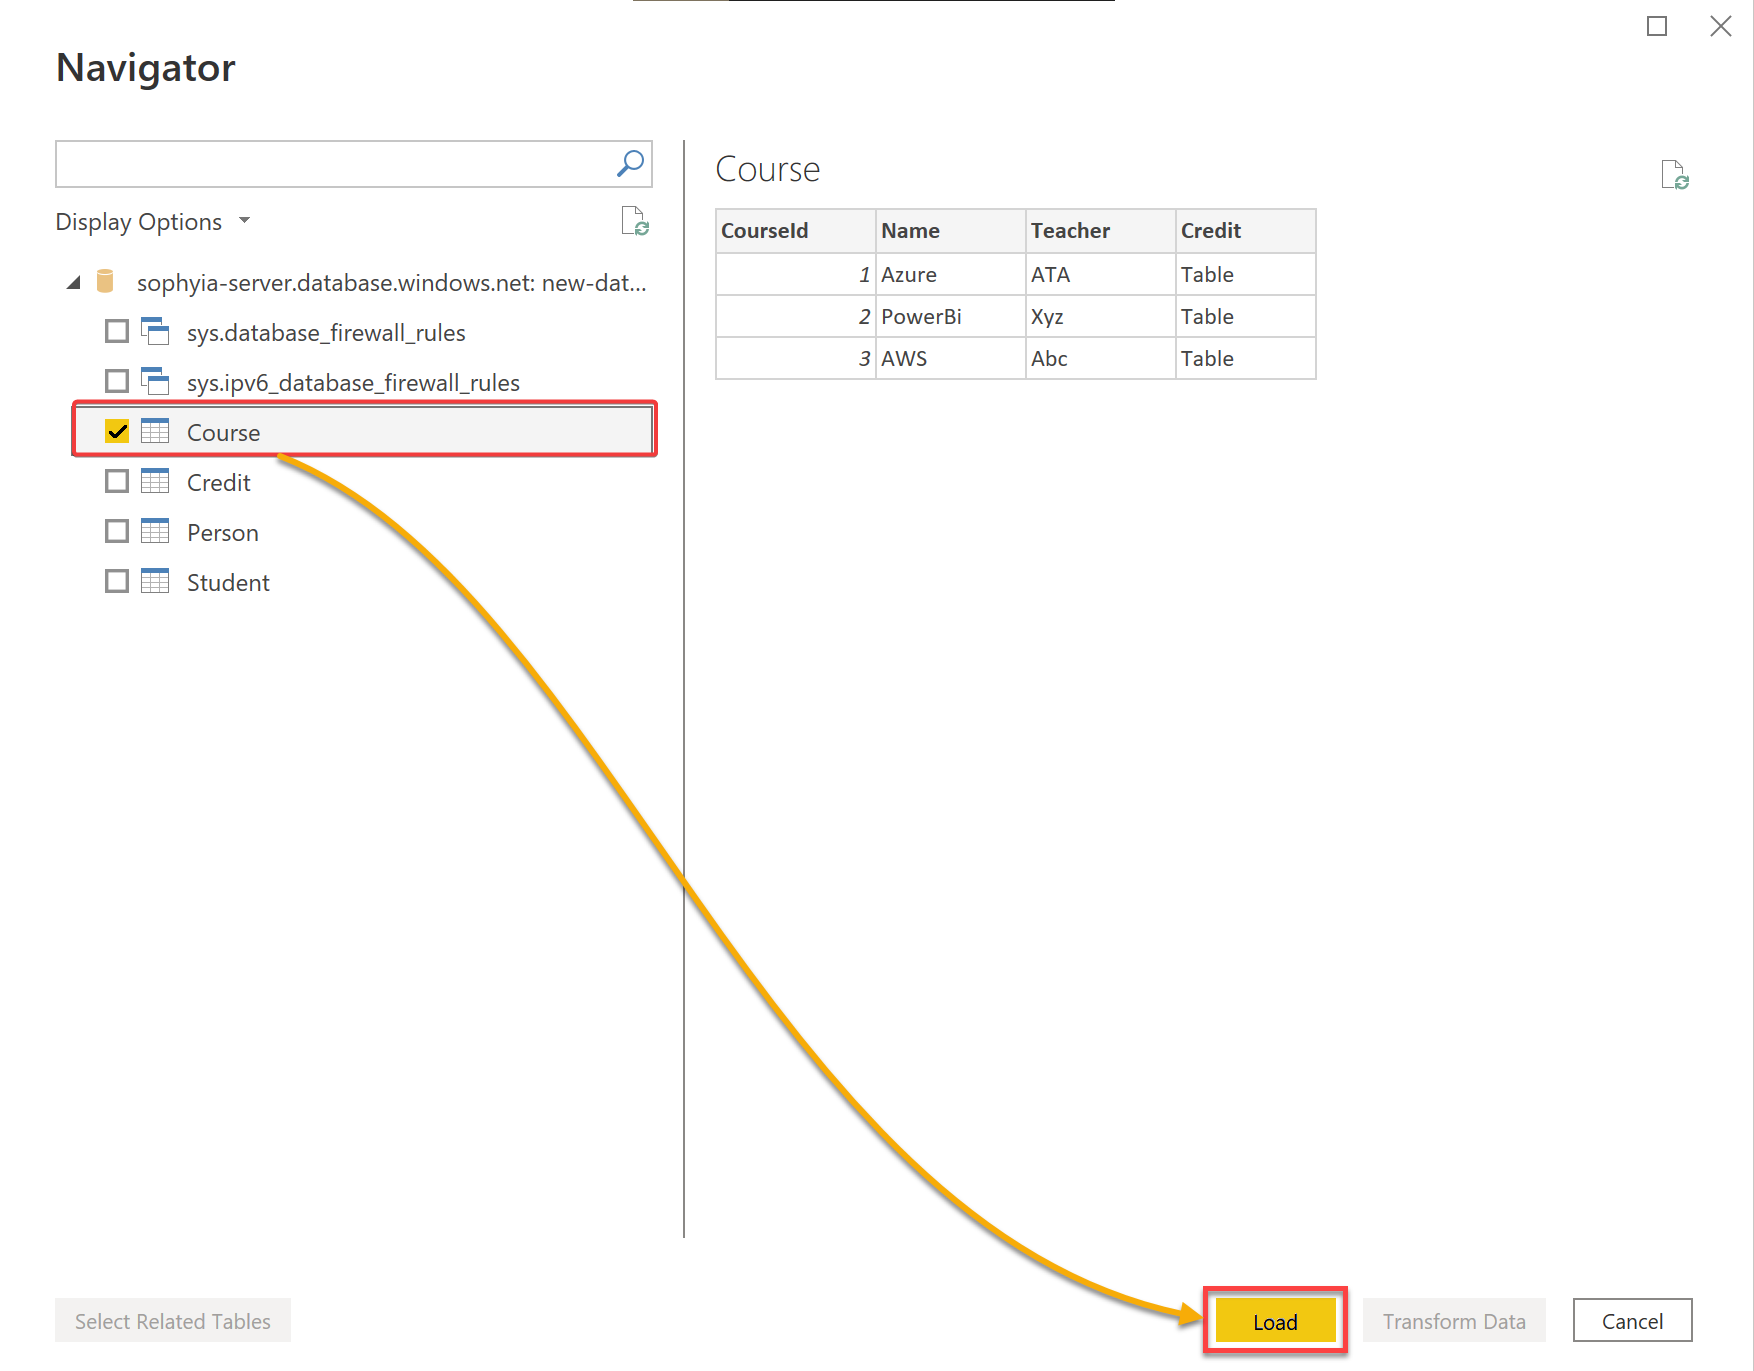
You can find your loaded data under the Fields section on the right side of your Power Bi desktop.
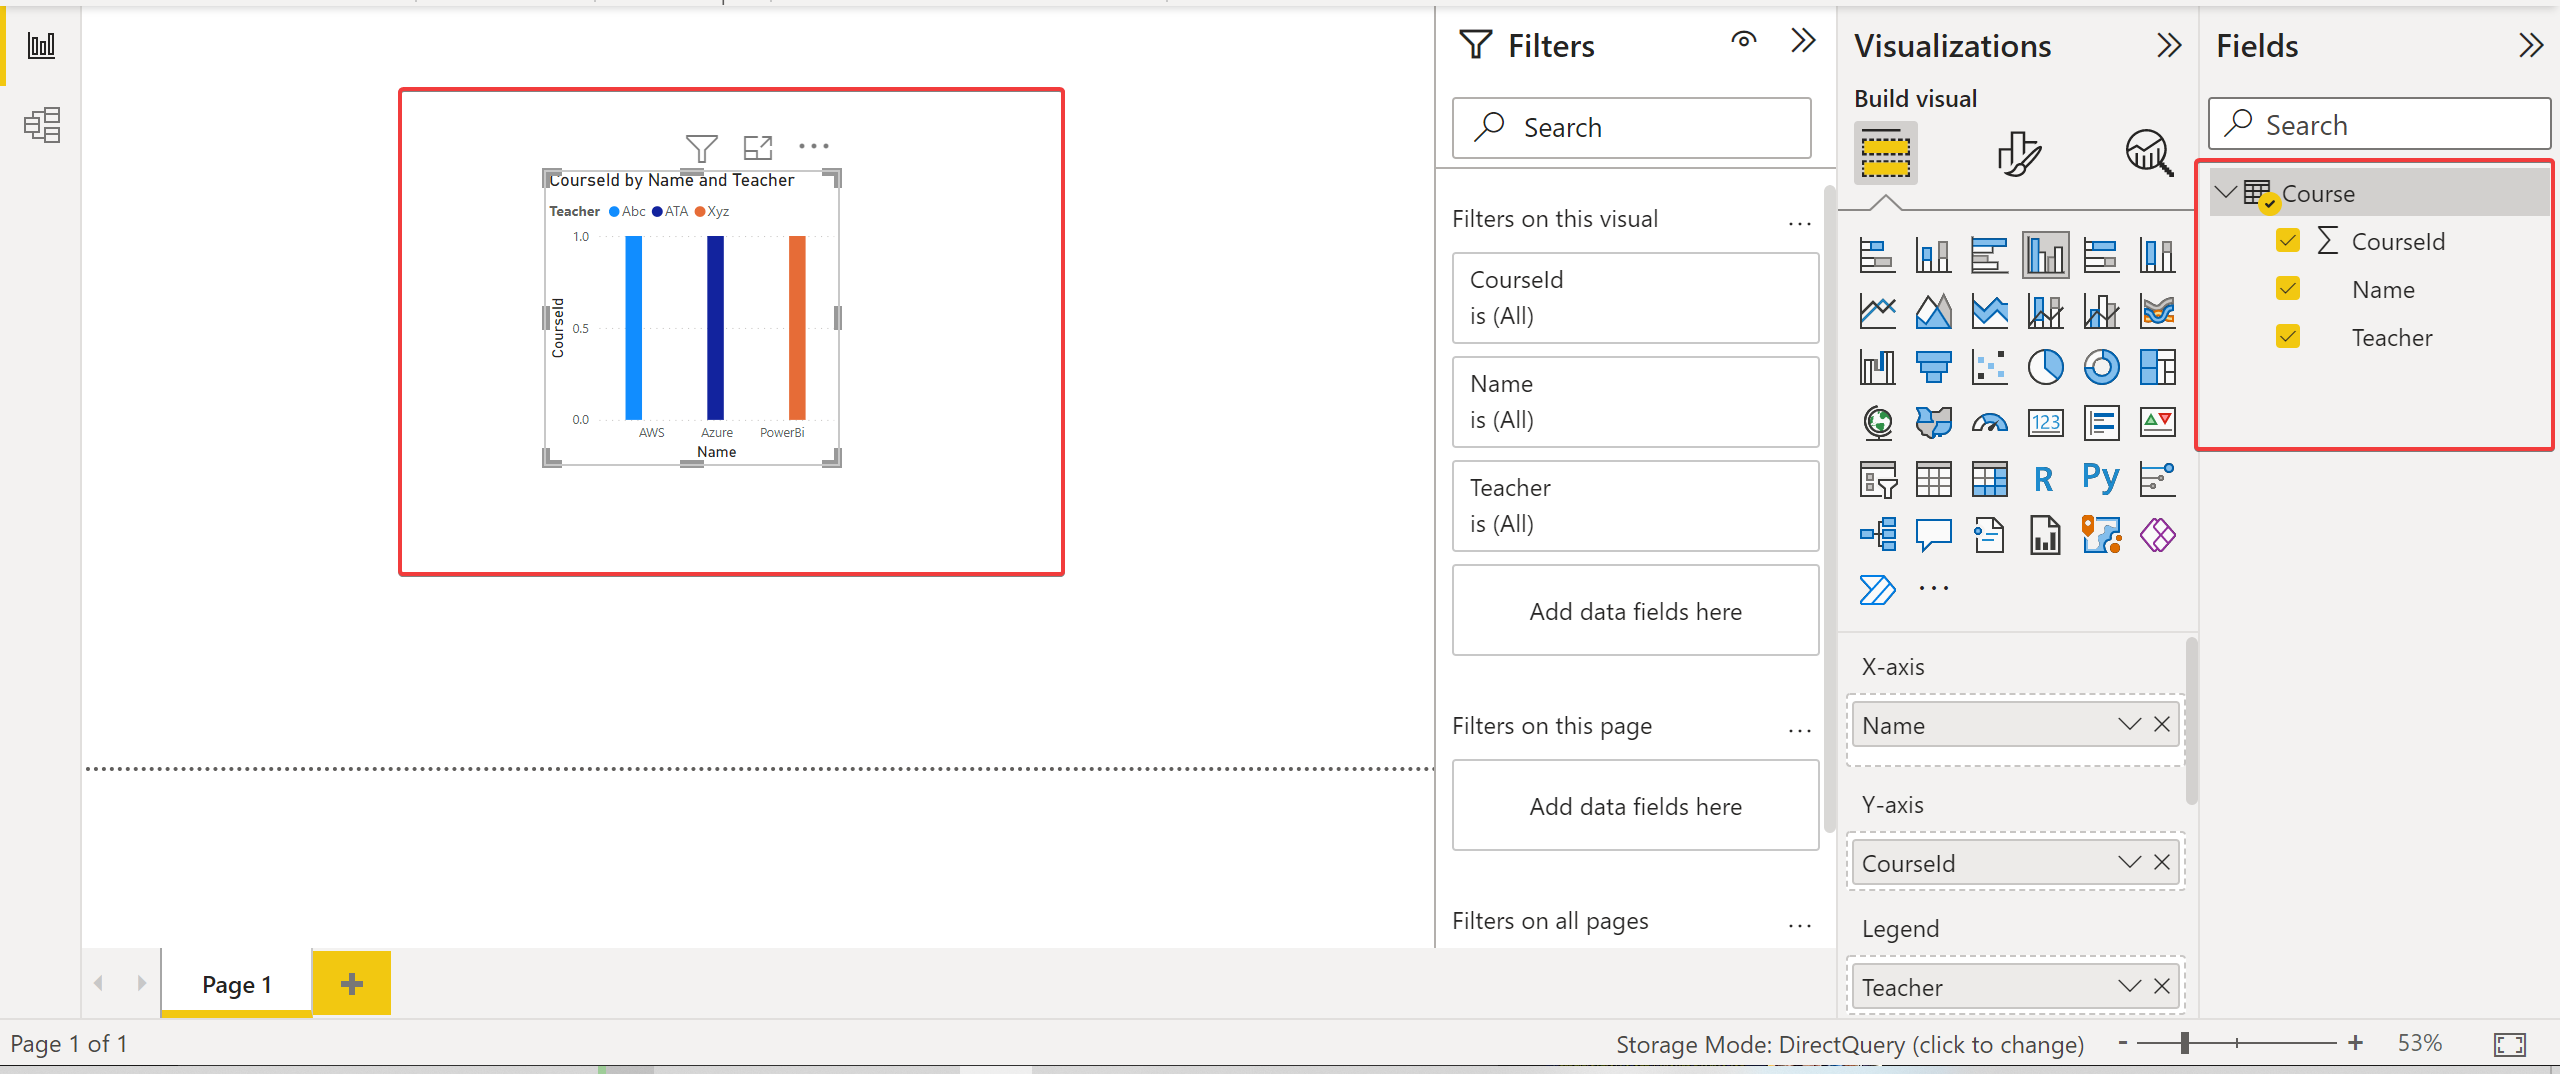
4. Finally, select all columns on the Course table under the Fields section, and a visual pop-up showing the selected table’s data, as shown below.
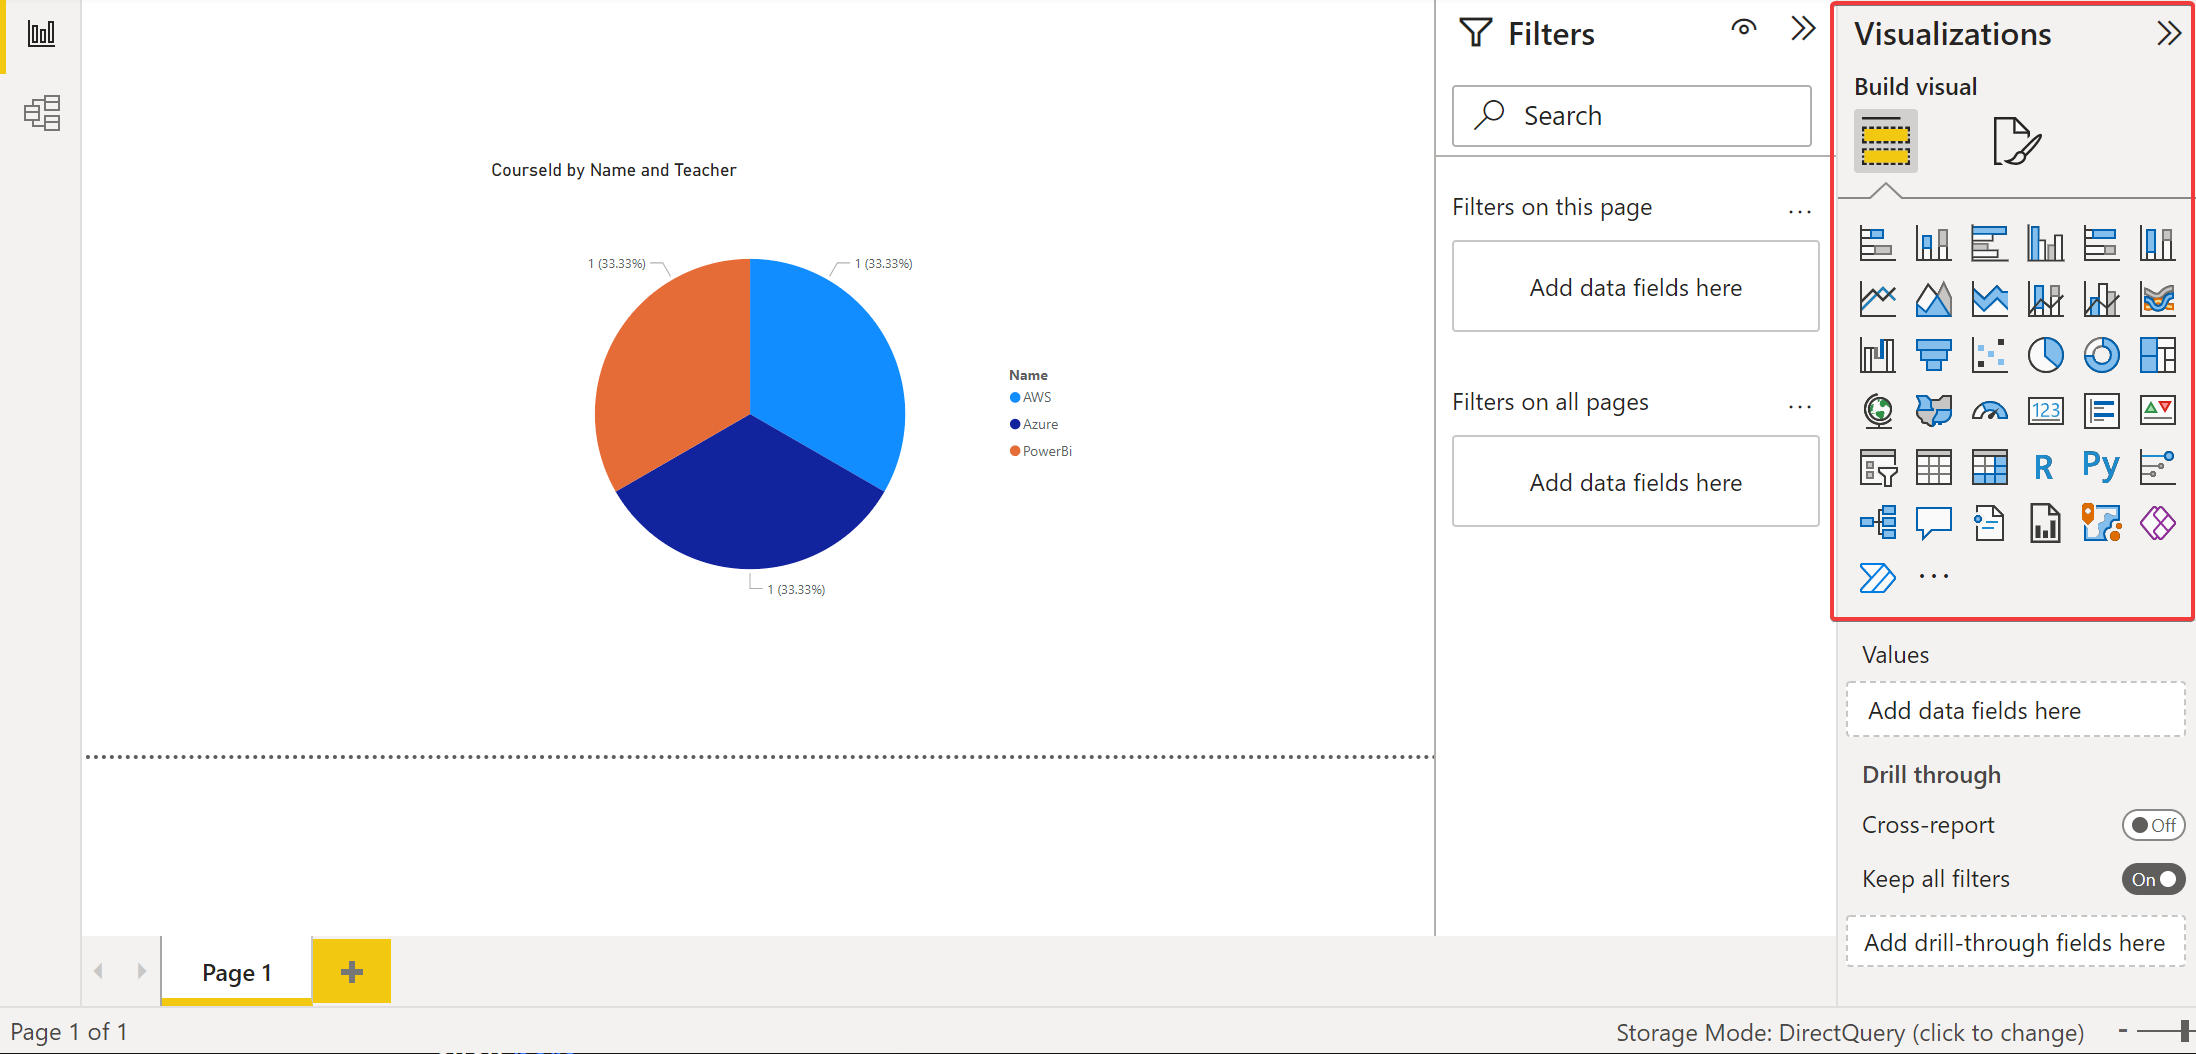
Perhaps you like to change how to visualize your data. If so, select a visual type (like a Pie chart) under the Visualizations panel, as shown below.
Conclusion
Power BI has more than twenty data sources. But with this tutorial, connecting your Azure data has never been easier. At this point, you can now quickly send your data from SQL Server using the on-premises data gateway to Power BI.
At this point, you never have to worry about visualizing data from Azure or SQL servers. Besides using Power BI Data Gateway for businesses, will you consider this tool beautifully visualizing data for your IT monitoring tools?


