


Troubleshooting connections are challenging for any IT support organization. With many variations in end-user connections, easy-to-use troubleshooting tools save time and end frustration. With PingPlotter Cloud, you can take the guesswork out of monitoring network connections.
In this article, I explore how this well-needed tool works and if it lives up to the hype. Packet loss, latency, and limited bandwidth combine to create a poor experience for both the end-user and the network technician. Learn how well PingPlotter Cloud can quickly troubleshoot and help the user get back up and running fast!
PingPlotter Cloud has sponsored this post. If you’d like to learn more about PingPlotter Cloud, check them out!
Getting Started with PingPlotter Cloud
Once signed up, simply navigate to the PingPlotter Cloud dashboard and sign in. If it’s your first sign-in, and you already have a license, you will be sent a temporary password. Once authenticated you will be presented with the dashboard.
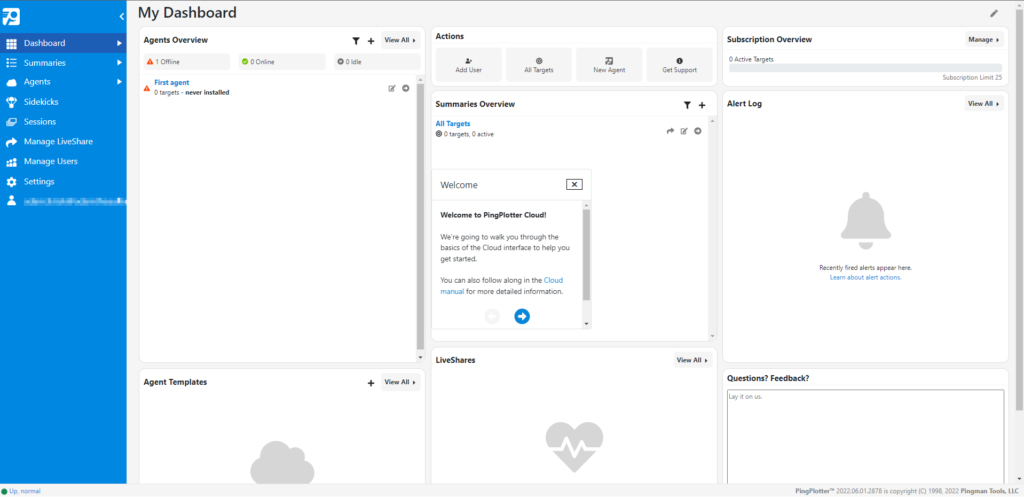
On this dashboard, you are presented with most of the necessary functionality right off the bat. As shown below, there is a “First agent” already provisioned, but not connected to a system. In PingPlotter Cloud, an agent is installed to a specific system with the targets set to an endpoint, such as Google, to collect network statistics.
In addition, you will find tabs for actions, subscription usage, alerts, and feedback. But, you can also see all of your Agent Templates and LiveShares. Agent Templates are reusable configurations for repeated or mass deployments. LiveShares allow other users to view the results of an agent and targets via a web link.
The only functionality that I would like to see here is the ability to add more widgets, such as Sidekicks, Sessions, or even a graph of a specific target. You are able to click the edit icon and rearrange and resize widgets, but not add new widgets.
Installing and Connecting the First Agent
Despite having an agent already provisioned, I am not collecting any actual data from a system yet. The agent must be installed with targets defined before any network statistics can be gained. To install an agent, there are a few ways, but simply clicking on the left-hand menu item for Agents is a quick way to see all of the existing agents and install new agents.
Below, I have selected the default “First agent” that was pre-created but needs to be deployed. Creating a new agent is no more difficult than simply providing a name and deploying with the same options as shown below.
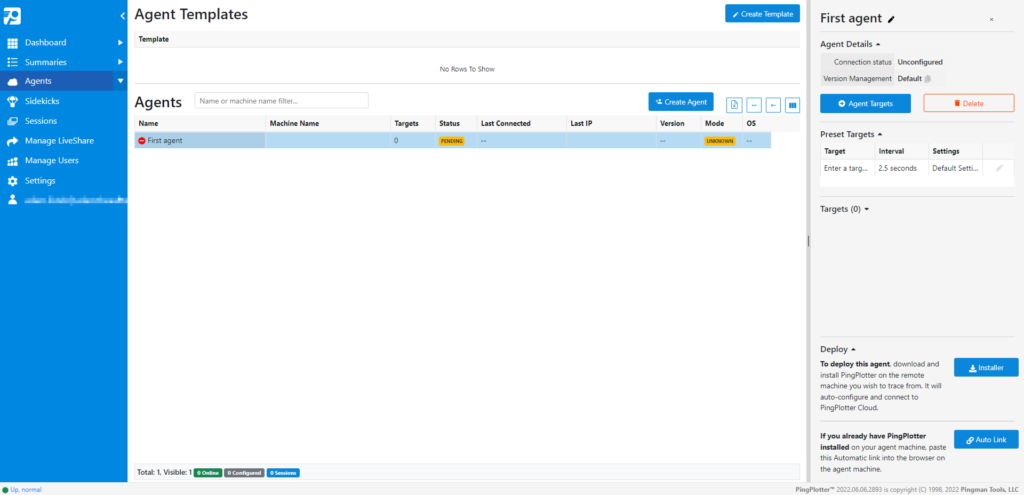
Once the agent is selected, there are several deployment options, but typically you would use the Installer link. This brings you to the agent installation web page. Here, I selected the agent for Windows and ran it through a standard application install. Often, this installation would be done via a remote session initiated by the technician.
Another alternative, and one used by larger organizations, is to pre-deploy the agent via any number of available software installation methods and use the “Auto Link” URL option to connect a target. In this form, with a pre-installed PingPlotter Agent, you pass the generated URL to the end-user who pastes this into a browser which then connects PingPlotter Cloud and the agent together.
I particularly like this method, as it allows a very fast way for an end-user to connect a system to PingPlotter with immediate results sent to the technician.
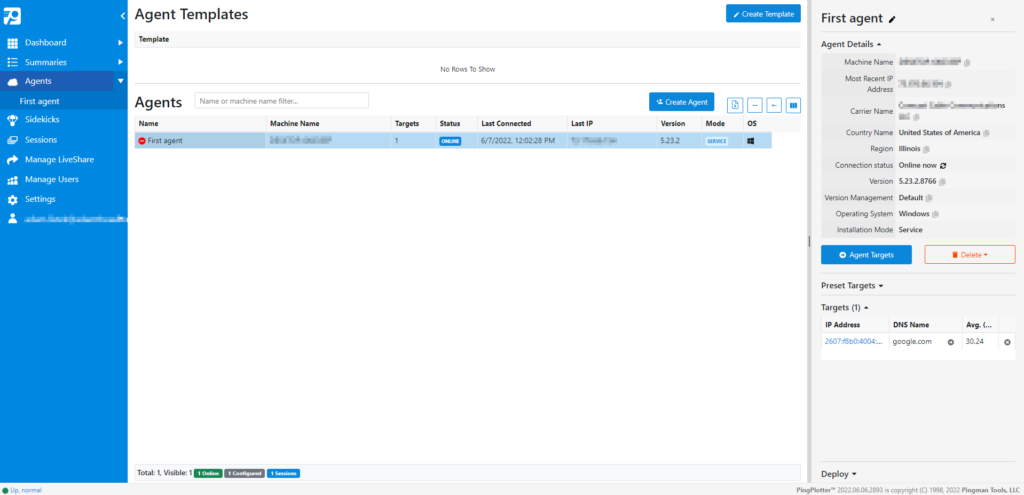
Once connected, you will see information on the right-hand side about the connected system, any tracked targets (google.com is the default added), and the ability to remove the agent connection (only the cloud connection, not the agent installation itself). In this example, I have connected my Windows 11 desktop, the same as an end-user would, and now need to set up the appropriate targets.
Collecting Data on an End-User Connection
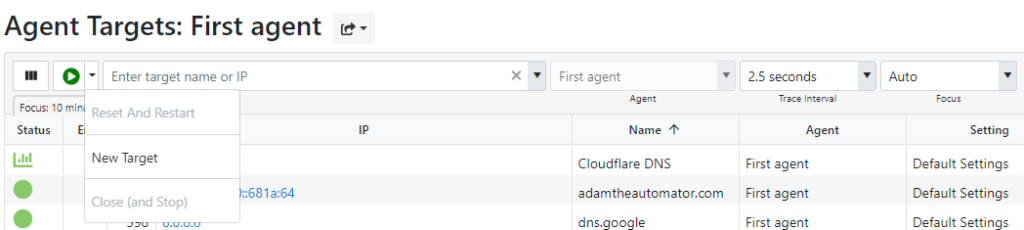
With the agent installed, now I need to set up useful targets and see where my connection is going wrong! Clicking on the Agent Targets button under the connected Agent brings you to a list of all of the configured targets for a given agent. A target is some endpoint, such as google.com, that the agent runs a continuous check on.
The default configured target of Google starts running once the agent is connected. I then added a new target of 1.1.1.1. When I first tried to do this, I clicked the drop-down arrow next to the run button under the Agent Targets and selected New Target. This, although logical to me, resulted in an infinite loading screen. What I was supposed to do was enter the target and then hit the Enter key or click the green Run button. This could be made better by displaying an informational message or a tooltip.
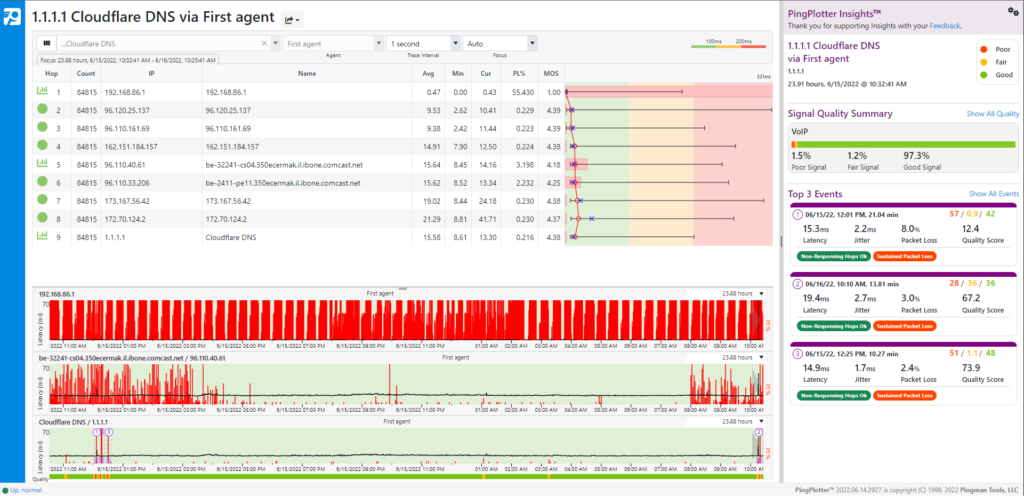
After I correctly added the target and enough time had passed, I had a good amount of data to analyze. As can be seen below, there is a wealth of information. I chose to display three graphs by clicking on three of the hops. I then clicked on the Insights button, in the upper-right, to give me a bit more information on the overall signal and events.
This was pretty interesting information, but still difficult to tell what the issue may be. Packet loss to the actual final destination was minimal, but the in-between loss was higher. The issue with my router appears to be due to a known issue that I wasn’t aware of before running PingPlotter Cloud. Seeing a large amount of dropped packets from the router, led me to look further into it, even if that did not appear to be impacting the packet delivery in the end.
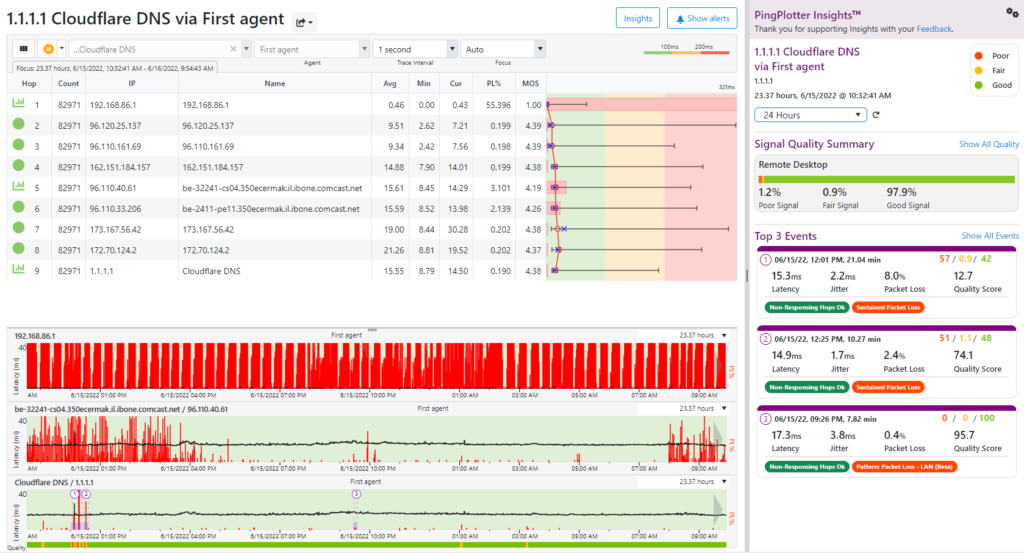
I was able to resize the columns, add multiple graphs, and change the time that I was looking at. This all helped me drill down into the issues more. What would make this incredibly powerful, is more insights into why this was occurring. This may require more information than the tool could provide, right now I could see there was an issue, but it was not clear as to why.
Troubleshoot Incidents with a Sidekick
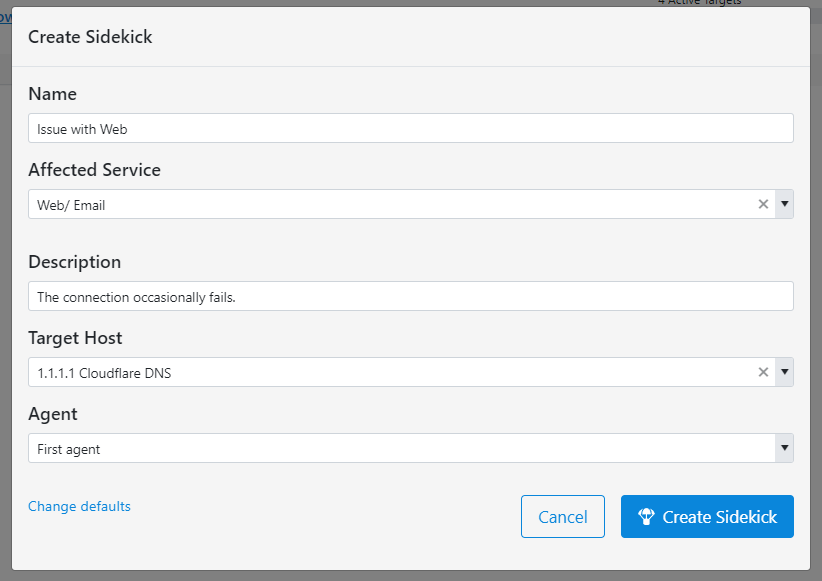
In PingPlotter Cloud, a Sidekick is similar to the agent, but for both the end-user and technician to use and is typically associated with a specific problem. To demonstrate this, I created a Sidekick, which used several targets and then was given a link to deploy to the end-user. Since I already had the PingPlotter agent installed, once the link was pasted into a browser, the data started collecting immediately.
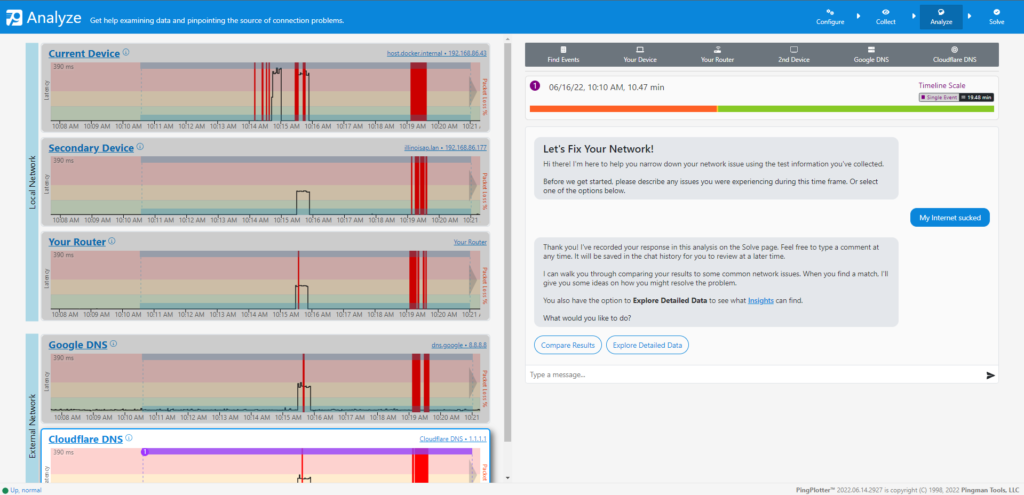
The end-user is given a specific web page that both they and the technician can monitor. It must run at least 10 minutes before any analysis can be done. I introduced 70% packet loss into my connection, which when analyzed did trigger an issue in Sidekick. Interestingly, the previous 10% packet loss and 150ms of latency did not trigger an issue. It would be useful to know what the thresholds are, and how they surface as an issue or not.
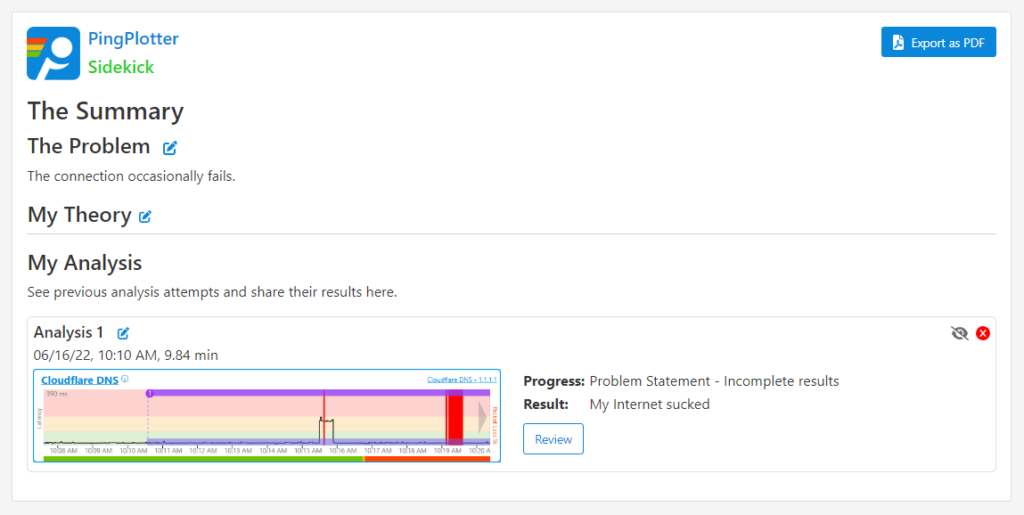
The resulting Solve screen shows a list of results that you can click Review on and look further into. The fact that the button says Solve implies that there are solutions here, but in reality, this is simply a roll-up of the highlighted issues. This would most likely be better known as Report instead, as it will be incumbent upon the technician to analyze the issue and look further into it.
Keep Your End-Users in the Loop with Livesharing
Say you want to share connection details with another technician or your end-users. With LiveShare links, you create a point-in-time link that shows them exactly what you see. This is great to include in incident reports, for teaming up with other technicians, and for sharing back to the end-user what you see.
In a given target, customize the view as needed to the time period, what graphs are shown, and if Insights are displayed, and drop down the sharing options menu to choose LiveShare.
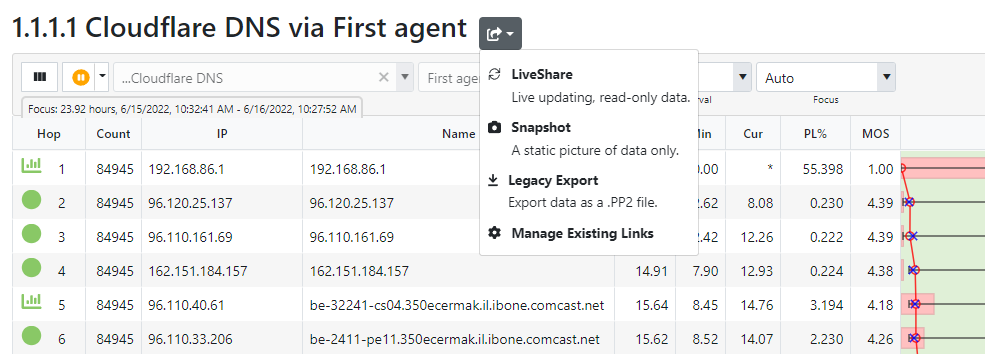
Once the LiveShare link has been selected, you are able to create a name, set an expiration date, and enter some notes. Once created, click on Copy Link and navigate to the page. The resulting page is a read-only page that displays near identical to what you would see for the real-time view.
The only issue I have with this is that it’s not obvious how to make this “Live updating”. You need to drag the graph all the way to the right for it to become live-updating. It would be nice if a tooltip, or a description was shown to make that obvious.
Going Further with Additional Users and Settings
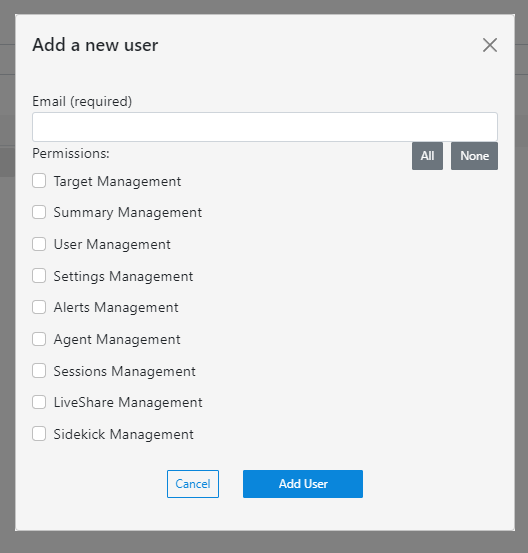
In a helpdesk scenario, you want to empower your technicians to troubleshoot on their own and utilize the power of PingPlotter Cloud. But, you may not want to give them all of the abilities to do so. PingPlotter Cloud allows adding users but only with access to specific areas.
As shown below, you are able to limit access to just what is necessary. This allows for powerful and selective access, empowering the technician but not risking security by granting too much access. The only additional options I would like to see are access based on groups and integration with other authentication services such as Active Directory.
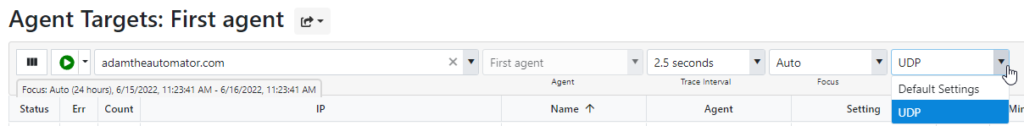
Within Settings, you have the unique ability to create a new named engine setting. What this allows is changing the packet type. For example, I have created a new setting configuration, named UDP, that will send UDP packets beginning on port 33434 and ending on 33625.
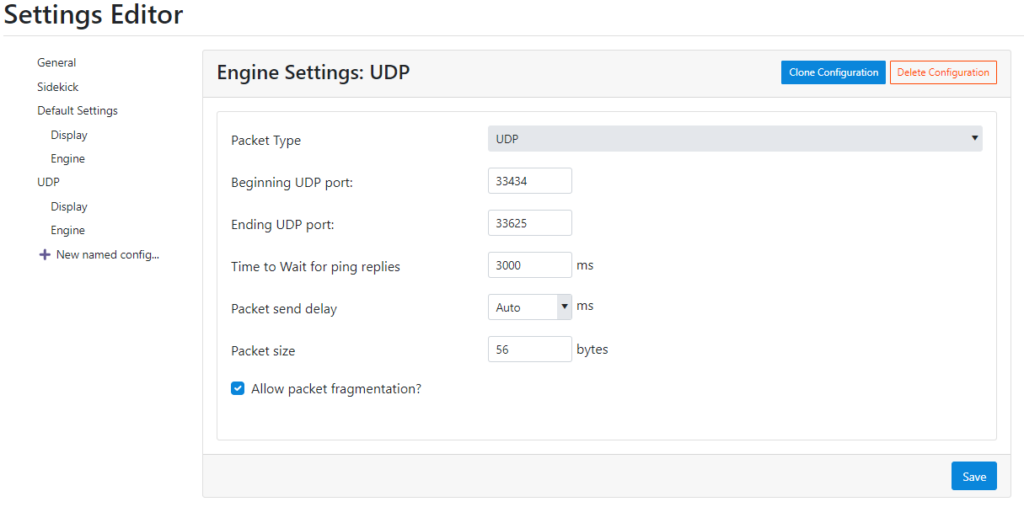
Once you have your new settings in place, you would select the new settings under the Settings dropdown when creating a new target. Once created, the target will now use those custom settings instead!
Impressions on PingPlotter Cloud
Troubleshooting network connections, especially on end-user systems, is one of the most challenging aspects of solving connection issues. PingPlotter Cloud does offer a variety of very useful tools, that are easy to use and work well to quickly pull information on an end-user device.
Insights are going to be one of the more powerful pieces and do contain useful analysis, but Insights still has a ways to go before really providing actionable solutions. I do believe that this is very hard for any network troubleshooting product as only so much information can be gleaned from one side.
Personally, I did learn useful information about my own connection, potentially even needing to replace my router which I wasn’t aware of before. This is a tool that would be very useful for many service desks out there, especially in the remote work age.
Conclusion
Overall, I can recommend PingPlotter Cloud for those looking to troubleshoot their own, or end-user connections. Geared toward an organization, PingPlotter Cloud is an excellent tool to add to the repertoire of any service desk. With a bit more refinement and building out of Insights, this could quickly become indispensable for many technicians!


