


A SQL Server database is a wonderful piece of storage technology when it’s working well. But, when performance starts to degrade, not so much; if queries are slow or workloads experience deadlocks or latency issues, an application’s performance will degrade. In this tutorial, you’ll learn tips and tricks for performance tuning in SQL server!
Let’s get started.
Prerequisites for Performance Tuning in SQL Server
All demos performed in this tutorial were done on SQL Server 2019 Developer Edition (free edition), but older versions, such as SQL Server 2014 or SQL Server 2016, should work also.
Normalize Your Databases
A good database design helps maintain data integrity. A normalized database can reduce the quantity of duplicated data considerably, simplifying read and write operations. Proper usage of foreign keys and primary constraints can also improve performance greatly.
Note that there are two types of constraints that can ensure data integrity – primary and foreign keys. A foreign key constraint states that the key may only contain values found in the referenced primary key, thus enforcing referential integrity.
But, keep in mind that performance will degrade if your databases have been normalized too much. Why? Because the more you normalize a database, the more tables you’ll create. As a result, there would be too many joins, which will impact performance.
You must select the appropriate and optimized data types when designing your database tables while considering the data stored in your database tables.
For example, rather than keeping a file itself, allow the file to reside in the file system and store the file path in your database table instead. Assume that you have a file named Test.txt in the root directory of the D:\> drive.
You can allow the file to be physically stored in the disk and its path stored in the database.
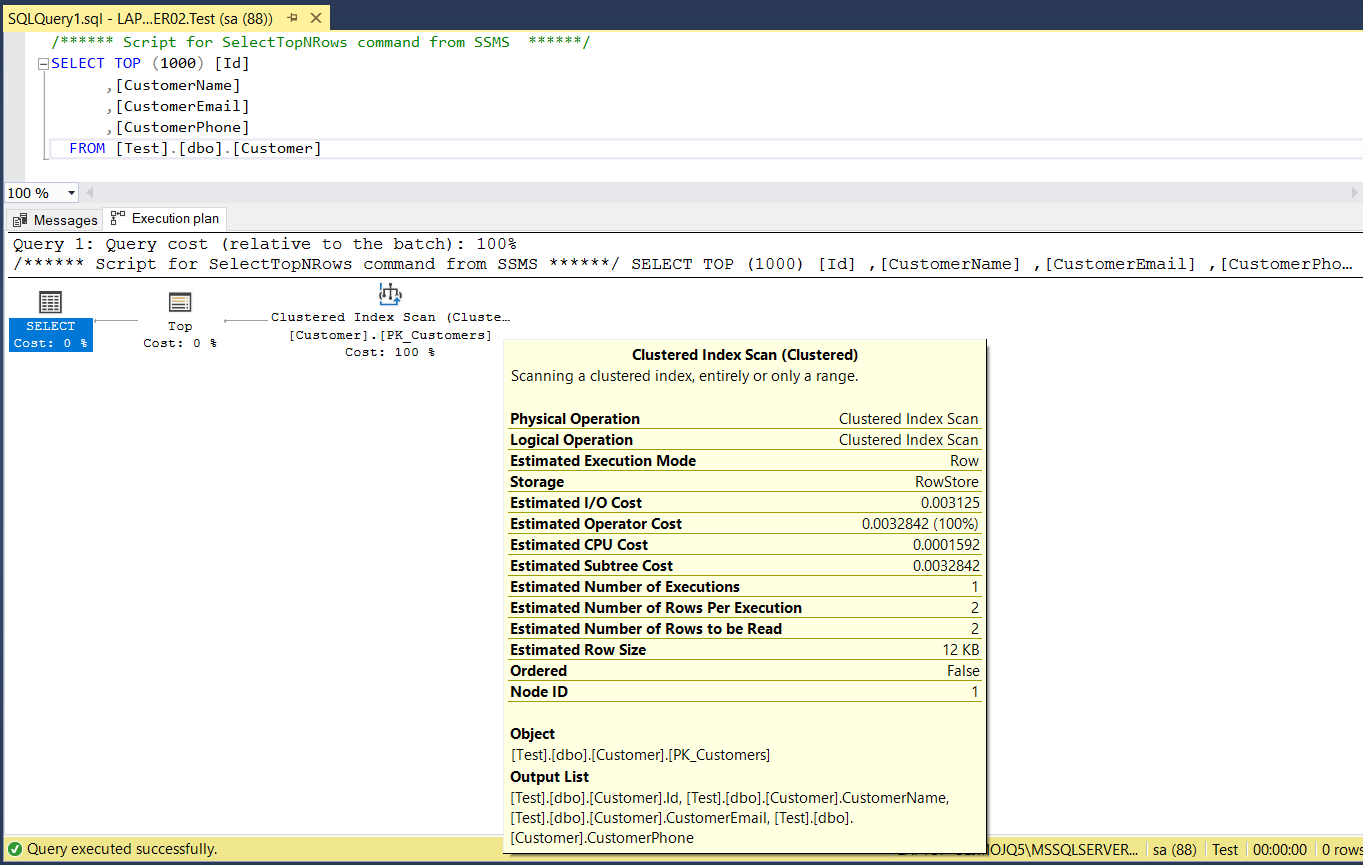
Create an Execution Plan
Knowledge is key, and knowing how a query performs can provide a ton of insight. One way to gain that insight is via an execution plan. An execution plan is a graphical illustration of the SQL Server Query Optimizer, the SQL Server’s built-in feature to naturally increase performance.
An execution plan lays outs performance information for a query working in conjunction with the query optimizer.
To generate an execution plan:
- Open SQL Server Management Studio
- Create a database query.
- Press the Ctrl+M keys to open the execution plan tab in the query window.
You’ll see below that the execution plan provides a lot of useful performance information about the query, such as the Clustered Index Seek or Scan results, estimated CPU and I/O costs, the estimated number of rows for each execution of the query, row size, estimated, etc.
Monitor Resource Usage with Performance Monitor
If your server can’t handle the load SQL Server puts on it, overall performance will suffer. You can monitor resource usage using the System Monitor tool (Performance Monitor) and performance counters.
Performance counters allow you to track in real-time resources the SQL Server is consuming, such as memory, disk I/O, CPU, and more. To start Performance Monitor, run perfmon.exe. In the Performance Monitor application, you should set up at least these below counters:
- Memory: Available MBytes
- Physical Disk: Avg. Disk sec/Read and Avg. Disk sec/Write
- Processor: % Processor Time
- SQL Server: Batch Requests/sec, Buffer cache hit ratio, and Compilations/sec
You can find many SQL Server-specific performance counters in the SQL Server documentation.
Create a baseline for resource usage (CPU, memory, and disk I/O) and set alerts and thresholds appropriately. A baseline is a known value used to compare subsequent measurements and performance. For example, 60–70 beats per minute are considered a good baseline for a middle-aged individual.
Similarly, you may establish a performance baseline by tracking performance indicators over a while and comparing them to previous results.
Separate Data and Log Files
An SQL Server database must contain a minimum of two files: a data file and a log file. The data files comprise stored procedures, indexes, tables, and views, while the log file contains information needed for all database transactions recovery.
Ensure that data and log files are kept on separate drives. The primary goal of this technique is to isolate random and sequential access to data while generating the transaction logs. If the data and log files are on the same drive, there can be increased I/O contention between them, resulting in performance degradation.
I/O contention occurs when more than one thread competes for the same I/O resources resulting in performance degradation. You might encounter I/O contention when there are many reads and writes, causing latency and bottlenecks.
When the number of your transactions grows, with the data and log files in separate drives, you will be taken aback at how much difference this approach makes.
The access patterns of data and log files in SQL Server are different. While the data file is accessed predominantly randomly, the log file is accessed in sequential order. Now, for random read and write access, the disk storage needs the disk head re-positioned.
Separating files with varying access patterns enables disc head motions to be minimized, thus optimizing storage efficiency. This is why access to sequential data (in the log files) is much more efficient than accessing random data.
Reduce Temporary Tables
Temporary tables are great at storing data temporarily as your working with them but doing so only makes queries more complex. If you found yourself using the TempDB a lot, for example, you should verify if you really need to. You may find yourself in a state of conflict with internal structures associated with the tempdb files.
If you have to use temp tables, you should build an index inside the temp tables to enhance the performance. You shouldn’t wait for the temp tables to be deleted automatically after use; instead, you should delete them as soon as you’re done using them.
Use Indexes Religiously
An index is a data structure used to expedite data retrieval operations on a database table. Proper usage of indexes can improve data retrieval performance considerably. Creating appropriate indexes for your database is one of the most important steps you can undertake in performance optimization.
Indexes are handy because they allow fast random look-ups and locate data that requires fewer disk I/O operations and low system resource consumption.
Before you can build effective indexes, it is critical to understand the type of queries and execution frequency. Additionally, if too many inserts, update, and delete operations are performed on your database tables, indexing may degrade performance.
At a glance, here are a few guidelines you should follow for using indexes properly:
- Avoid creating indexes on small tables
- It is a good practice to delete indexes that are no longer in use or used sparingly
- Avoid indexing a column that has few unique values
- You should check indexes to determine if they have been fragmented and then rebuild them
- Ensure that your queries are making the best use of indexes
- If you’re creating indexes on multiple columns, take into consideration how the columns will be queried
Avoid Correlated Sub Queries
A correlated subquery (also known as a synchronized subquery) is a query nested within another query that utilizes values from the outer query to work. The subquery may have to be evaluated individually for each row processed by the outer query so that execution may be time-consuming.
A correlated subquery utilizes the values from the parent or the outer query. Hence, it executes row-by-row once for each row returned by the outer query, which decreases the SQL query performance. Below is an example of a correlated sub-query:
In this example, the inner query (Select DepartmentName) executes once for each row returned by the outer query (Select e.FirstName). You’re reading the Department table for each record of the Employee table – this will degrade performance.
Select e.FirstName,
e.LastName,
(Select DepartmentName FROM Department WHERE Id = e.DepartmentID) AS DepartmentName
From Employee e
To fix the issue with the correlated sub-query, you can refactor the code, as shown below:
Below, the query reads the Department table only once and joining with the Employee table, which is a much more efficient query. This query is proof that using correlated sub-queries is a big NO.
Select e.FirstName,
e.LastName,
d.DepartmentName
From Employee e
Left Outer Join Department d
On e.DepartmentId = d.DepartmentId
Avoid SELECT * in a Query
A query in SQL Server runs faster when returning fewer data, so be sure to avoid using SELECT * and specify only the columns you want to return from a query. Fine-tuning a query is an important step you can take to tackle performance issues in SQL Server.
As an example, if you need only the ProductId and ProductName from the Product table, you should use the following query:
SELECT ProductId, ProductName from ProductAnd not this query below.
SELECT * FROM ProductAvoid Queries Inside Loops
Writing queries inside loops results to degrading application performance because of repeated database access. So be sure to avoid writing queries inside loops.
Take a loop at the example code below that runs queries inside a loop. The query inserts 100 records in a table named MyTable.
for(int i=0; i < 100; i++)
{
SqlCommand sqlCommand = new SqlCommand("Insert into MyTable (FirstColumn,
SecondColumn, ThirdColumn) Values (.....)";
sqlCommand.ExecuteNonQuery();
}
The fix to this is moving the queries outside of the loops. If you’re to speed up inserting a lot of data, you can batch your rows using a single insert statement as shown below:
INSERT INTO some_table (FirstColumn, SecondColumn, ThirdColumn)
VALUES ('row1-value1', 'row1-value2', 'row1-value3'),
('row2-value1', 'row2-value2', 'row2-value2'),
('row3-value1', 'row3-value2', 'row3-value2'),
(... etc etc ...)
Avoid Shrinking Data Files
Reclaiming space by shrinking data files is possible, which is accomplished by shifting data pages from one end of the file to an empty area nearer to the beginning of the file.
But, shrinking data files in SQL Server hurts performance. Let’s understand why it is so. Shrinking creates index fragmentation, which is expensive in terms of locking, I/O, and transaction log generation, leading to poor performance.
If you need to shrink your data files, you must consider the performance impact before you do it. You should shrink your data files in rare cases, if at all.
Determine Performance Bottlenecks
The term bottleneck implies performance degradation of SQL Server. The CPU utilization, memory utilization, and disk usage are common performance bottlenecks in SQL Server.
Below are some of the common symptoms you will observe when a bottleneck occurs:
- Long I/O wait times
- Increased query execution time
- Increased disk activity
- Increased CPU and memory utilization
Memory bottlenecks
Memory bottlenecks are a result of insufficient memory resources available to your SQL Server instance. The SQL Server will attempt to write data to disk to free up the memory space to load new data onto the memory. When this occurs frequently, performance will eventually degrade.
To avoid memory bottlenecks, you can take advantage of a query optimizer to avoid using unnecessary or non-performant queries.
I/O Bottlenecks
I/O bottlenecks are a result of inadequate storage available for supporting regular database operations. It occurs when SQL Server needs to load a large amount of data from the disk, thus saturating the I/O channels.
You can avoid I/O bottlenecks by setting up monitoring, alerts, and threshold limits appropriately so that you can determine when to limit reading or writing database pages to and from the disk.
CPU bottlenecks
CPU bottlenecks occur due to insufficient hardware resources in your computer. It can happen when SQL Server needs to process too many queries at the same point in time.
When CPU bottlenecks occur, your queries wait before they can be processed. You can check the logs to determine whether your SQL Server instance is using excessive CPU cycles. You should optimize the execution plan of the queries to reduce CPU usage and avoid bottlenecks. You can know the top CPU-consuming sessions from SSMS.
You can configure performance monitor to determine CPU consumption in your computer.
Take advantage of tools such as SQL Profiler to retrieve the complete T-SQL activity of SQL Server. You can also leverage Dynamic Management Views (DMVs) to determine server restarts and memory pressure.
Conclusion
This tutorial has given you a head-start into SQL server performance tuning. You’ve learned the importance of performance tuning in SQL Server and how to apply each technique. You can now keep your SQL server at its prime performance, from creating execution plans to determining the bottlenecks.
Now which technique piqued your interest the most? How would you make your own performance tuning strategy?


