Have you ever searched high and low to find an errant network switch or misbehaving router? Maybe you could see the device on the network, but in-depth details and network connections were lacking. If you are looking for a single platform to aid in network discovery, monitoring, and management, then look to Auvik.
Today’s complex networks, made even more so by the increase in remote work, are challenges for any organization to manage. As any network administrator can attest, myself included, having an integrated dashboard makes a world of difference.
Can Auvik live up to the hype? With my over 20 years of IT experience, I take an in-depth walkthrough of the features demonstrated in the provided network management sandbox and in the end give you my opinion of the product.
Auvik has sponsored this post. If you’d like to learn more about Auvik, check out their website.
Introducing Auvik Network Management
Auvik is a cloud-based network management platform. All too often, network management software is on-premise with remote-access limitations. In today’s world, distributed workforces demand flexible solutions.
With only a browser, you can view the entirety of your network. Discover performance issues with real-time bandwidth usage and device utilization, act on issues with helpdesk-integrated alerting, and dive deep into device configurations with automated backups and configuration difference checking.
You may ask if a cloud-based network management dashboard is secure enough for critical network systems. To that end, all Auvik accounts enforce mandatory two-factor authentication methods with role-based security. Single sign-on (SSO) options exist as well for integration with existing authentication systems.
Comprehensive auditing capabilities track user device and configuration changes, remote connections, and account billing updates. Taken together, Auvik offers a view into user activity within the entire system, enabling you to quickly act on any unauthorized access.
Getting Started in the Auvik Dashboard
When you first open the Auvik dashboard, as shown below in the provided sandbox, you are presented with a graphical network map and a series of widgets underneath. Although the network map is handy to visualize your overall network, most may want to immediately see if there are any issues.
You will find the top device usage, open alerts, the number of online network elements, and any detected misconfigurations. Typically, these categories cover what you will need to act on immediately.
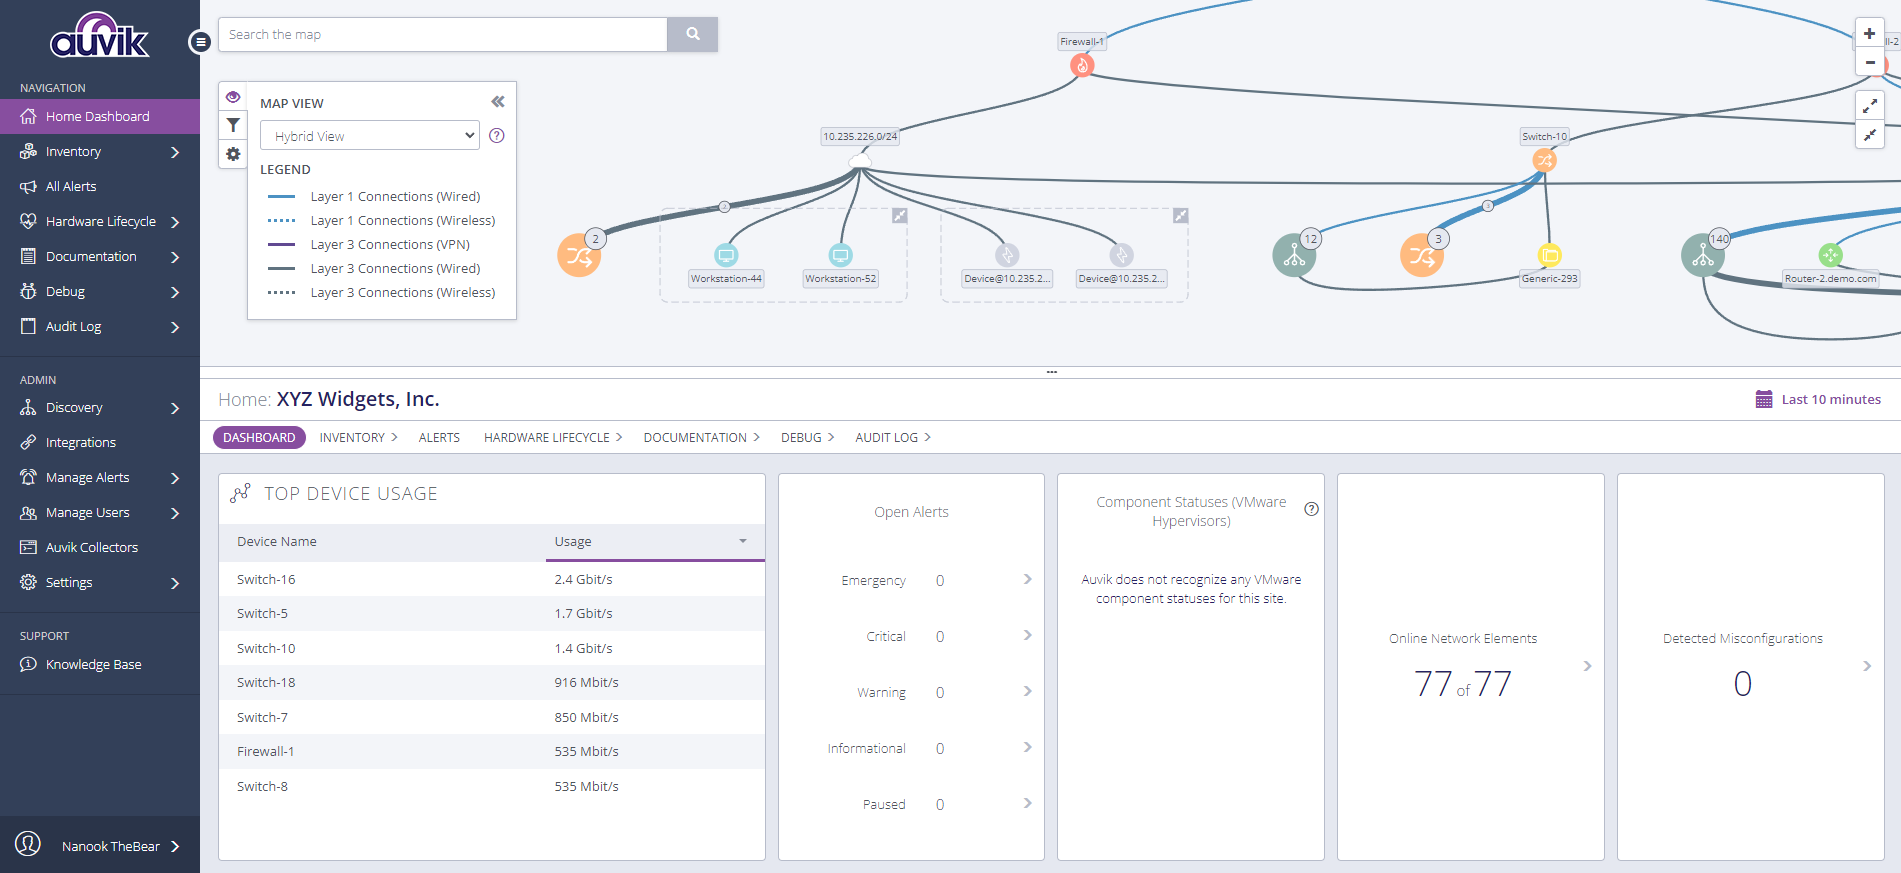
To hide the network map, simply drag the lower section all the way to the top with the divider denoted by the three dots. This was not very obvious at first, but nonetheless does allow you to customize the view as you need.
Ideally, with alerts, online network devices, and misconfigurations any concerning information would stand out visually. Even without, I personally could have used Auvik to detect the misconfiguration of a device instead of opening a terminal session to each device and manually checking the configurations, saving hours of time.
Exploring your Network Inventory
Any network is made up of a myriad of hardware devices and logical entities, making tracking difficult. The Inventory section displays all of the discovered entities. Ranging from hardware under the devices section to logical distinctions such as networks, interfaces, and services you find an easily navigable list of your inventory.
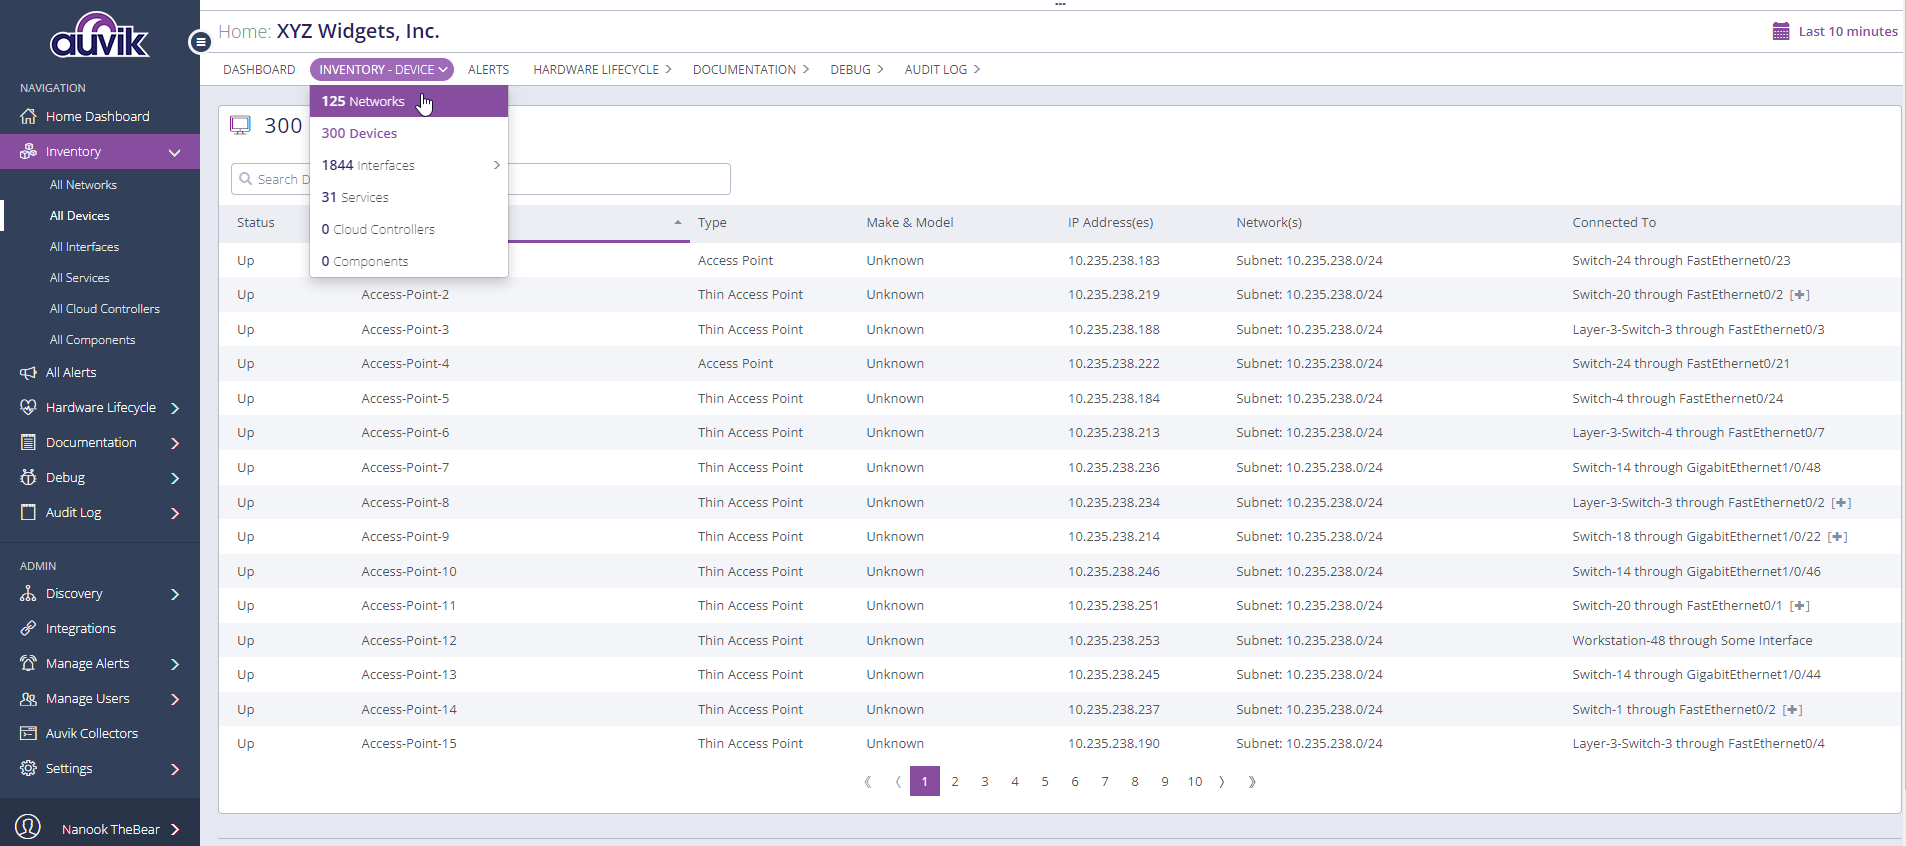
Having a single pane to quickly locate, view relevant information, and access an inventory item is invaluable. For example, in the past, I’ve been tasked to find all Cisco devices on the network. Instead of relying on spreadsheets and physically locating devices, a simple search as shown in Auvik saves time.
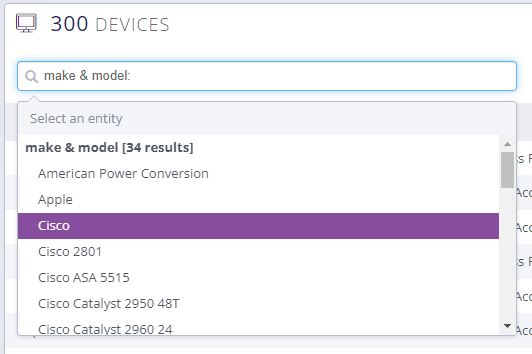
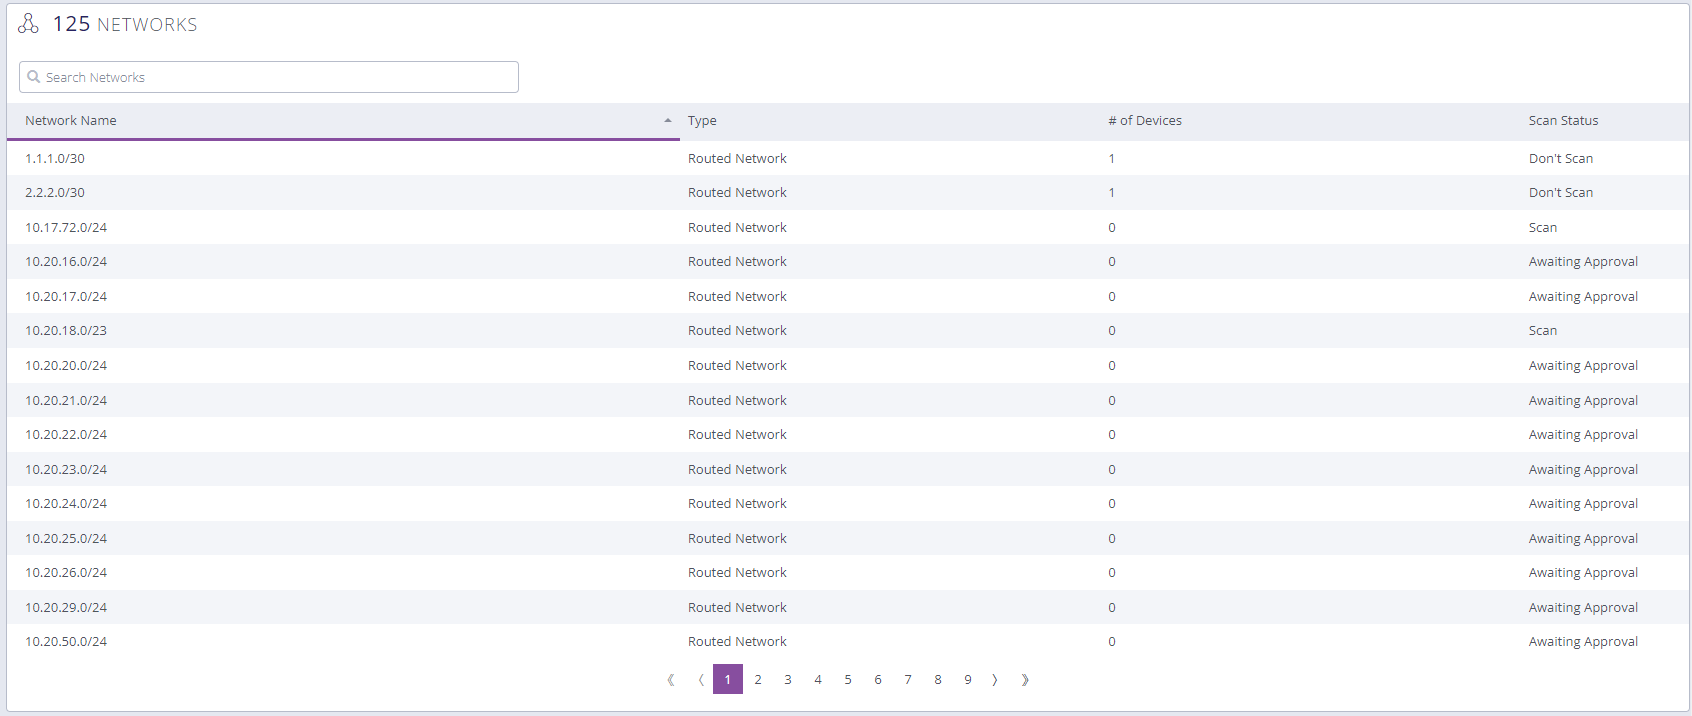
Once filtered, you are shown relevant information, but no ability to add or remove additional columns. Since Auvik has a wealth of information on each inventory entity, it would enhance the filtering capability to offer configurable views.
Additionally, for select columns, such as Scan Status on the networks inventory, it would be useful to have quick actions that could be taken such as Approving. Also, offering quick filters for certain columns, such as Type under networks, would make drilling down to specific types such as VLANs or Wi-Fi networks easier.
These features would be nice to have, but at its core, Auvik provides relevant information that you can quickly use to drill down into a specific inventory item to learn more or troubleshoot an issue.
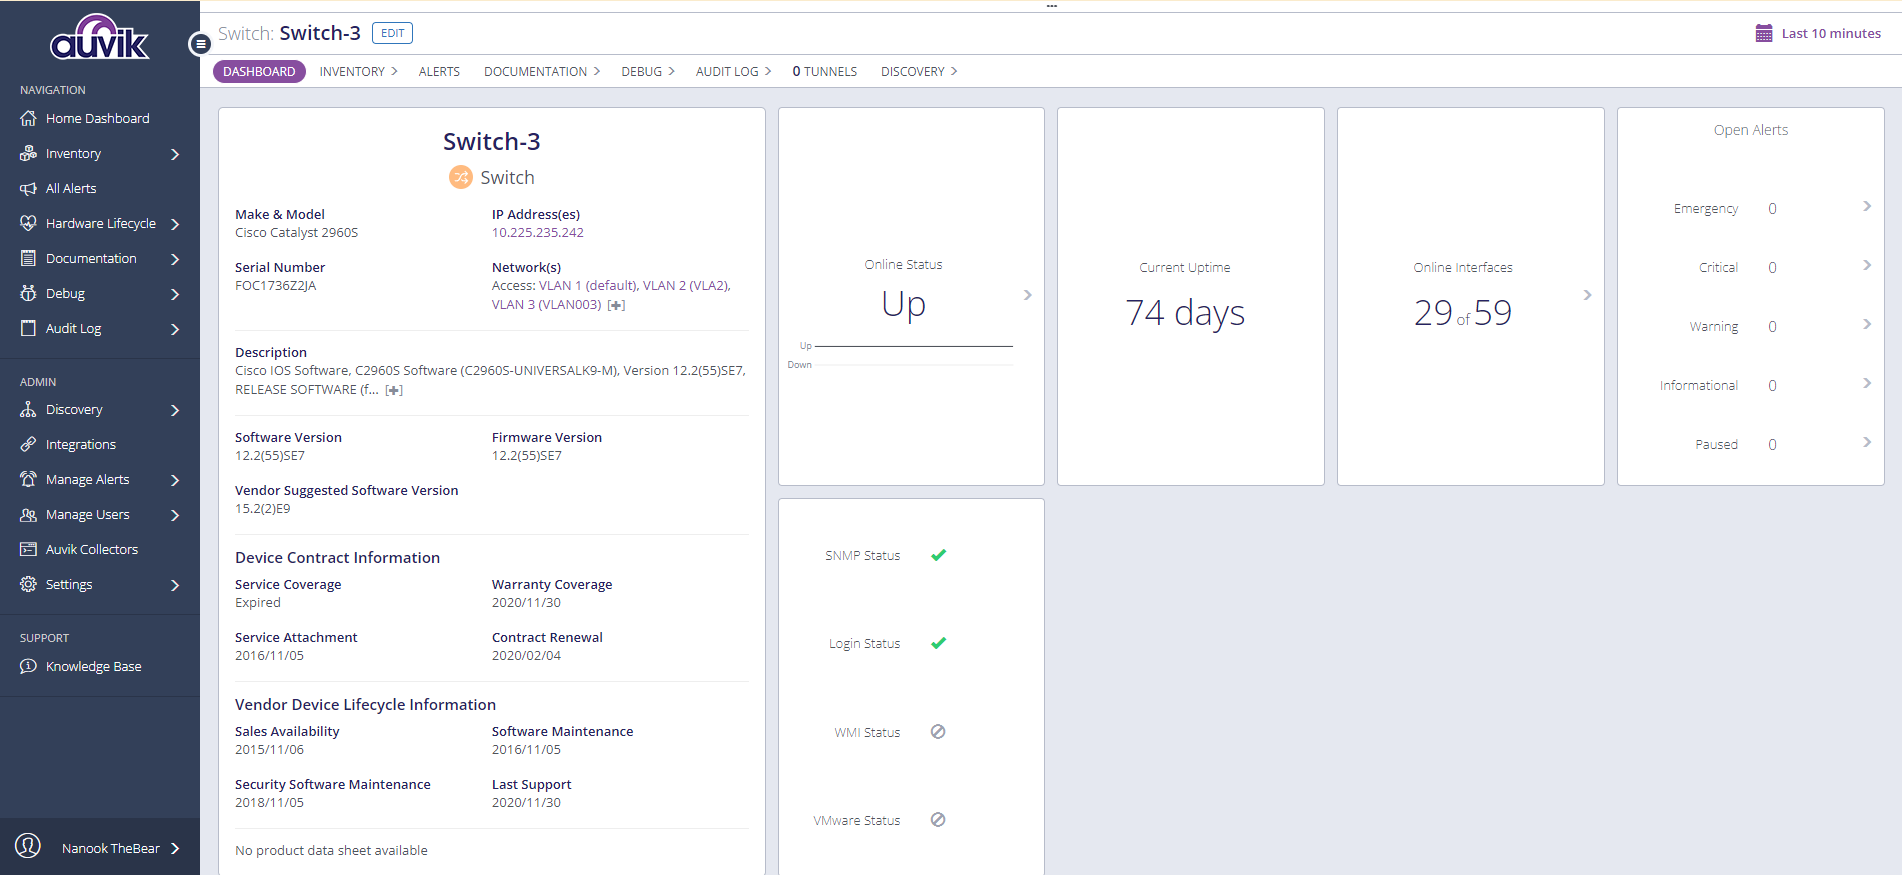
By clicking on a specific inventory item, you are presented with in-depth information on that item. This ranges from software version information, warranty information, to service status and device metrics. The initial dashboard for a specific item displays connectivity status, actionable information, and any potential alerts.
In the example below, I see that there are 29 of 59 online interfaces, but no indication if that is an error that needs to be addressed. Though the widget is featured prominently, making a reaction to an issue quicker, it would be best to have further context and status around the displayed numbers.
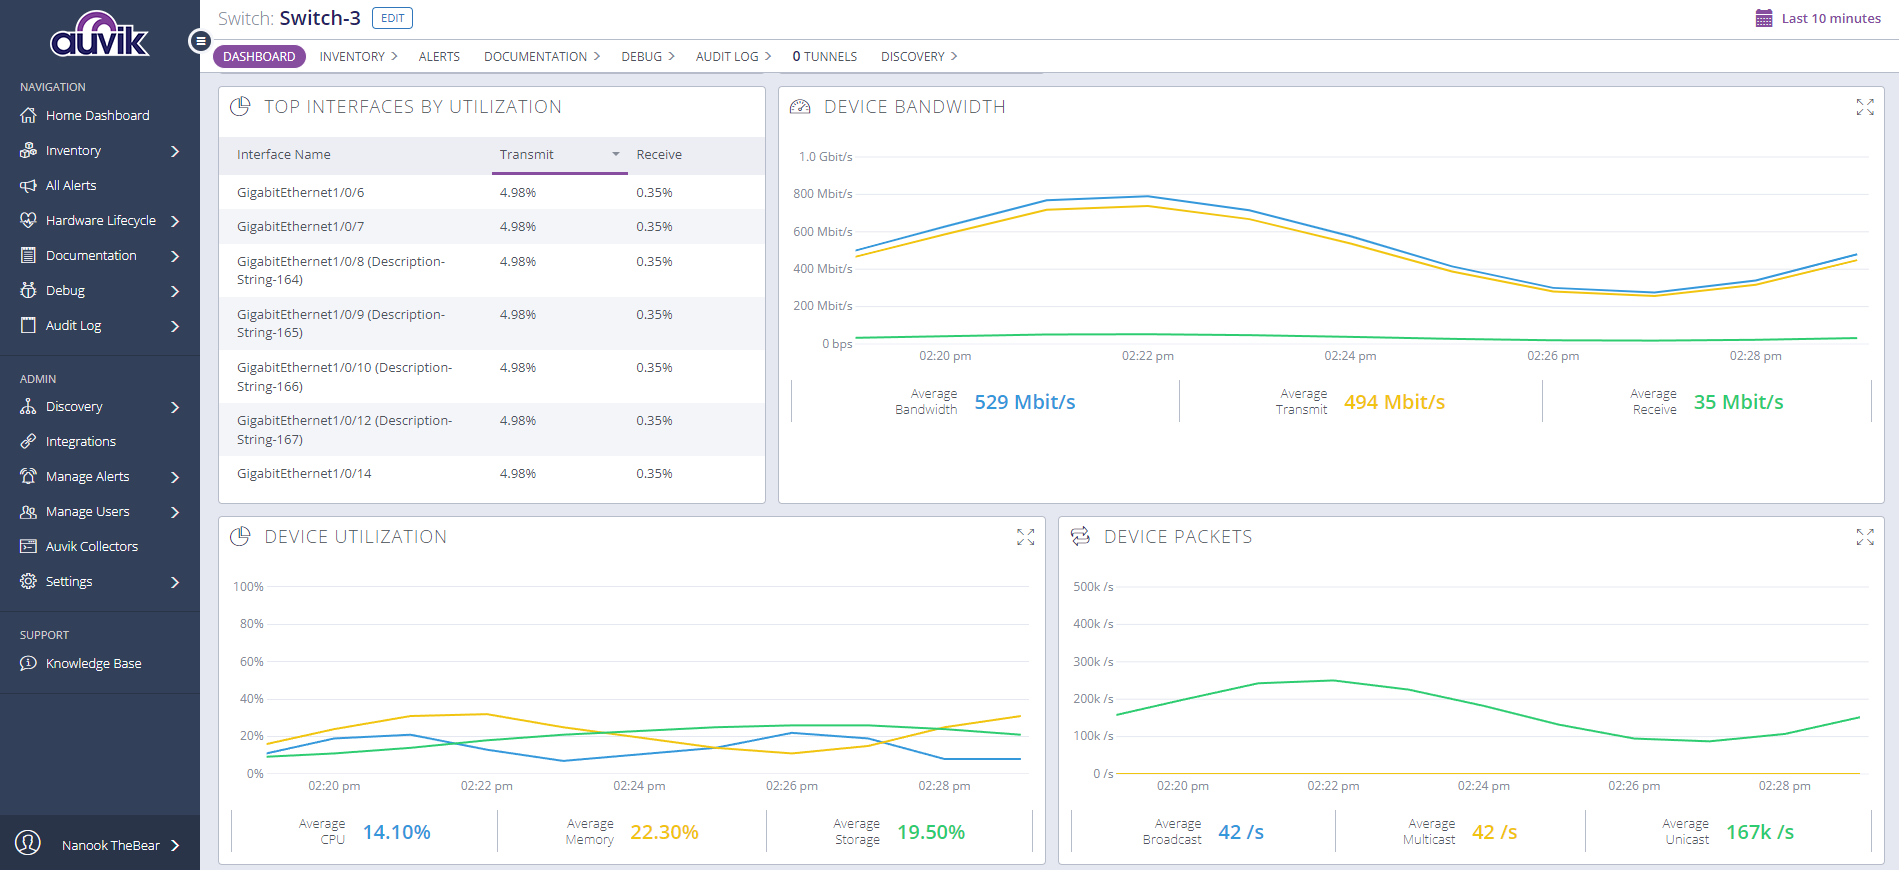
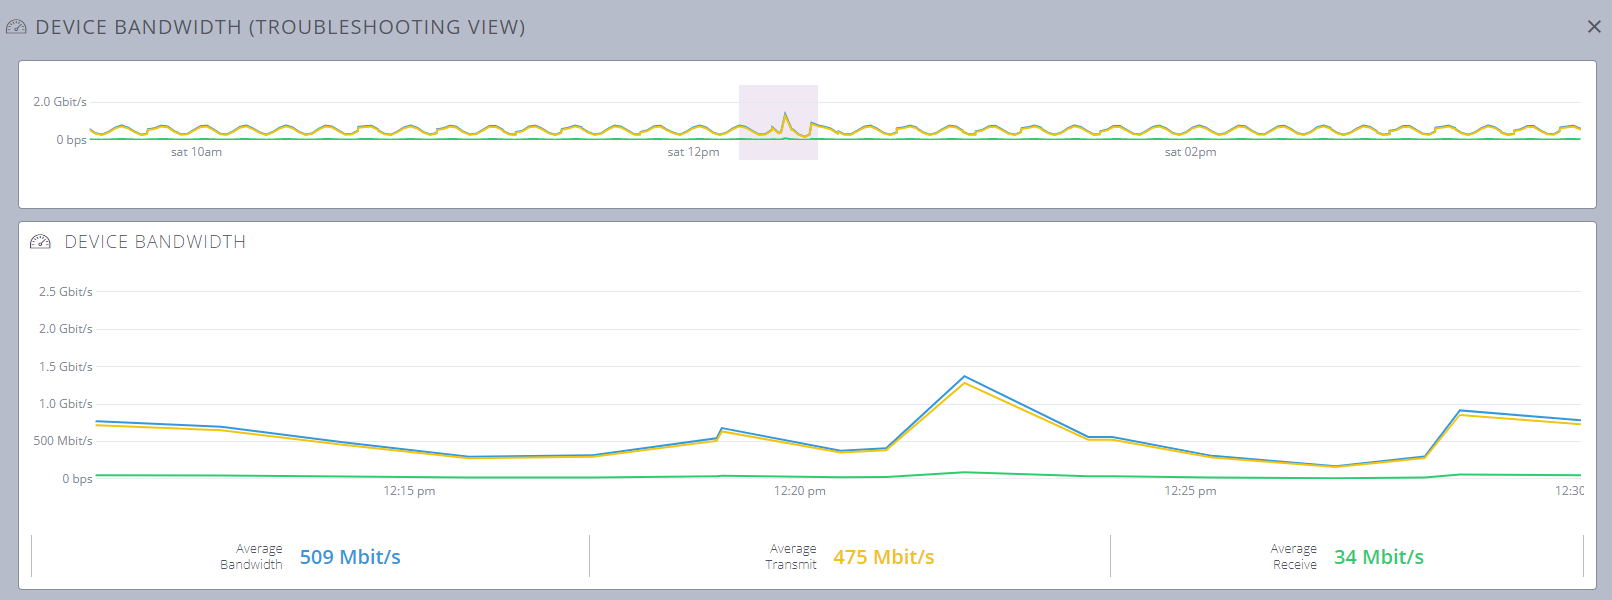
Troubleshooting networks is difficult in that often there are unintended traffic spikes, transient network issues, or a misconfiguration resulting in dropped traffic. Graphs offer a fast way to visualize the issue.
By scrolling further down an inventory items dashboard, you will find real-time graphs of relevant information, where device bandwidth, utilization, and packets are shown.
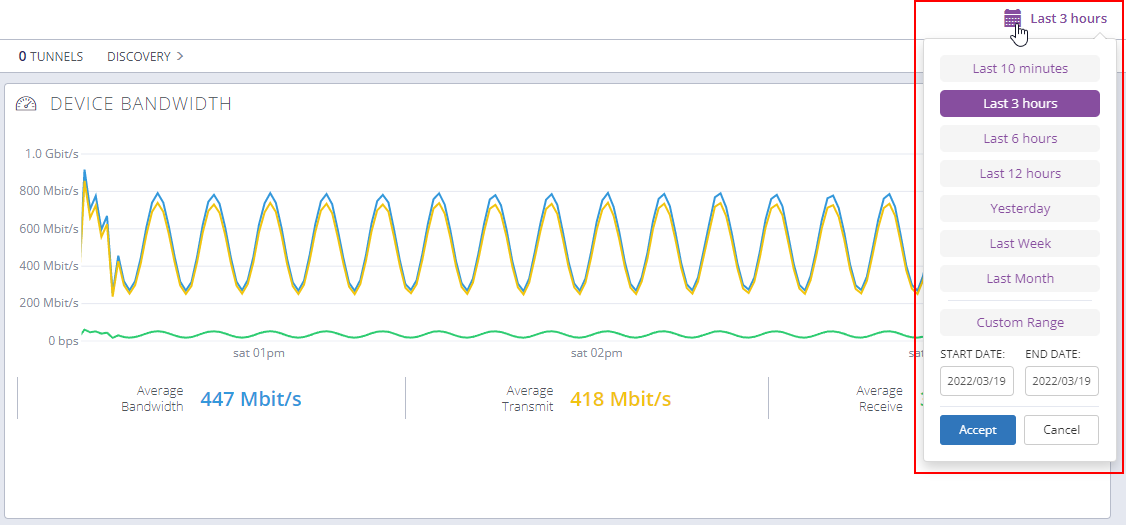
Of course, you may want to drill even further in. As is often the case with an incident, I’ll be given a timeframe when a problem occurred and need to discover what exactly happened. You can use the filtering ability to choose a set timeframe or a custom range to update the graphs as shown below.
What if you want to look deeper still? On any given graph, click the expanding arrows button, in the upper right, to open the troubleshooting view, which respects the filtered timeframe. Once there, you can click to drag and highlight a region in the top-most view to update the corresponding graphs below.
Stay in the Loop with Alerts
When in the field, you will not have an open dashboard at all times. Proper alerting on issues is important to stay on top of any problems. Here Auvik offers a wealth of options.
Not only do you have pre-configured alerts, but complex custom alerts are easy to create. Utilize variables in the Alert Trigger Description to personalize notifications, making it easy for a network admin to jump in and fix a problem without searching for the issue.
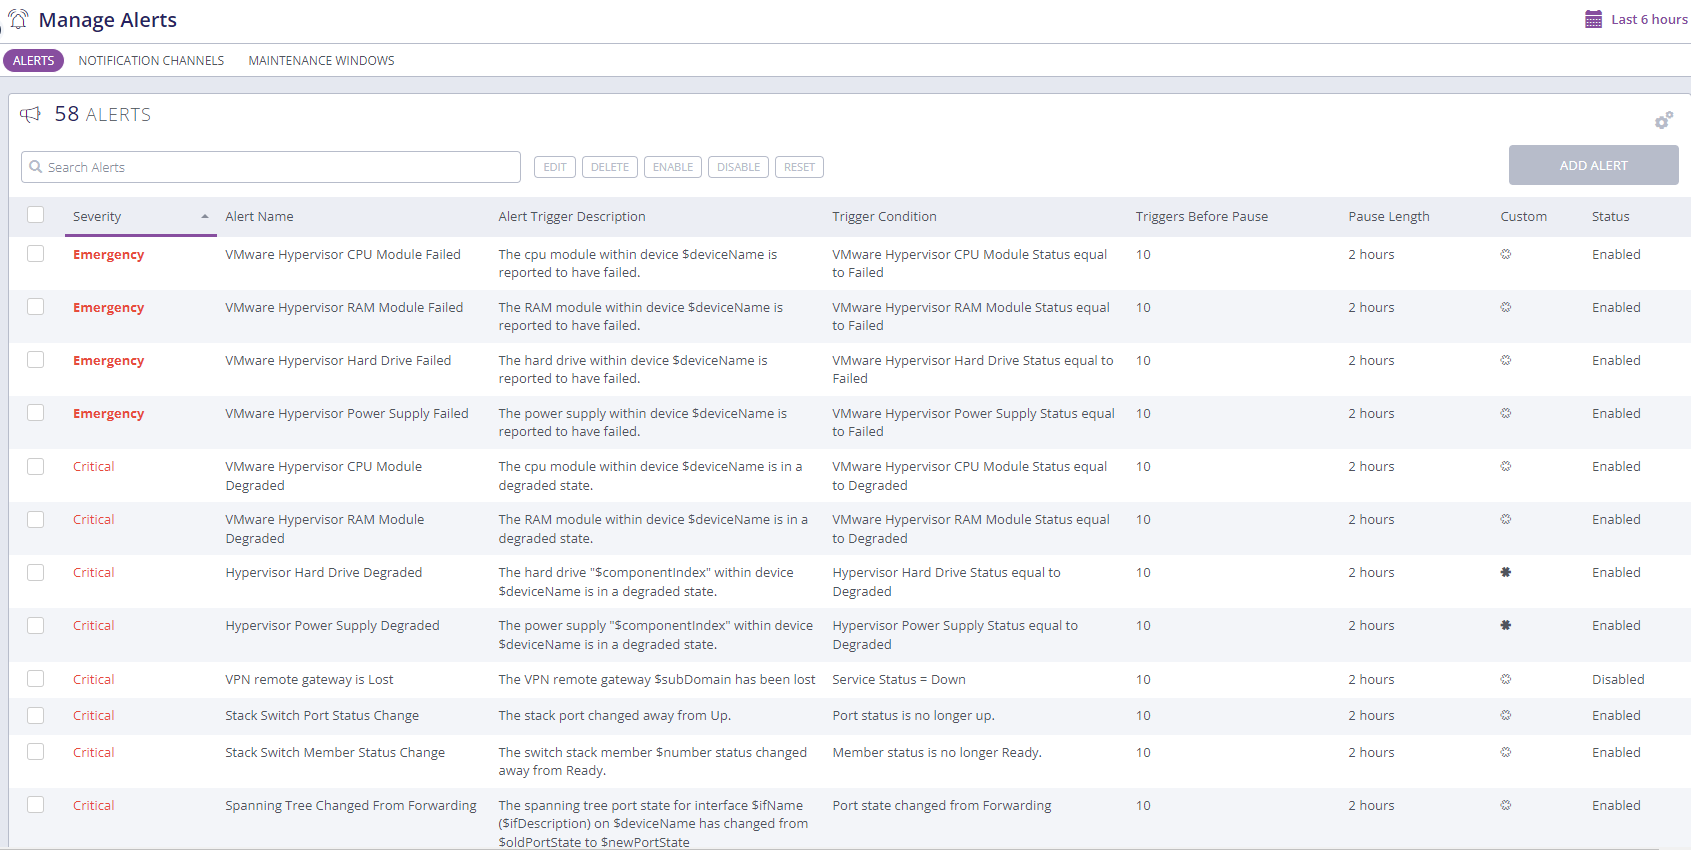
Many tools do not often granular enough tools to suppress these alerts, but Auvik has both the Automated alert noise watchdog and alert governor. Combined, noisy alerts are automatically suppressed to avoid filling up notification queues and overwhelming a team.
Too often I’ve had a problem with an alert that is noisy, such as a high CPU that consistently spikes. This may be considered normal behavior, but leads to alerts sent every five minutes. With the alerting tools, this type of alert fatigue is reduced and only the relevant information is sent.
Keep Devices Updated with the Hardware Lifecycle
Hundreds of devices mean constant hardware and software updates. Keeping track is difficult, and often tools only focus on the software side. With network gear, tracking the servicing information, such as warranty, is just as important. Vendor support is critical when a component fails.
Auvik offers a dedicated section for the hardware lifecycle. Staying on top of software versions is critical for patching and protecting against security threats, especially for network gear. Easily see which devices are not up to date with the Vendor Suggested Software Version.
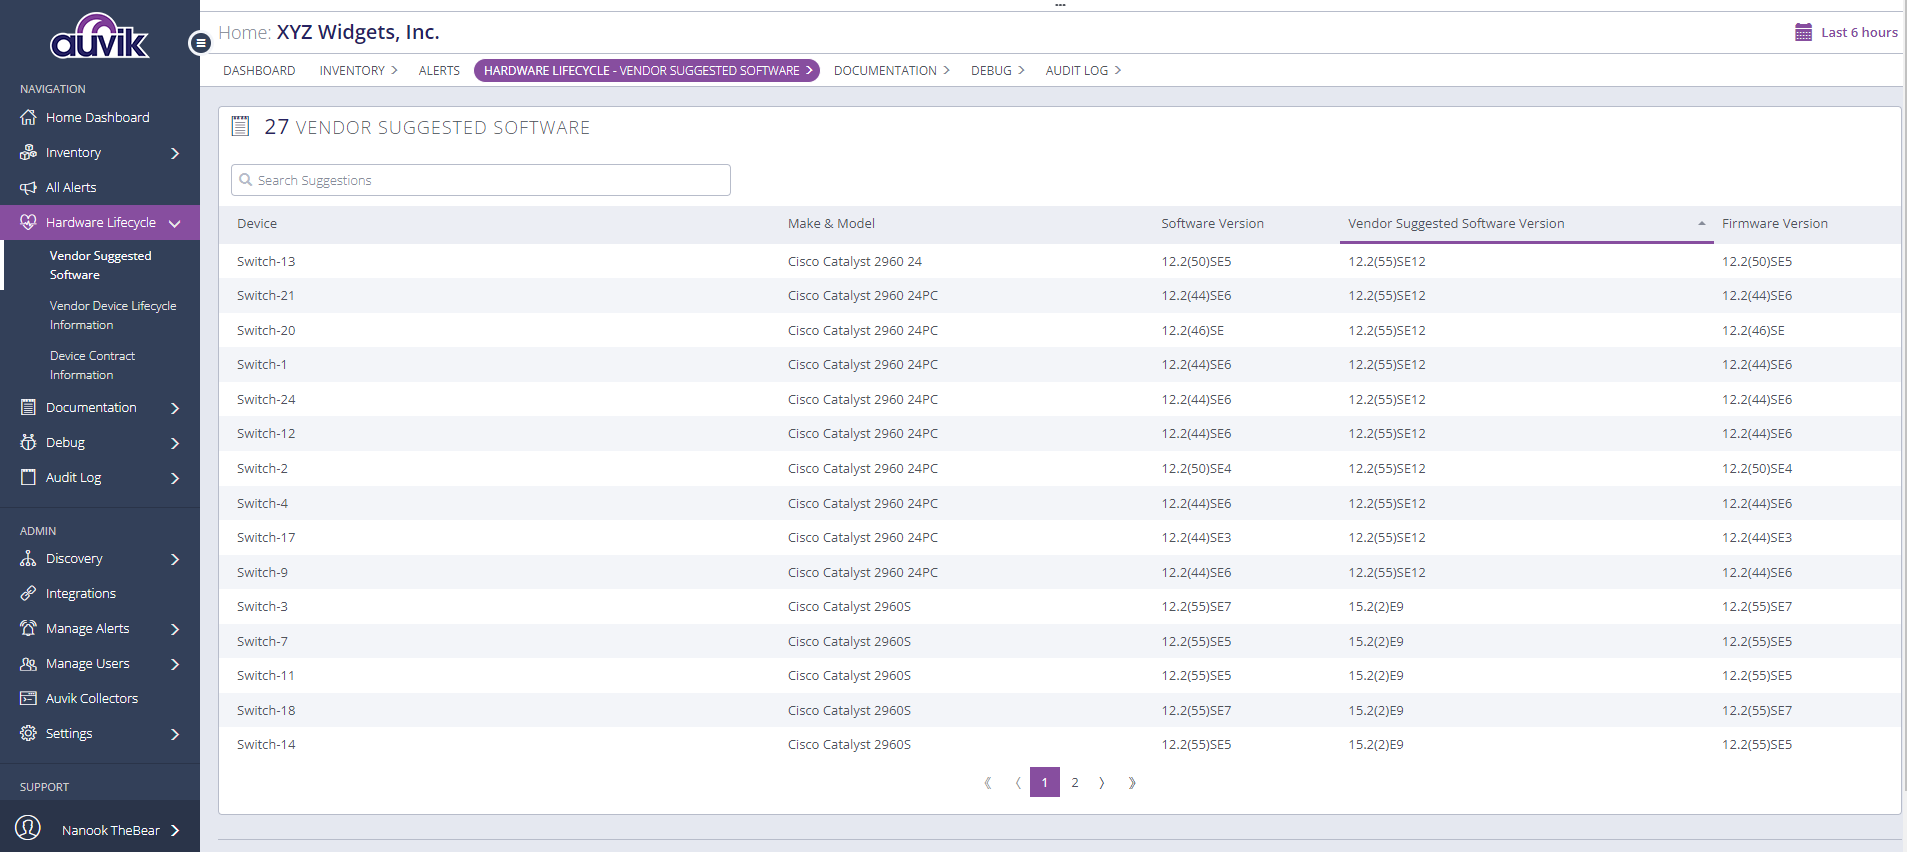
The recommended software version is currently only available for Cisco devices.
Understanding how long your network devices are covered, and when the final security software maintenance is available makes purchasing decisions easier. Nearly every organization I have worked in relies on spreadsheets to track this information, often out-of-date. With this information, I would have been able to recommend purchases early, rather than the typical last-minute scrambles.
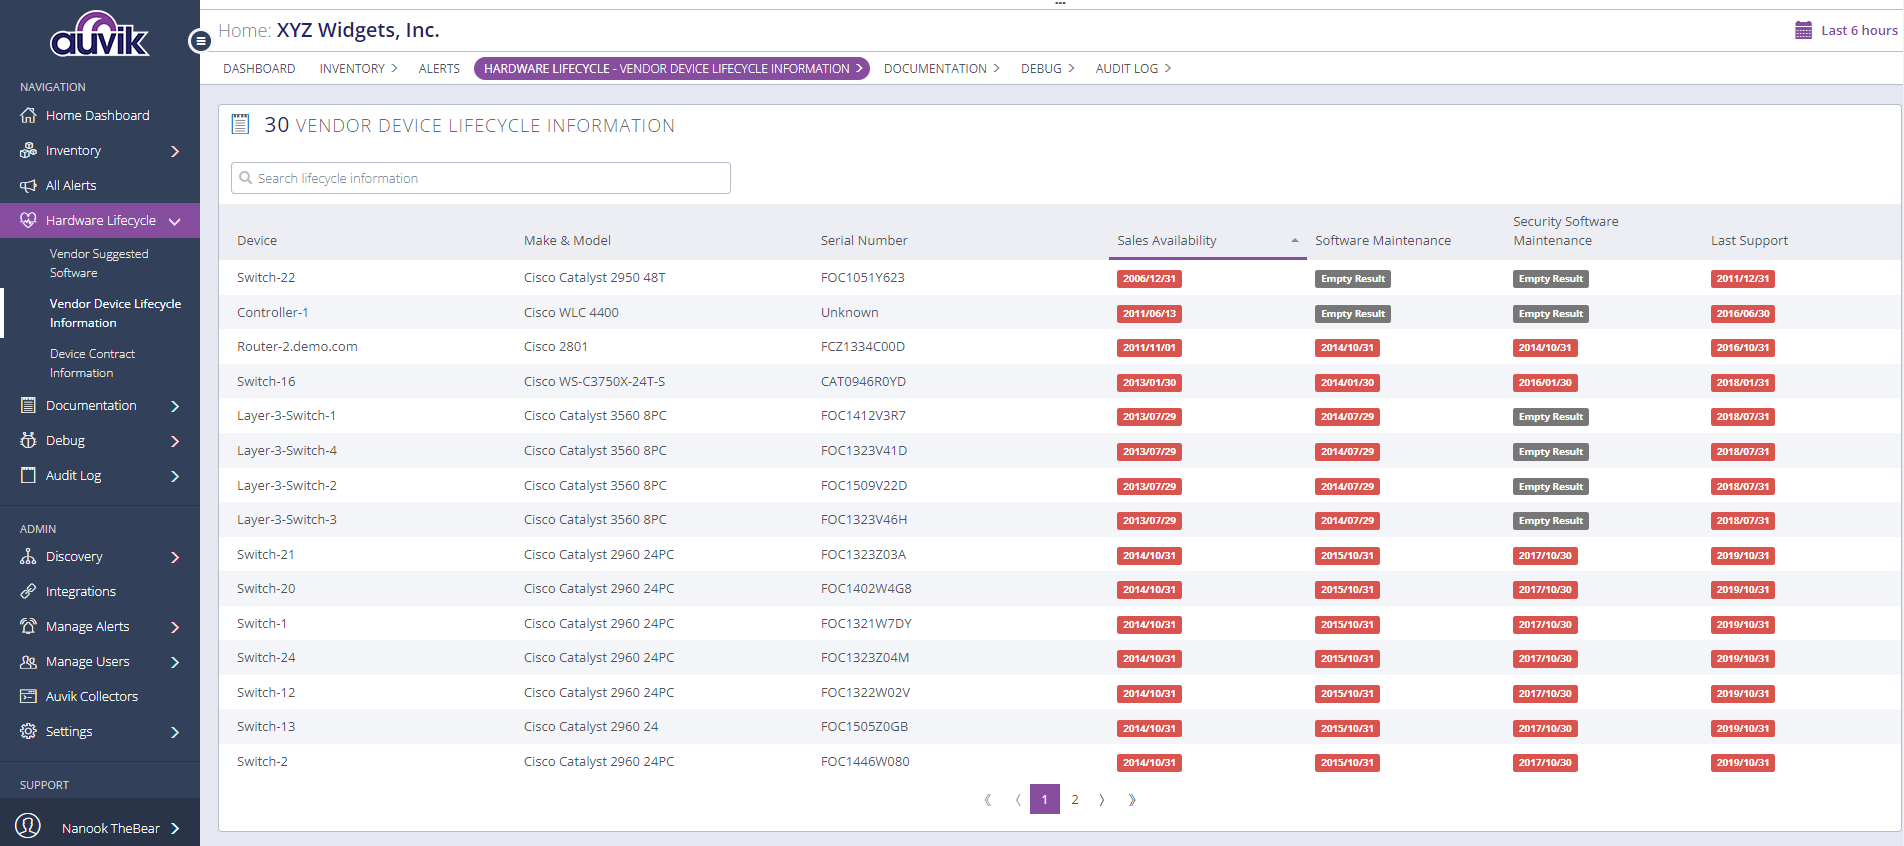
Software maintenance and Security software maintenance data is available to Cisco devices only.
Finally, equally important is the device contract information. Though a device may no longer be sold, that does not mean the vendor stops supporting it, especially with long-term support contracts. Here, you can quickly determine what coverage is expired and act to renew support or replace the device.
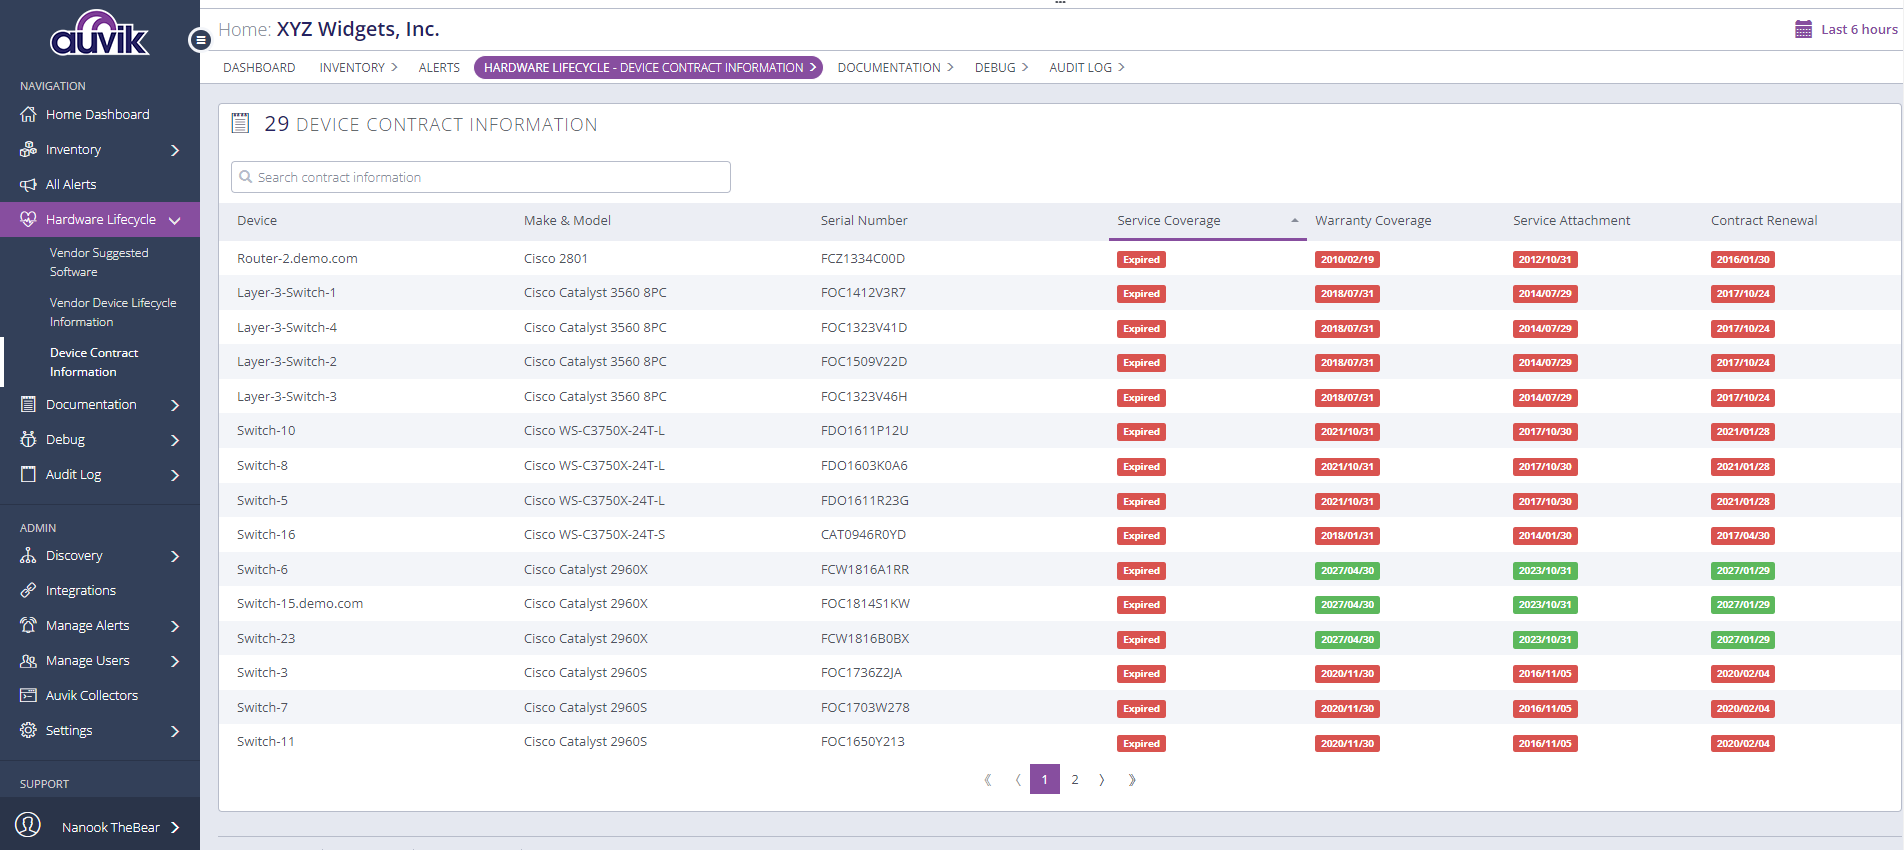
Servicing information is available to Cisco devices only, and requires the use of Cisco credentials which automatically pull in the data within 24 hours after connection and refresh the data daily.
Understanding the Environment through Documentation
As is often the case, organizational knowledge is critical to keeping an environment functioning. Notes share knowledge with the rest of your team, while reports surface actionable information, and configuration backups provide peace of mind.
Notes are useful, but I was unable to see if the editor offered rich markup functionality, which is important for context. Sometimes the most critical information needs to stand out. But, having notes integrated into the dashboard makes finding all relevant information much easier than a separate application would.
In-depth reports that combine graphs and tabular data, make understanding how the environment is functioning easy to see. The only downside is that there is no custom report-making ability yet, nor the ability to customize existing reports, but the pre-defined reports are well produced and usable out-of-the-box.
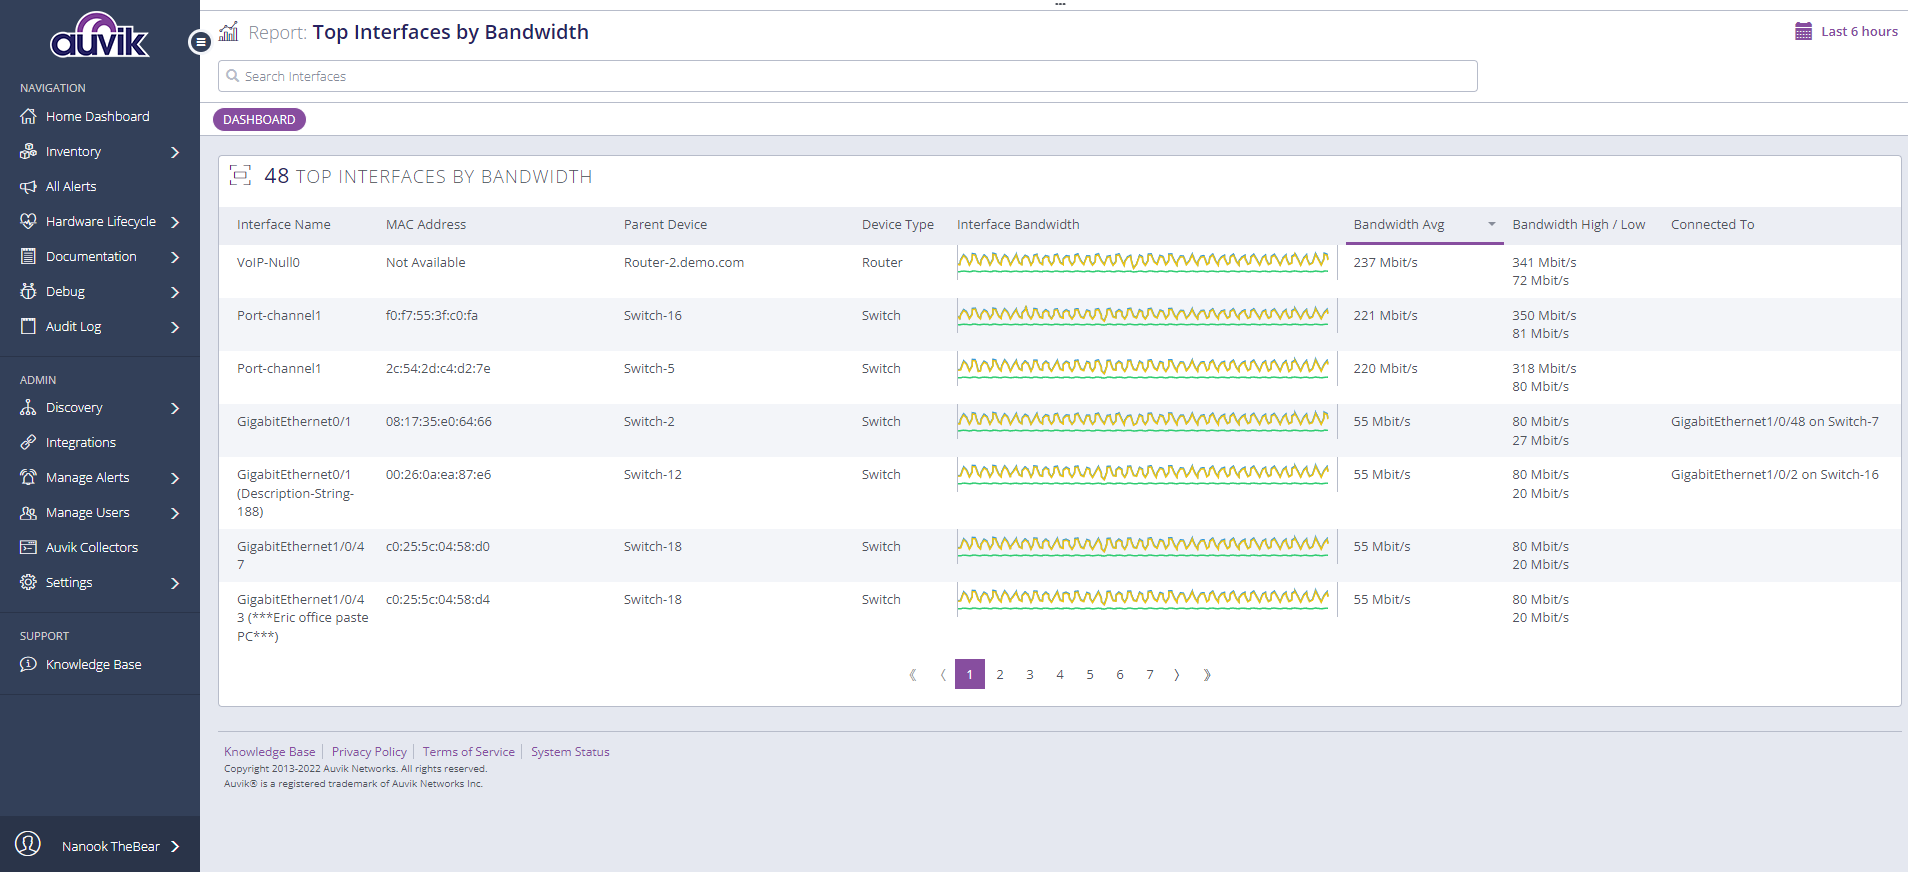
Though I was unable to review the configuration backups and differencing functionality, the ability to quickly see how a device is configured without opening a terminal session saves time.
Opening a terminal session, saving the configuration to a file, and attempting to download via SCP only to double-check if the configuration is right is time-consuming. Simply browsing to the last configuration for viewing in Auvik, simplifies this entire process.
Troubleshoot Issues with Debug
Routing tables, SNMP OID monitors, and hardware sensors are all crucial to understanding when a problem occurs. Navigate through the discovered device routes to understand the destinations and the next hop, instead of dumping routing tables on each device.
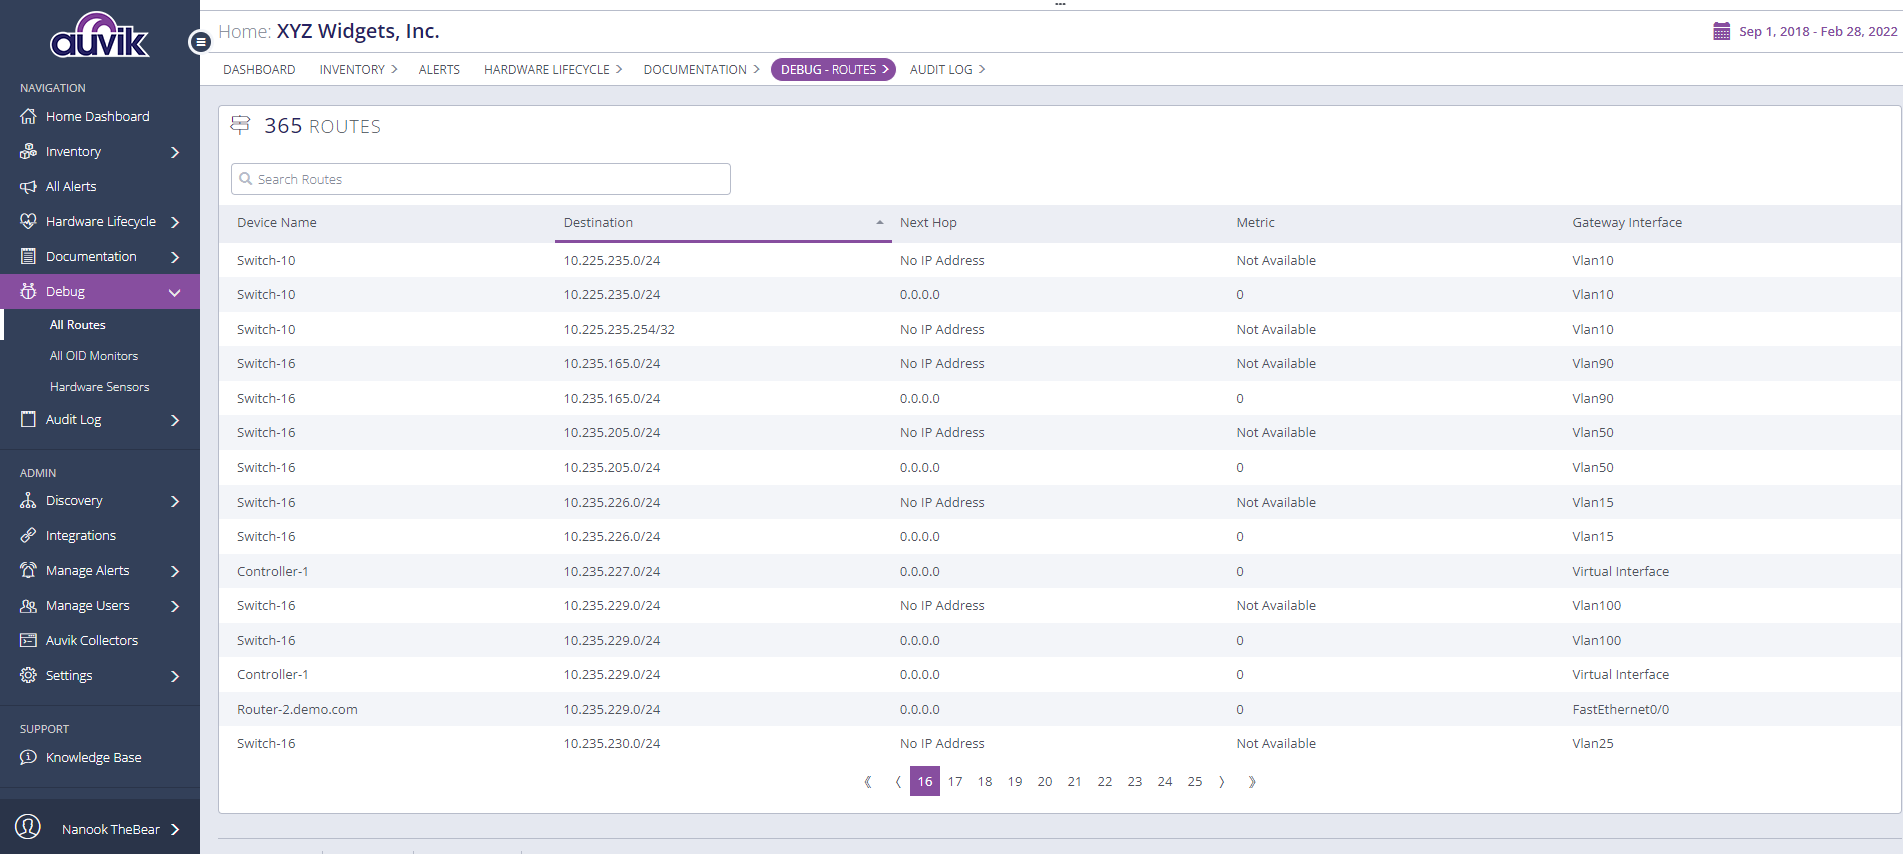
Dive into SNMP OID monitors and hardware sensors to get early warnings of issues, which tie directly into the alerting capabilities of Auvik. Taken together, you have a comprehensive view of your network and are able to take action early in the event of potential issues.
Stay Secure With User Administration and Audit Logging
With all of the threats, from phishing emails to lateral attacks, keeping your network management pane secure is crucial. As originally stated, Auvik offers mandatory two-factor on built-in Auvik accounts and secure integrations with Google, Microsoft, and other SAML-based authentication platforms.
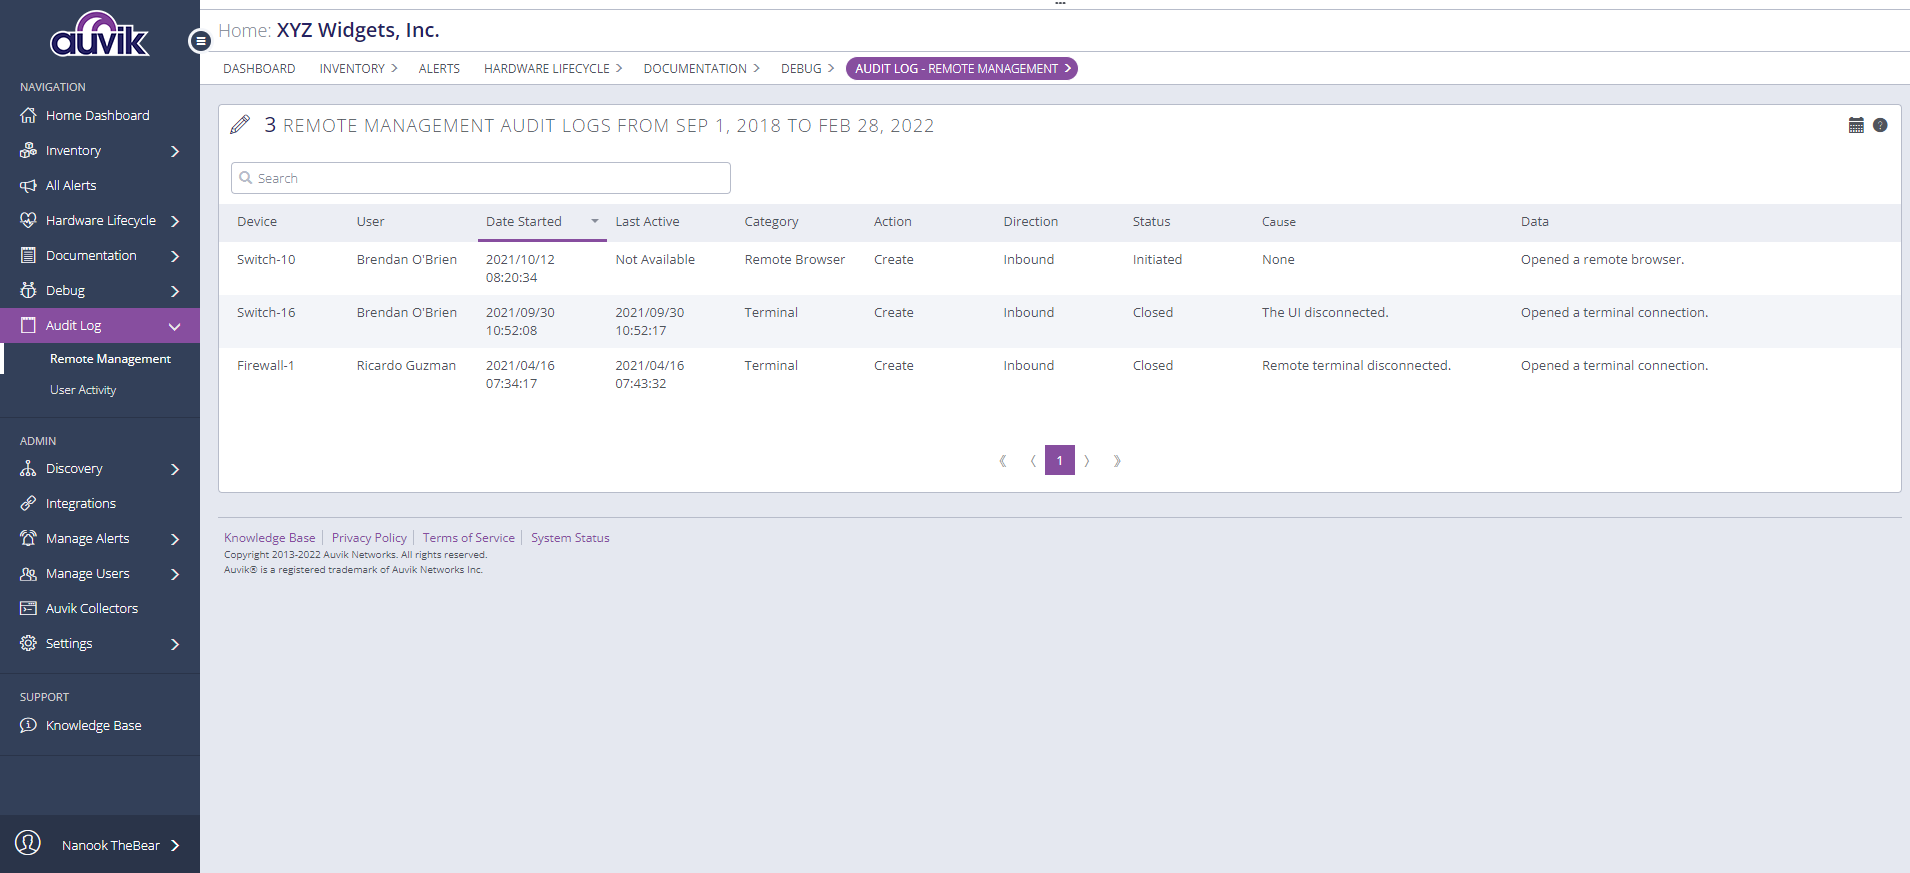
Auditing is just as important, and to that end, Auvik offers logging of both remote management activity and user activity.
Proactively Manage your Users and Roles
In the user management section, quickly see which users are in your organization, reset their 2FA and see if they have an API key attached (very useful for finding those “hidden” integrations). To add new users to a site, you must proactively invite users.
Invitations offer a positive control over who has access to the dashboard, but with a large organization, this can quickly become unwieldy. Ideally, integrating authentication and authorization based on groups provided from the authentication platform would make fast onboarding and offboarding.
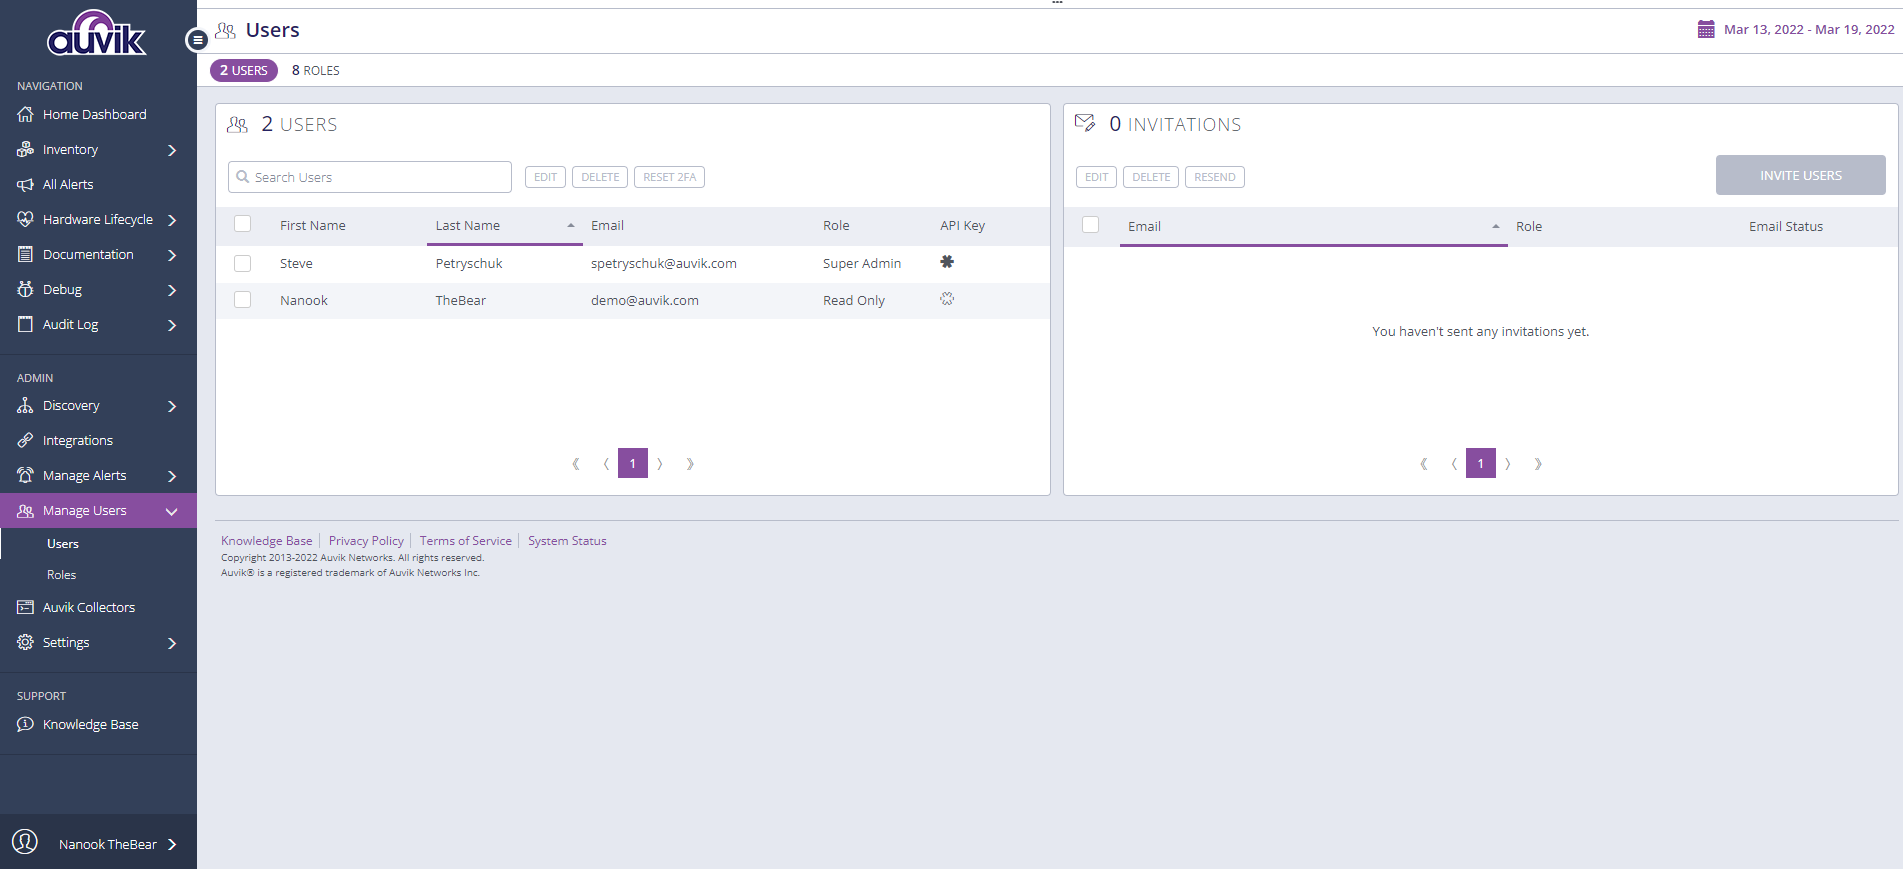
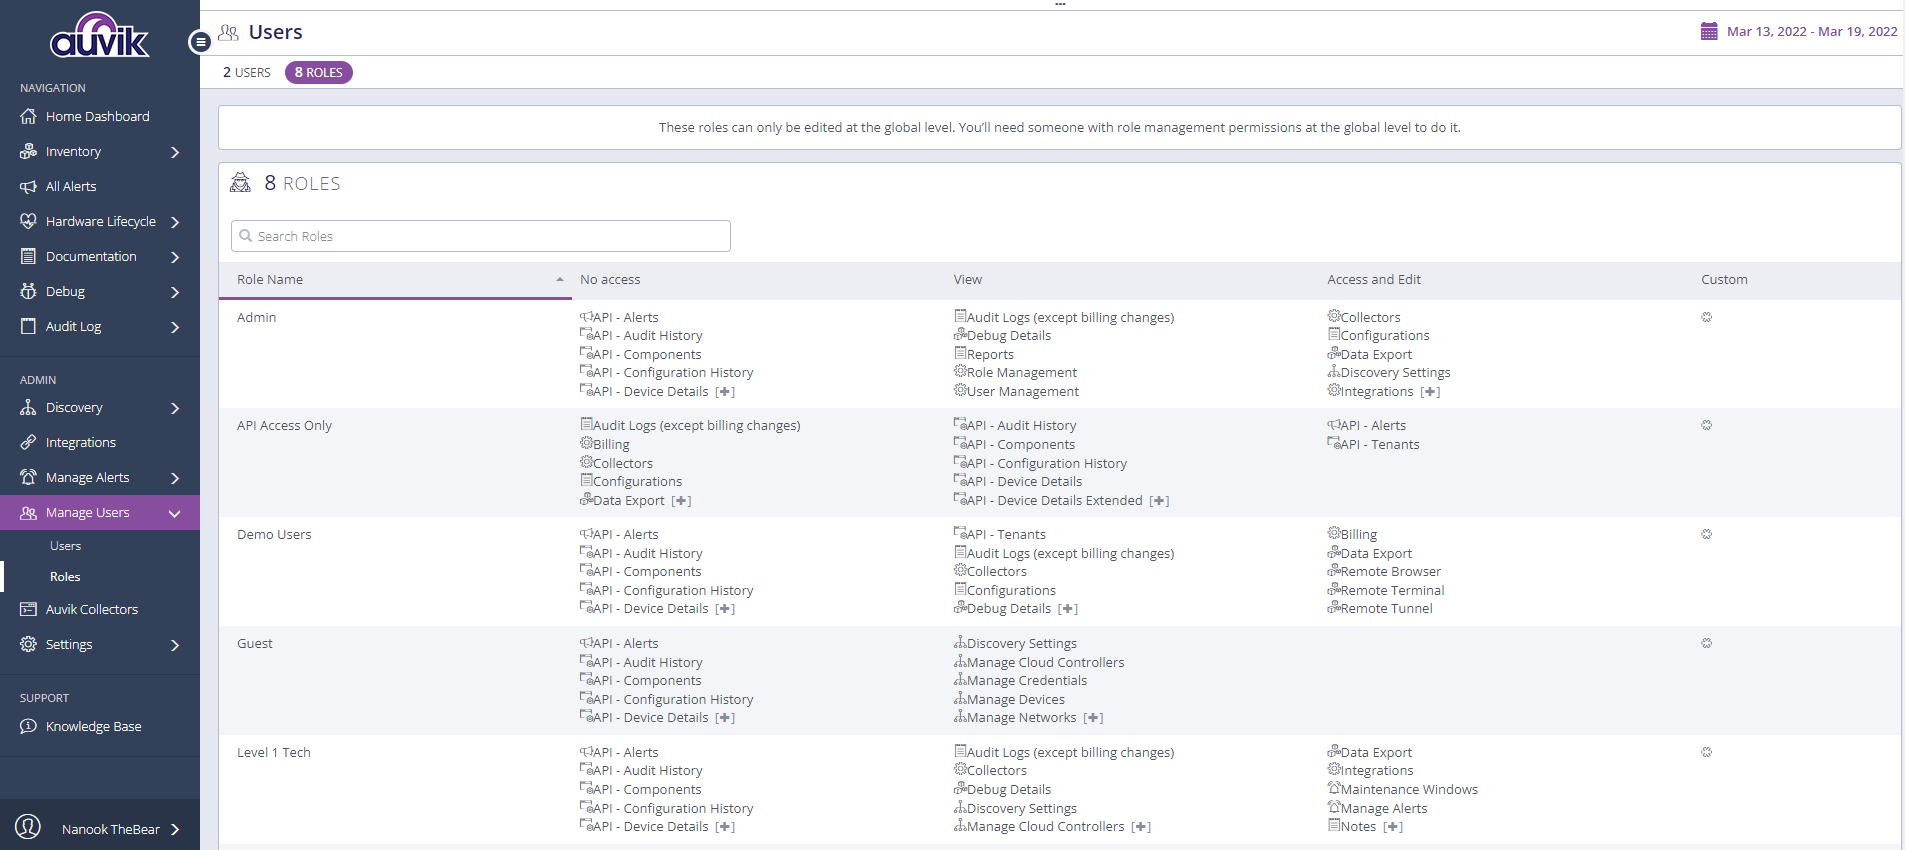
Role-based access is a must and Auvik offers a robust series of pre-defined roles with custom roles available as well. With custom roles, each access item has No Access, View, or Edit permissions. The only missing piece is the ability to tie permissions to a specific entity or series of entities.
Stay on Top of Users with Logging
Trust but verify is a typical refrain for IT administrators. Making sure that users are acting according to their roles is paramount to maintaining a secure infrastructure. Auditing provides the ability to see what remote sessions are opened and to see user activity in the Auvik platform.
Getting Connected with Auvik Administration
Any good tool requires robust administration, Auvik is no different. Architected to make discovering devices and collecting data robust, Auvik offers an administration experience that helps you get up and running quickly.
Finding Hidden Devices with Discovery
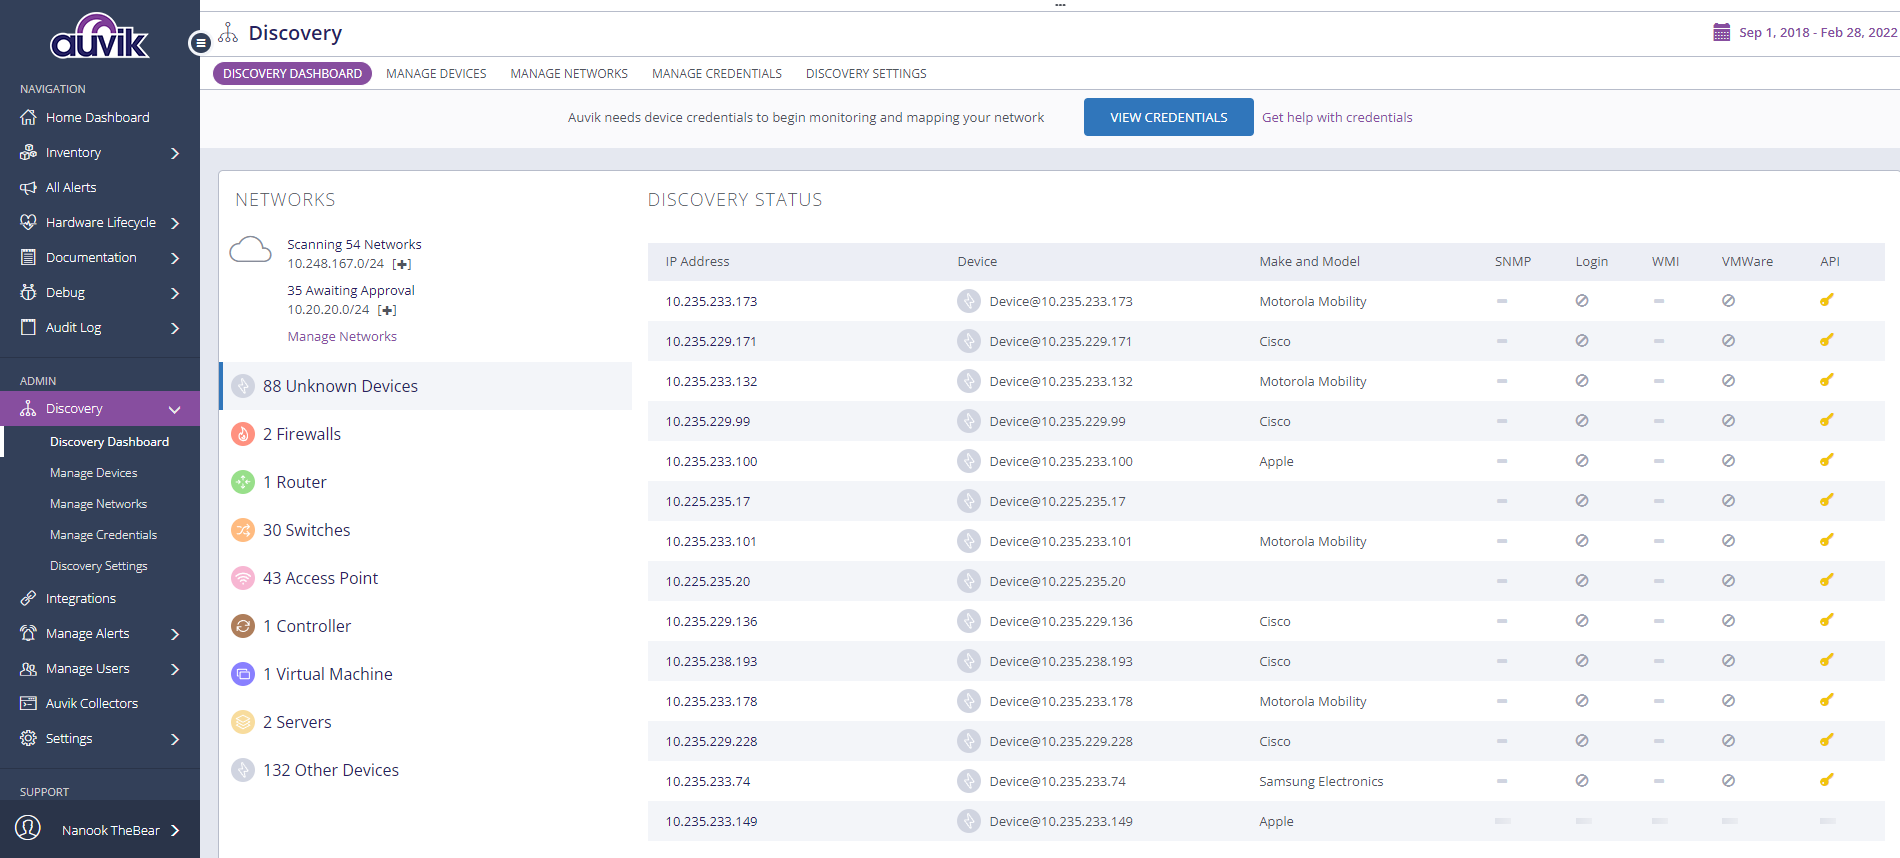
Provided the device is on the network Auvik can discover it. As shown below in this demo, there are 88 unknown devices. Those are 88 potential issues, but with Auvik you are able to track down and determine what they are and how to take positive control.
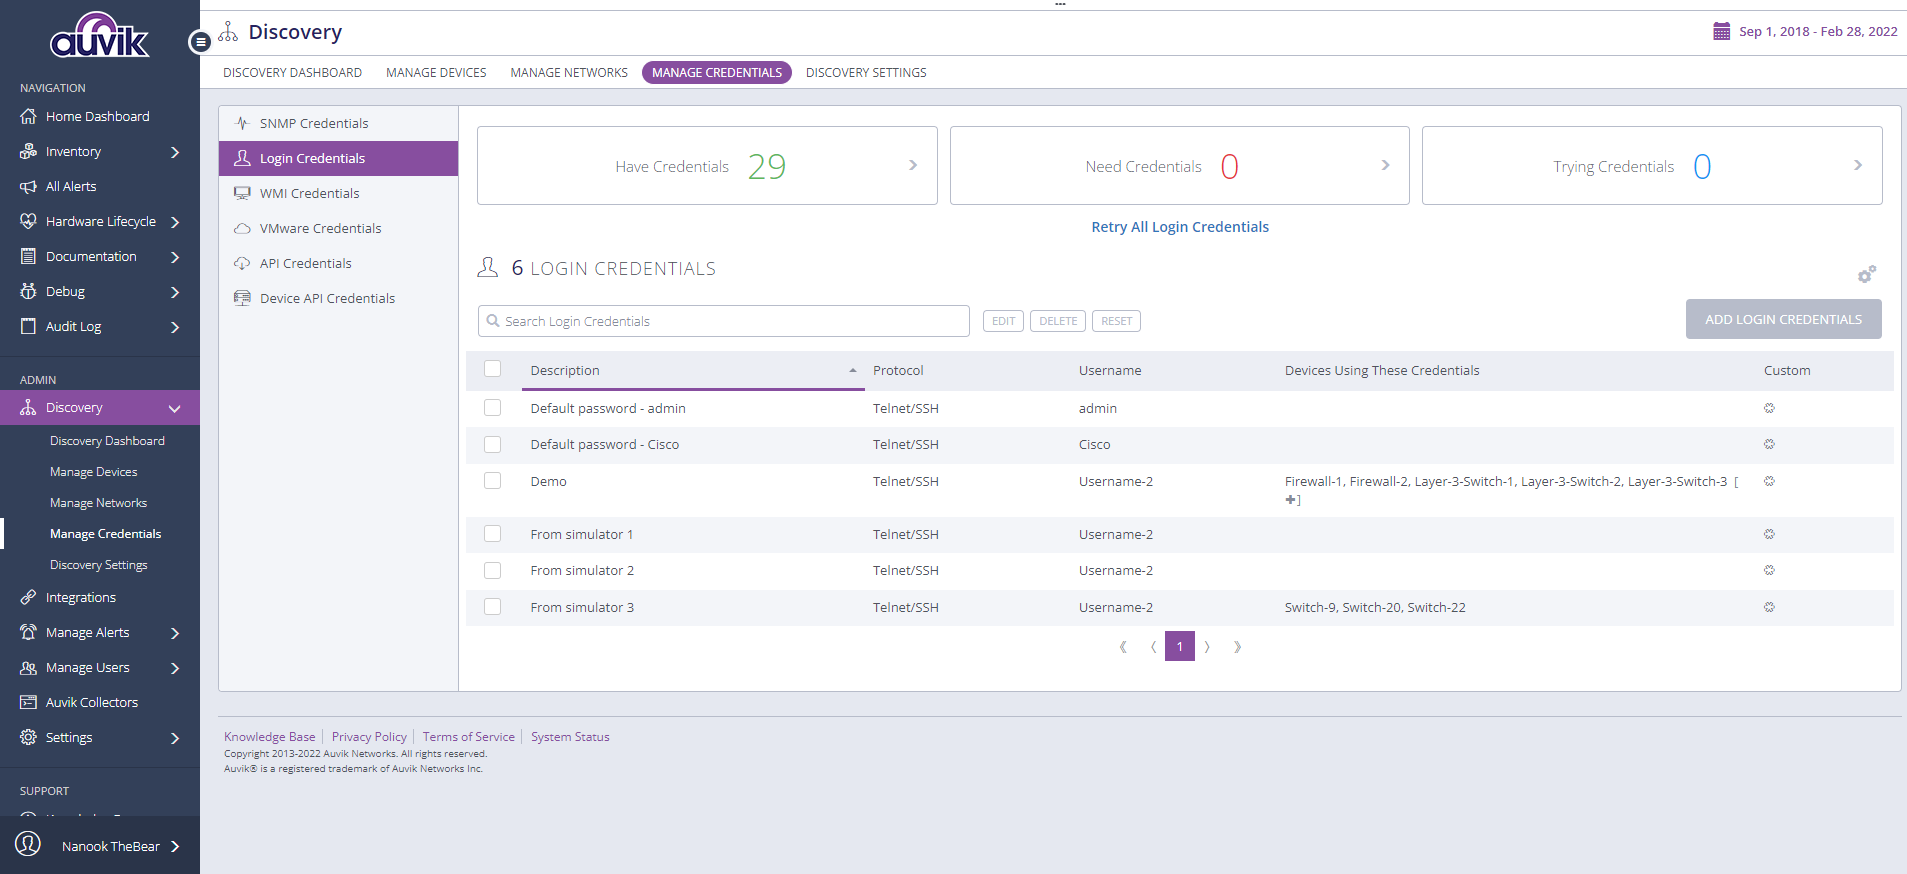
Providing all of the credentials to your devices, lets you connect and surface the information in the Auvik Dashboard. With so many different devices and credential types, Auvik groups those credentials into easy-to-understand sections and actionable information.
Gather your Data with Auvik Collectors
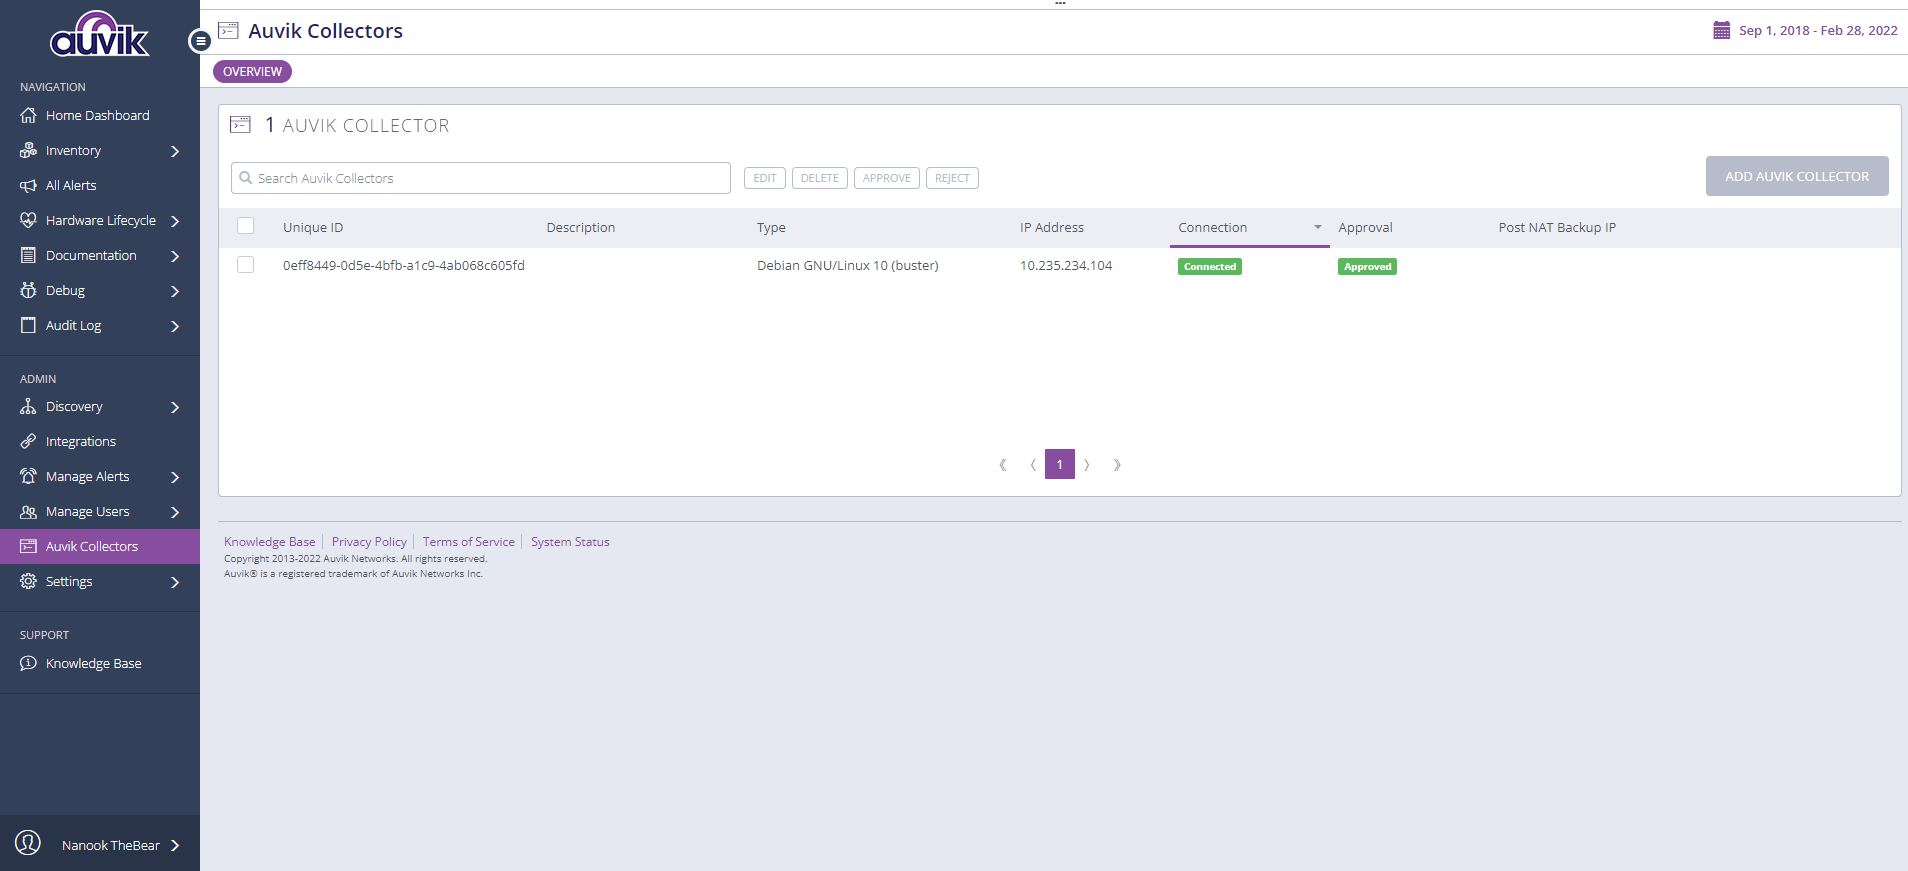
As Auvik is a cloud-based network management platform, you need to provide internal network visibility. To do this, you have a variety of ways to install a collector such as a Windows service, OVA image, or a Linux system. The collector receives the discovery and collecting details from Auvik and scans your network to discover and manage devices.
Connect with Integrations
Make management easier with third-party integrations. Auvik offers inventory, alerting, device monitoring, and incident management through a variety of integrations. Automatically add your inventory with ITBoost, create an incident with ServiceNow, and send the alert to PagerDuty. Take your network management to the next level with Auvik integrations.
A Word on Syslog and Traffic Insights
The demo implementation of Auvik did not offer Syslog integration or the TrafficInsights feature. Reading through the documentation on Auvik’s ability to pull in Syslog data, view the logs for a rolling 14 days on any connected device, and archive the data to external locations such as AWS S3 makes for an enticing feature. Further, you have the ability to define alerts based on the severity of a Syslog message.
TrafficInsights looks to be a great way for understanding what types of protocols and applications are actively in use on your network. With the geolocation abilities, discover if your network is accessed from unexpected locations.
The Verdict on Auvik
Auvik offers a comprehensive network management dashboard. With built-in reporting, alerting, lifecycle management, and debugging, the day-to-day life of a network administrator becomes easier. I found the product easy to navigate and information quick to find.
I would like to see more personalization options for the tables, such as better filters and quick actions, but most importantly the data is available. In the end, these are minor issues that will no doubt be addressed over time.
Auvik offers an excellent network management tool, especially if you are a Cisco device shop. As a network administrator, a single network dashboard simplifies management and saves time. No more opening a million terminal windows to track down one misbehaving device!
Check out a quick tour of Auvik products you may find interesting.
Conclusion
If you’re in the market for a better network management platform for your organization, look to Auvik. Take control with alerts, reports, and comprehensive documentation. Integrate with a variety of services, to truly empower your network administrators.
If you’d like to securely manage your network from a comprehensive dashboard, give Auvik a try today and learn if their pricing works for you!
