

If you’re deploying hundreds of containers within Kubernetes, how do you keep an eye on them all? A command-line interface won’t work. You need a visual representation of everything. Introducing Kubernetes dashboard.
Kubernetes Dashboard is the official web-based UI for Kubernetes user interface, consisting of a group of resources to simplify cluster management.
In this tutorial, you will learn how to install and set up the Kubernetes Dashboard step by step on an Ubuntu machine.
Prerequisites
This post will be a step-by-step tutorial. To follow along, be sure you have:
- Ubuntu 14.04.4 LTS or greater machine with Docker installed. This tutorial uses Ubuntu 18.04.5 LTS with Docker v19.03.8 and Public IP address 13.213.48.113
- A Kubernetes cluster.
Installing Kubernetes Dashboard
Before you can start to enjoy the benefits of the Kubernetes Dashboard, you must first install it, so let’s get into it. To install Kubernetes Dashboard, you’ll need the kubectl command-line interface tool. Kubectl is a command-line tool that manages a Kubernetes Dashboard installation and many other Kubernetes tasks.
Enough talk; let’s install the Kubernetes dashboard.
1. First, open your favorite SSH client and connect to your Kubernetes master node.
2. Next, install the Kubernetes dashboard by running the kubectl apply command as shown below. The kubectl apply command downloads the recommended.yaml file and invokes the instructions within to set up each component for the dashboard.
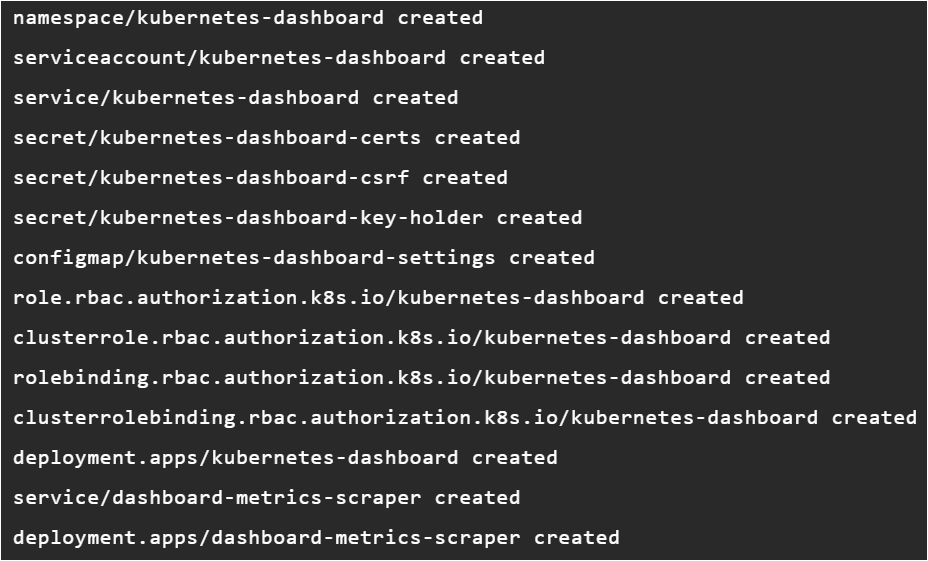
kubectl apply -f https://raw.githubusercontent.com/kubernetes/dashboard/v2.2.0/aio/deploy/recommended.yamlAfter executing the command, kubectl creates a namespace, service account, config map, pods, cluster role, service, RBAC, and deployments resources representing the Kubernetes dashboard.
- Namespace – Defines the Kubernetes cluster in particular virtual clusters on the physical clusters.
- Service account – Provides an identity for processes that run in a Pod.
- Config Map – An API object used to store non-confidential data in key-value pairs such as environment variables or command-line arguments.
- RBAC – Permissions to manage user roles in the dashboard.
- Service – A way to expose an application running with multiple sets of Pods.
- Deployments – Manages resources in the cluster.
- Pods – A pod is a group of one or more containers with shared storage and network resources and a specification for running the containers.
- Secrets – Stores sensitive information such as passwords, OAuth tokens, and SSH keys.
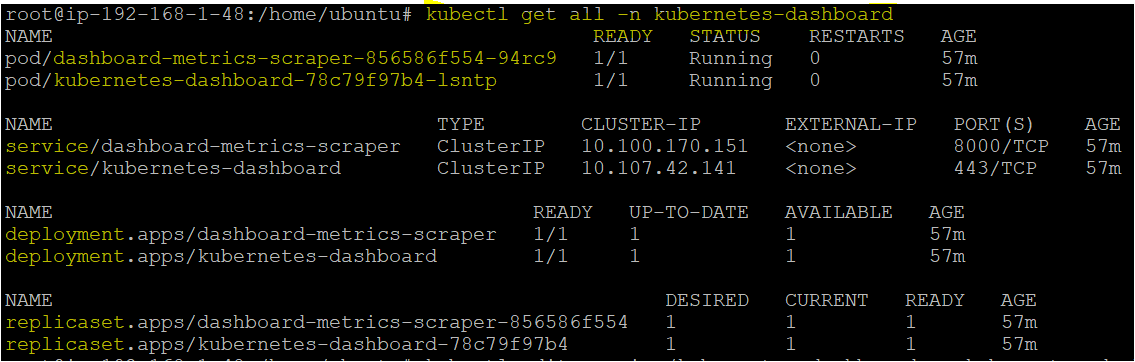
3. Now, verify all of the resources were installed successfully by running the kubectl get command. The command below fetches information about all resources on the cluster created in the kubernetes-dashboard (-n) namespace.
kubectl get all -n kubernetes-dashboardAs you see below, all the resources inside the Kubernetes dashboard, such as service, deployment, replica set, pods, are deployed successfully in the cluster.
Setting up the Kubernetes Dashboard
By now, you have a functional Kubernetes dashboard running, but it still requires a bit of configuration to be fully functional. You must now configure the dashboard to be available outside the cluster by exposing the dashboard service.
Assuming you are still connected to the Kubernetes machine through the SSH client:
1. Edit the Kubernetes dashboard service created in the previous section using the kubectl edit command, as shown below. Running the below command will open an editable service configuration file displaying the service configuration.
kubectl edit service/kubernetes-dashboard -n kubernetes-dashboard2. Once the file is opened, change the type of service from ClusterIP to NodePort and save the file as shown below. By default, the service is only available internally to the cluster (ClusterIP) but changing to NodePort exposes the service to the outside.
Setting the service type to
NodePortallows all IPs (inside or outside of) the cluster to access the service.
In the below code snippet, the Kubernetes dashboard service is listening on TCP port 443 and maps TCP port 8443 from port 443 to the dashboard pod port TCP/8443.
# Updated the type to NodePort in the service.
 ports:
 port: 443
 protocol: TCP
 targetPort: 8443
 selector:
 k8s-app: kubernetes-dashboard
 sessionAffinity: None
 type: NodePort
3. Find the name of each pod that step two in the previous section created using the kubectl get pods command enumerating all pods across all namespaces with the --all-namespaces parameter.
You should see a pod that starts with kubernetes-dashboard.
kubectl get pods --all-namespaces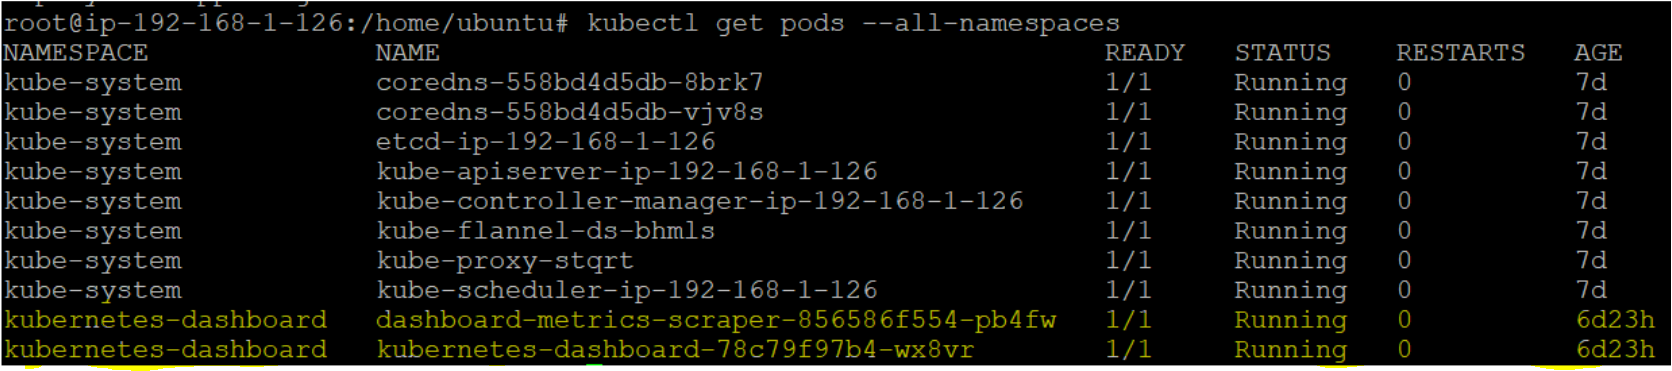
kubectl get pods command4. Next, delete the Kubernetes dashboard pod using the name found in step three using the kubectl delete command. For this tutorial, the name of the pod is kubernetes-dashboard-78c79f97b4-gjr2l.
Whenever you modify the service type, you must delete the pod. Once deleted, Kubernetes will create a new one for you with the updated service type to access the entire network.
kubectl delete pod kubernetes-dashboard-78c79f97b4-gjr2l -n kubernetes-dashboard5. Verify the kubernetes-dashboard service has the correct type by running the kubectl get svc --all-namespace command. You will now notice that the service type has changed to NodePort, and the service exposes the pod’s internal TCP port 30265 using the outside TCP port of 443.
kubectl get svc --all-namespaces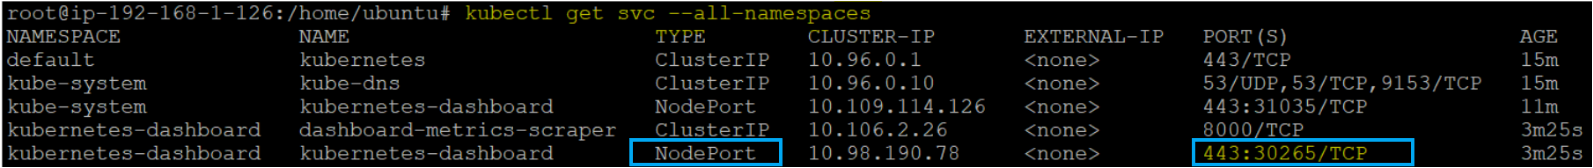
6. Now, create a service account using kubectl create serviceaccount in the kubernetes-dashboard namespace. You’ll need this service account to authenticate any process or application inside a container that resides within the pod.
kubectl create serviceaccount dashboard -n kubernetes-dashboardWhen you create a service account, a service account token also gets generated; this token is stored as a secret object.
7. Fetch the service token secret by running the kubectl get secret command. You’ll use this token to access the dashboard in the next section.
kubectl get secret $(kubectl get serviceaccount dashboard -o jsonpath="{.secrets[0].name}") -o jsonpath="{.data.token}" | base64 --decode
8. Create the clusterrolebinding rule using the kubectl create clusterrolebinding command assigning the cluster-admin role to the previously-created service account to have full access across the entire cluster.
kubectl create clusterrolebinding dashboard-admin -n kubernetes-dashboard --clusterrole=cluster-admin --serviceaccount=default:dashboardAccessing the Kubernetes Dashboard
Now that you’ve installed and set up the Kubernetes dashboard, the only thing left to do is enjoy its functionality!
Open your favorite browser and navigate to https://kuberntes-master-node:NodePort/#/login to access the Kubernetes dashboard.
The Kubernetes master node is the host you’ve installed the dashboard onto, while the node port is the node port found in step five of the previous section.
The main Kubernetes Dashboard page requires you to authenticate either via a valid bearer token or with a pre-existing kubeconfig file. For this tutorial, you’ll be using the token generated in the previous section to access the Kubernetes dashboard.
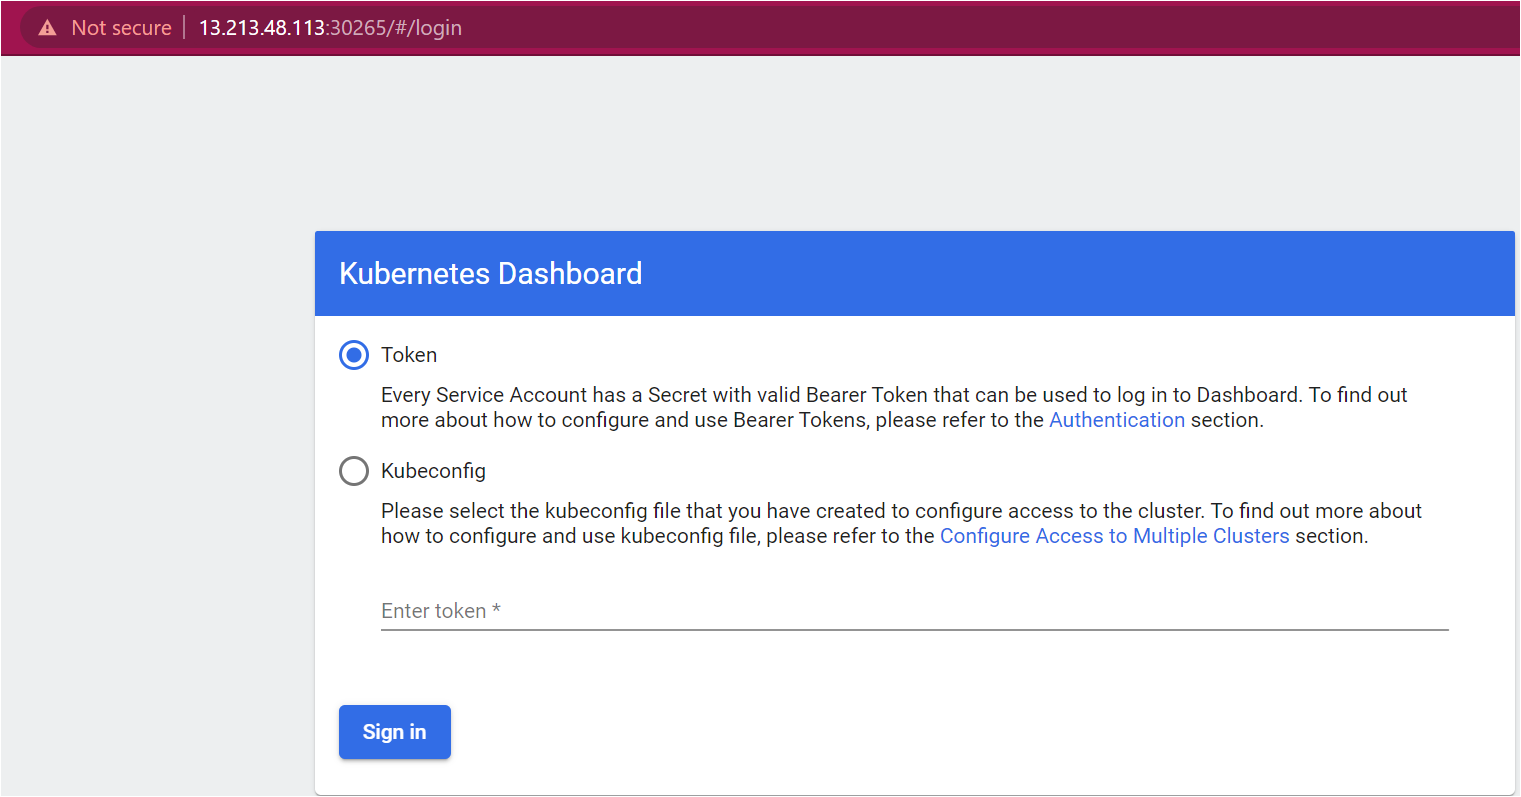
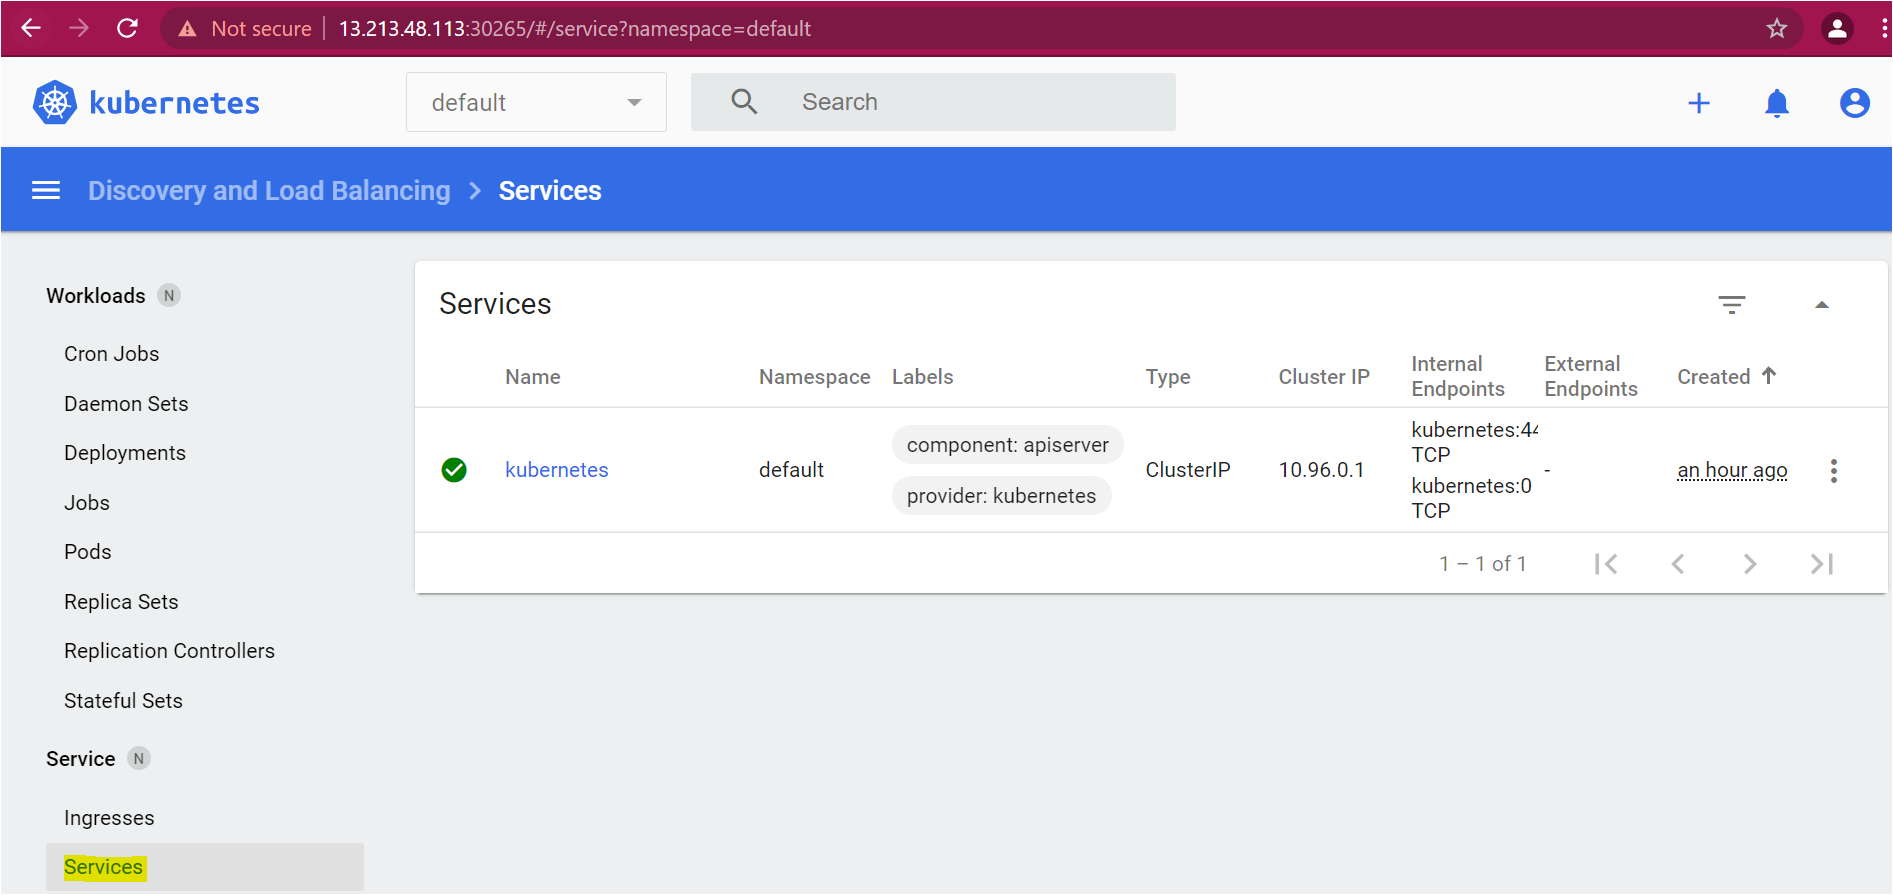
Ensure you have selected Token and provide the secret token obtained from step seven in the previous section. If all goes well, the dashboard should authenticate you and present to you the Services page.
Ensuring Resources Show up in the Dashboard
Your Kubernetes dashboard is now installed and working. Great! But, as one final task, let’s create a simple deployment with the dashboard to ensure it’s working as expected.
Let’s come up with a basic example like adding an NGINX service to the cluster via the dashboard and hope it all goes well!
Assuming you are already logged into the Kubernetes dashboard:
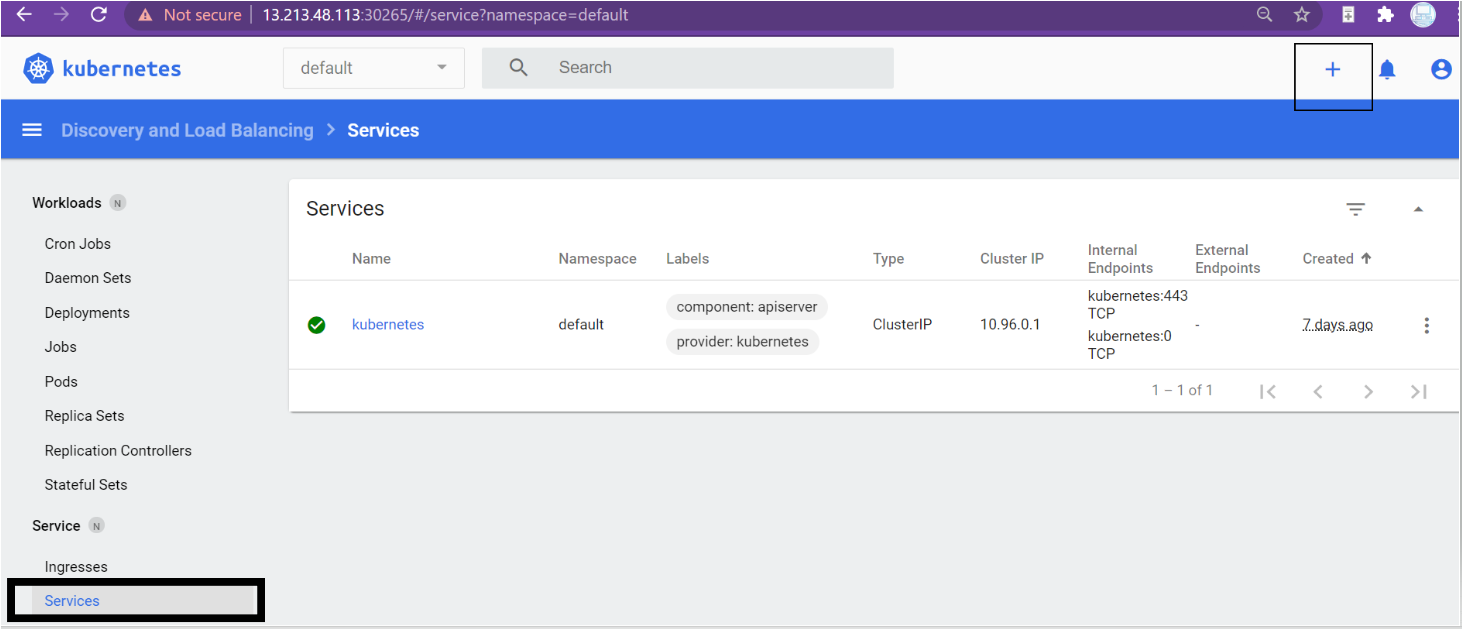
Click on the Services option from the Service menu. You’ll see each service running on the cluster. Next, click on the add button (plus sign) on the top right-hand corner, as shown below.
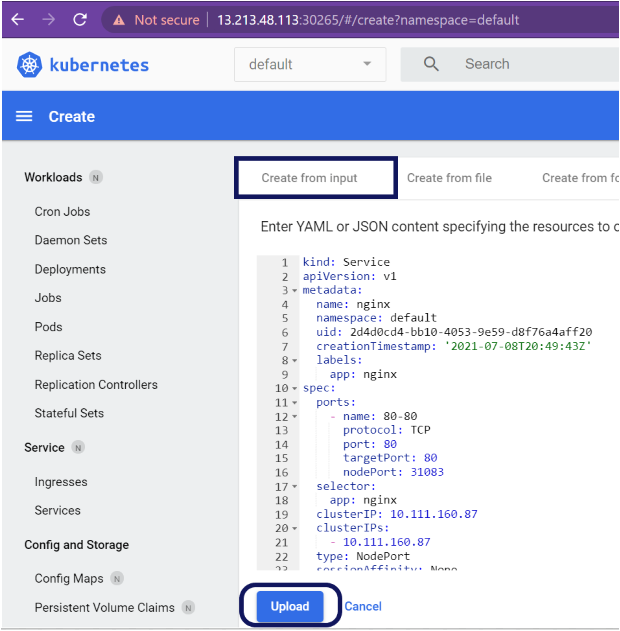
Copy and paste the below content into the Create from Input tab and click on the upload button to send the service configuration to the cluster.
kind: Service
apiVersion: v1
metadata:
  name: NGINX
  namespace: default
  labels:
    app: NGINX
spec:
  ports:
    - name: 80-80
      protocol: TCP
      port: 80
      targetPort: 80
      nodePort: 31083
  selector:
    app: nginx
  clusterIP: 10.111.160.87
  clusterIPs:
    - 10.111.160.87
  type: NodePort
  sessionAffinity: None
  externalTrafficPolicy: Cluster
  ipFamilies:
    - IPv4
  ipFamilyPolicy: SingleStack
status:
  loadBalancer: {}
If all goes well, the dashboard should then display the nginx service on the Services page!
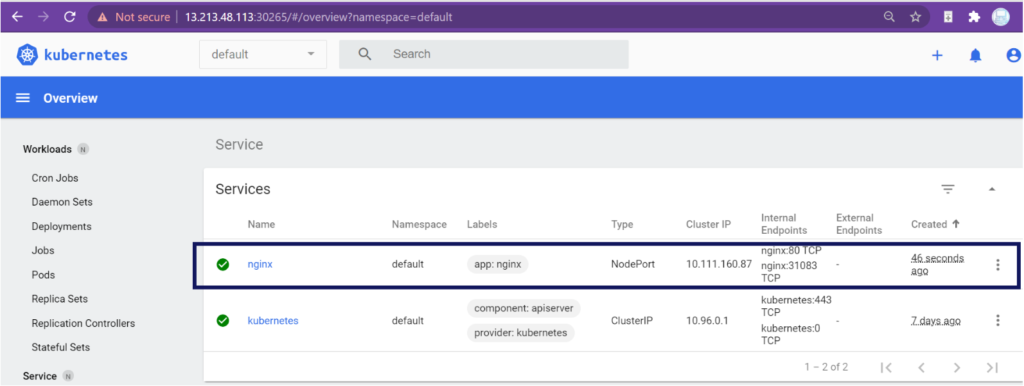
NGINX service is deployed on the Kubernetes dashboard.
Conclusion
You should now know how to deploy and access the Kubernetes dashboard. The Kubernetes dashboard is a visual way to manage all of your cluster resources without dropping down to the command line.
Now that you have a Kubernetes dashboard set up, what applications will you deploy next to it?


