
Welcome back to ATA’s Learn with Me series on the 1E Tachyon Platform for Unified Experience Management! If you missed the previous posts, be sure to catch up here.
In this installment, we’re going to focus on Tachyon’s Explorer application. Explorer is your real-time window to your endpoints. It allows you to investigate, remediate issues and manage operations across your entire endpoint landscape.
Explorer is like a Google query for your endpoint environment. It allows you to type in a question to instruct Tachyon to reach out to your endpoints and gather various data. Instead of “Feeling lucky?”, Explorer gives you “I want to know”.

If you need a Google for your endpoints, stay tuned!
Horror Stories from the Past
When I was an SCCM admin, one of the most frequent tasks I was blessed (cursed?) with was fielding requests from application analysts. These analysts were responsible for dozens of specific systems in a hospital which typically included some kind of client application.
As one of the “SCCM guys”, it was my duty to ensure the software client for all of these systems was working as expected. Seemingly weekly, analysts would stroll into my office and ask for ad-hoc reports and queries. They’d need information like:
- What machines were their clients installed on
- What were the performance specs of those machines
- Who was logging into those machines
The reasons for these requests varied but typically they had done poor planning and needed some information ASAP. It was then up to me to fire up the SCCM console and run a report for them. This event would then typically either take too long or, in the end, they’d find out the inventory wasn’t accurate.
When upgrade time came, we’d push out their upgraded clients via SCCM and would find that we missed some devices or deployed upgrades to devices that couldn’t support the upgrade.
I still have flashbacks about my time as an SCCM admin.
“OK Explorer, what do my endpoints look like?”
The main reason client deployments didn’t go well was commonly caused by outdated and missed information in SCCM. Other than creating a PowerShell script and querying thousands of endpoints, I didn’t have a method to quickly (and accurately) query endpoint state. I didn’t have a ‘Google’ for my endpoints.
Take a look at the GIF below. I would have had a natural language interface like this I could just write up a quick query and get real-time system information, it would have made my life a lot easier. What you see below is Tachyon’s Explorer application.


The Explorer application is a way to identify endpoint information to get a glance of the landscape like I wanted to or to troubleshoot and remediate endpoint issues.
Explorer reminds me of using the Google Home phrase, “OK Google” to ask random questions and expect quick, accurate responses.
Managing Endpoint Inventory
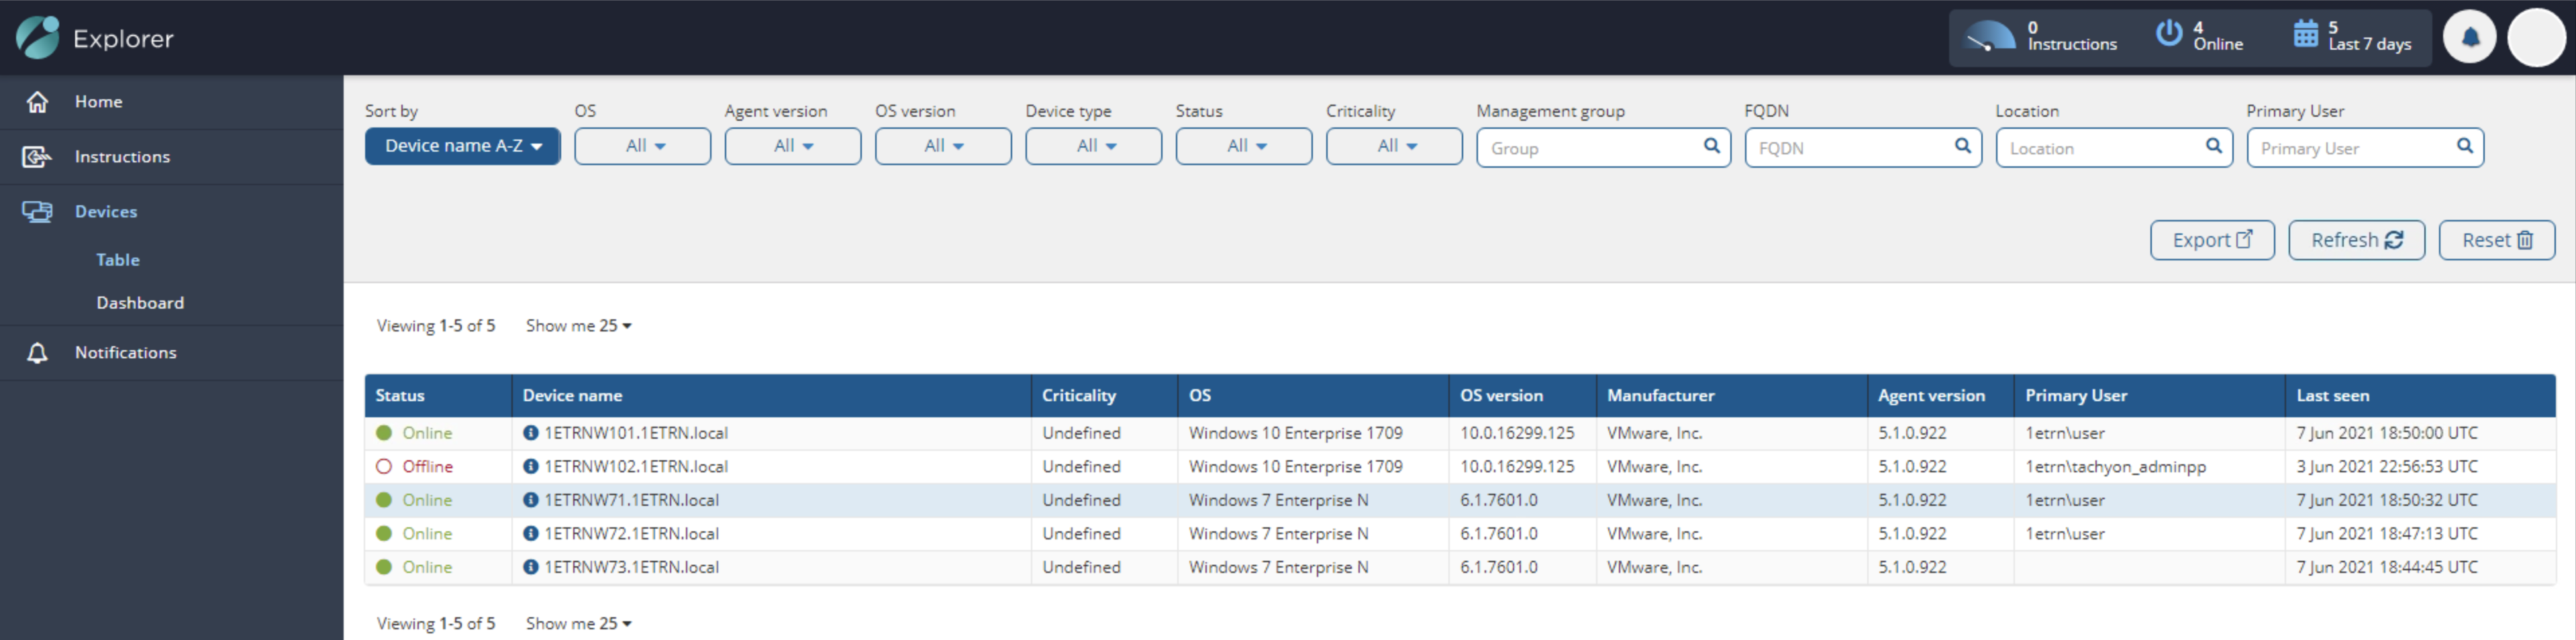
When you deploy 1E agents to your endpoints, you’ll see them start to pop up within the Explorer Devices section. There’s not much to cover here. This view is your typical all-devices view showing each client, its status, and some high-level information about the endpoints.
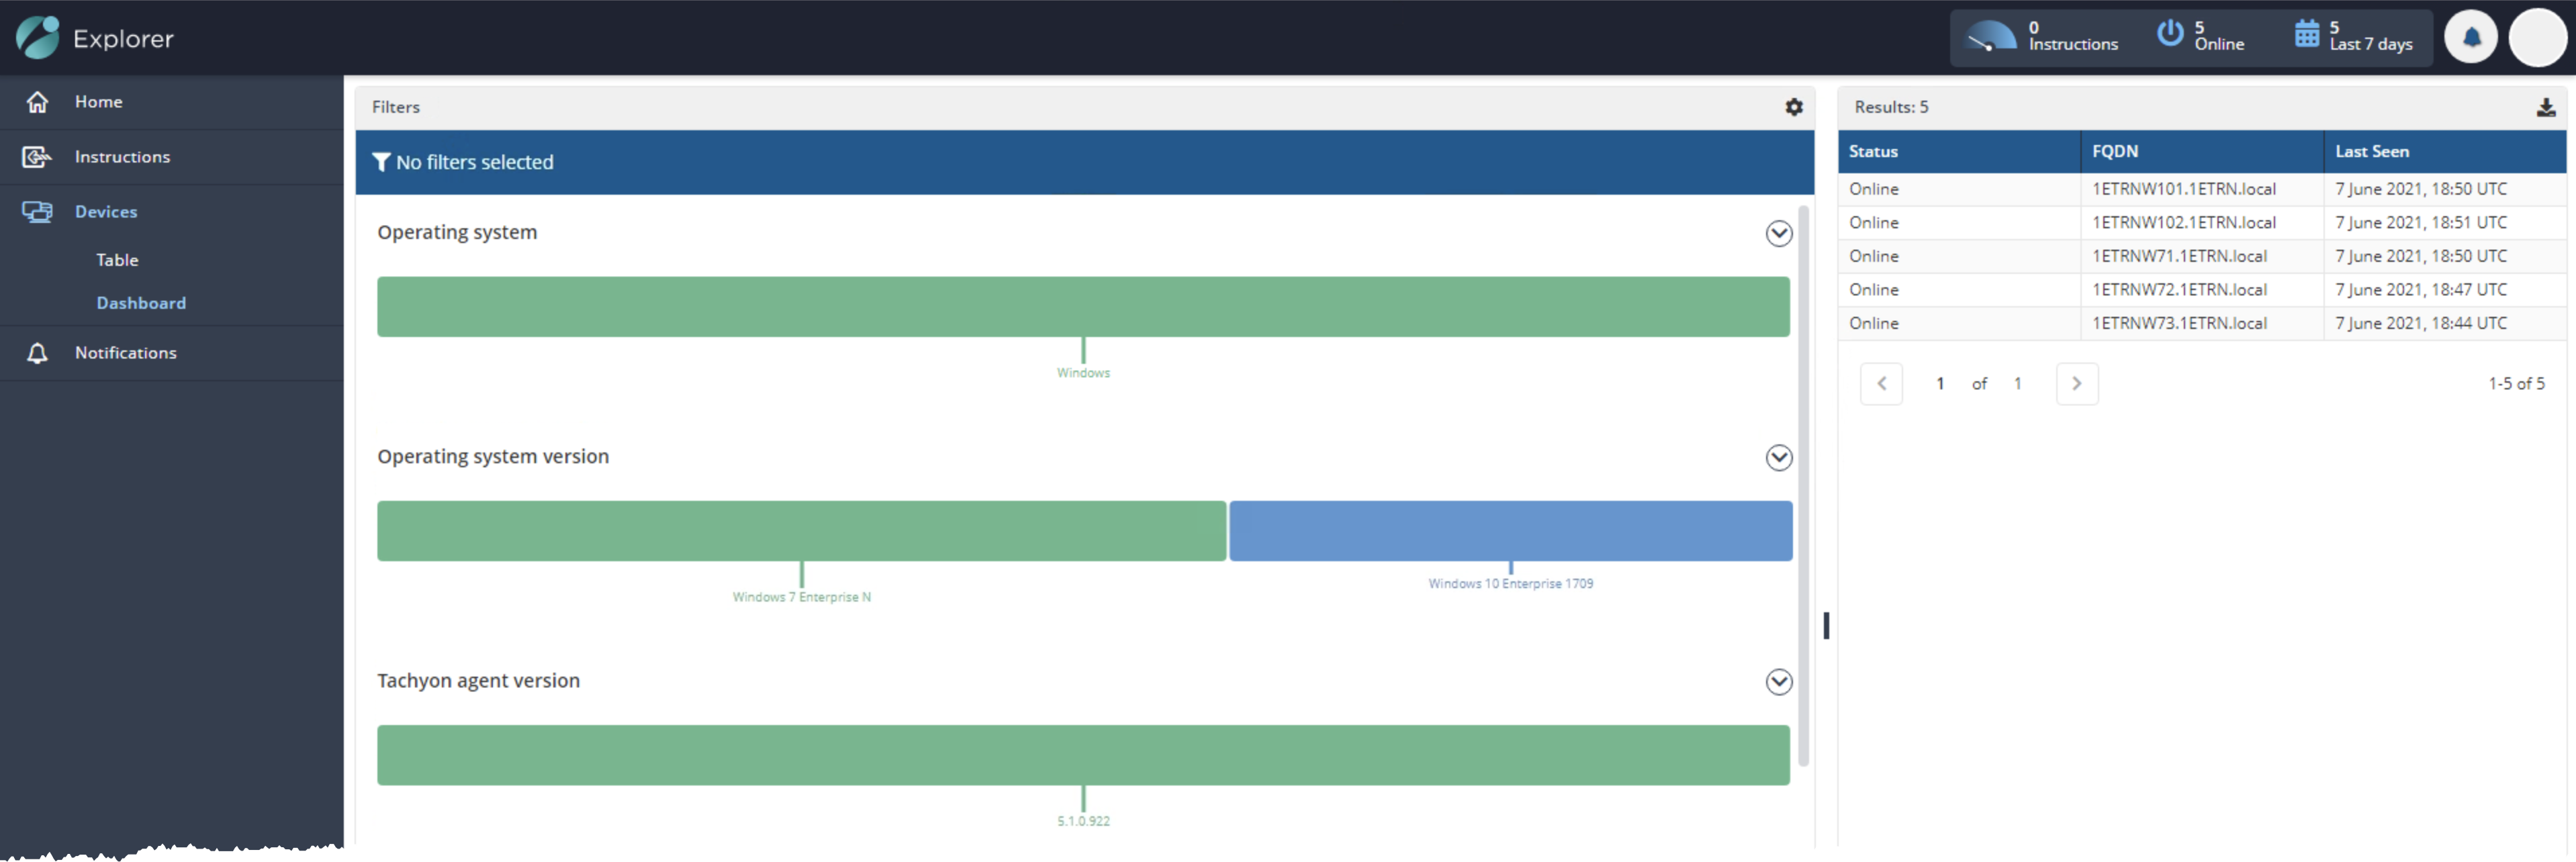
Explorer does also offer a Dashboard view of devices, as shown below. From what I’ve seen, it’s not extremely advanced and didn’t really wow me but serves the purpose well enough.
Instructions and Tasks
As you’ve seen in the previous screenshots, Explorer is all about search. Explorer allows you to quickly perform a search across all of your endpoints based on just about any kind of query and return responses to that query.
You don’t have to query all endpoints at once. Explorer has a Coverage option that allows you to define what endpoints are queried based on the query.
From Product Packs to Instructions
Explorer accepts queries and delivers responses to questions via a somewhat complex hierarchy of entities.
- Instructions and Instruction Sets
- Tasks
- Task Groups
- Product Packs
In Explorer, every question you ask is defined as an instruction in a task. A task is a question or action that, when invoked, instructs Tachyon to invoke an instruction in an instruction set some query on endpoints.
Tasks aren’t standalone. Every task is made part of a task group. Think of a task as the query you input and a task group as a logical grouping of like tasks e.g. the 1E Tachyon agent being part of a larger Applications group.
Task groups are then grouped into product packs like the ones you can download on the Tachyon Exchange. A product pack is a logical grouping of scripts and logic like Bitlocker, Windows endpoint performance, GDPR, etc.
If this hierarchy sounds confusing to you, it was to me. In summary, you can think of each component within Explorer like below:
Instructions —> Tasks/Questions —> Task Groups —> Product Packs
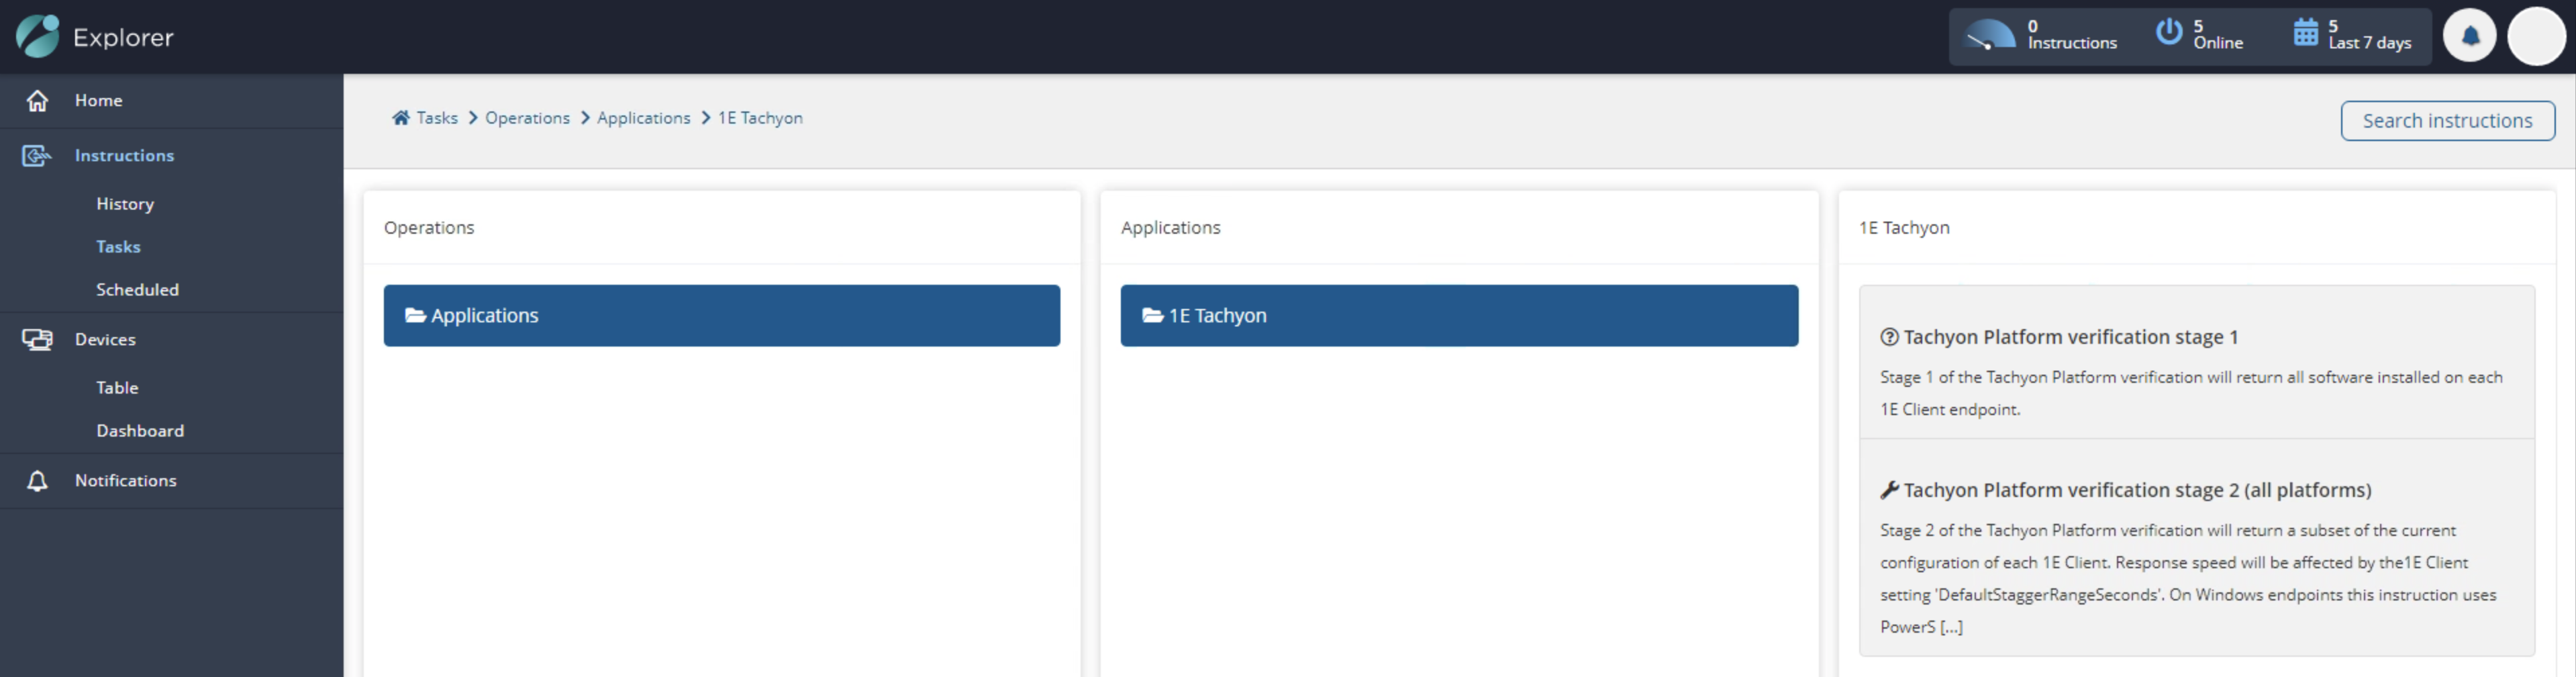
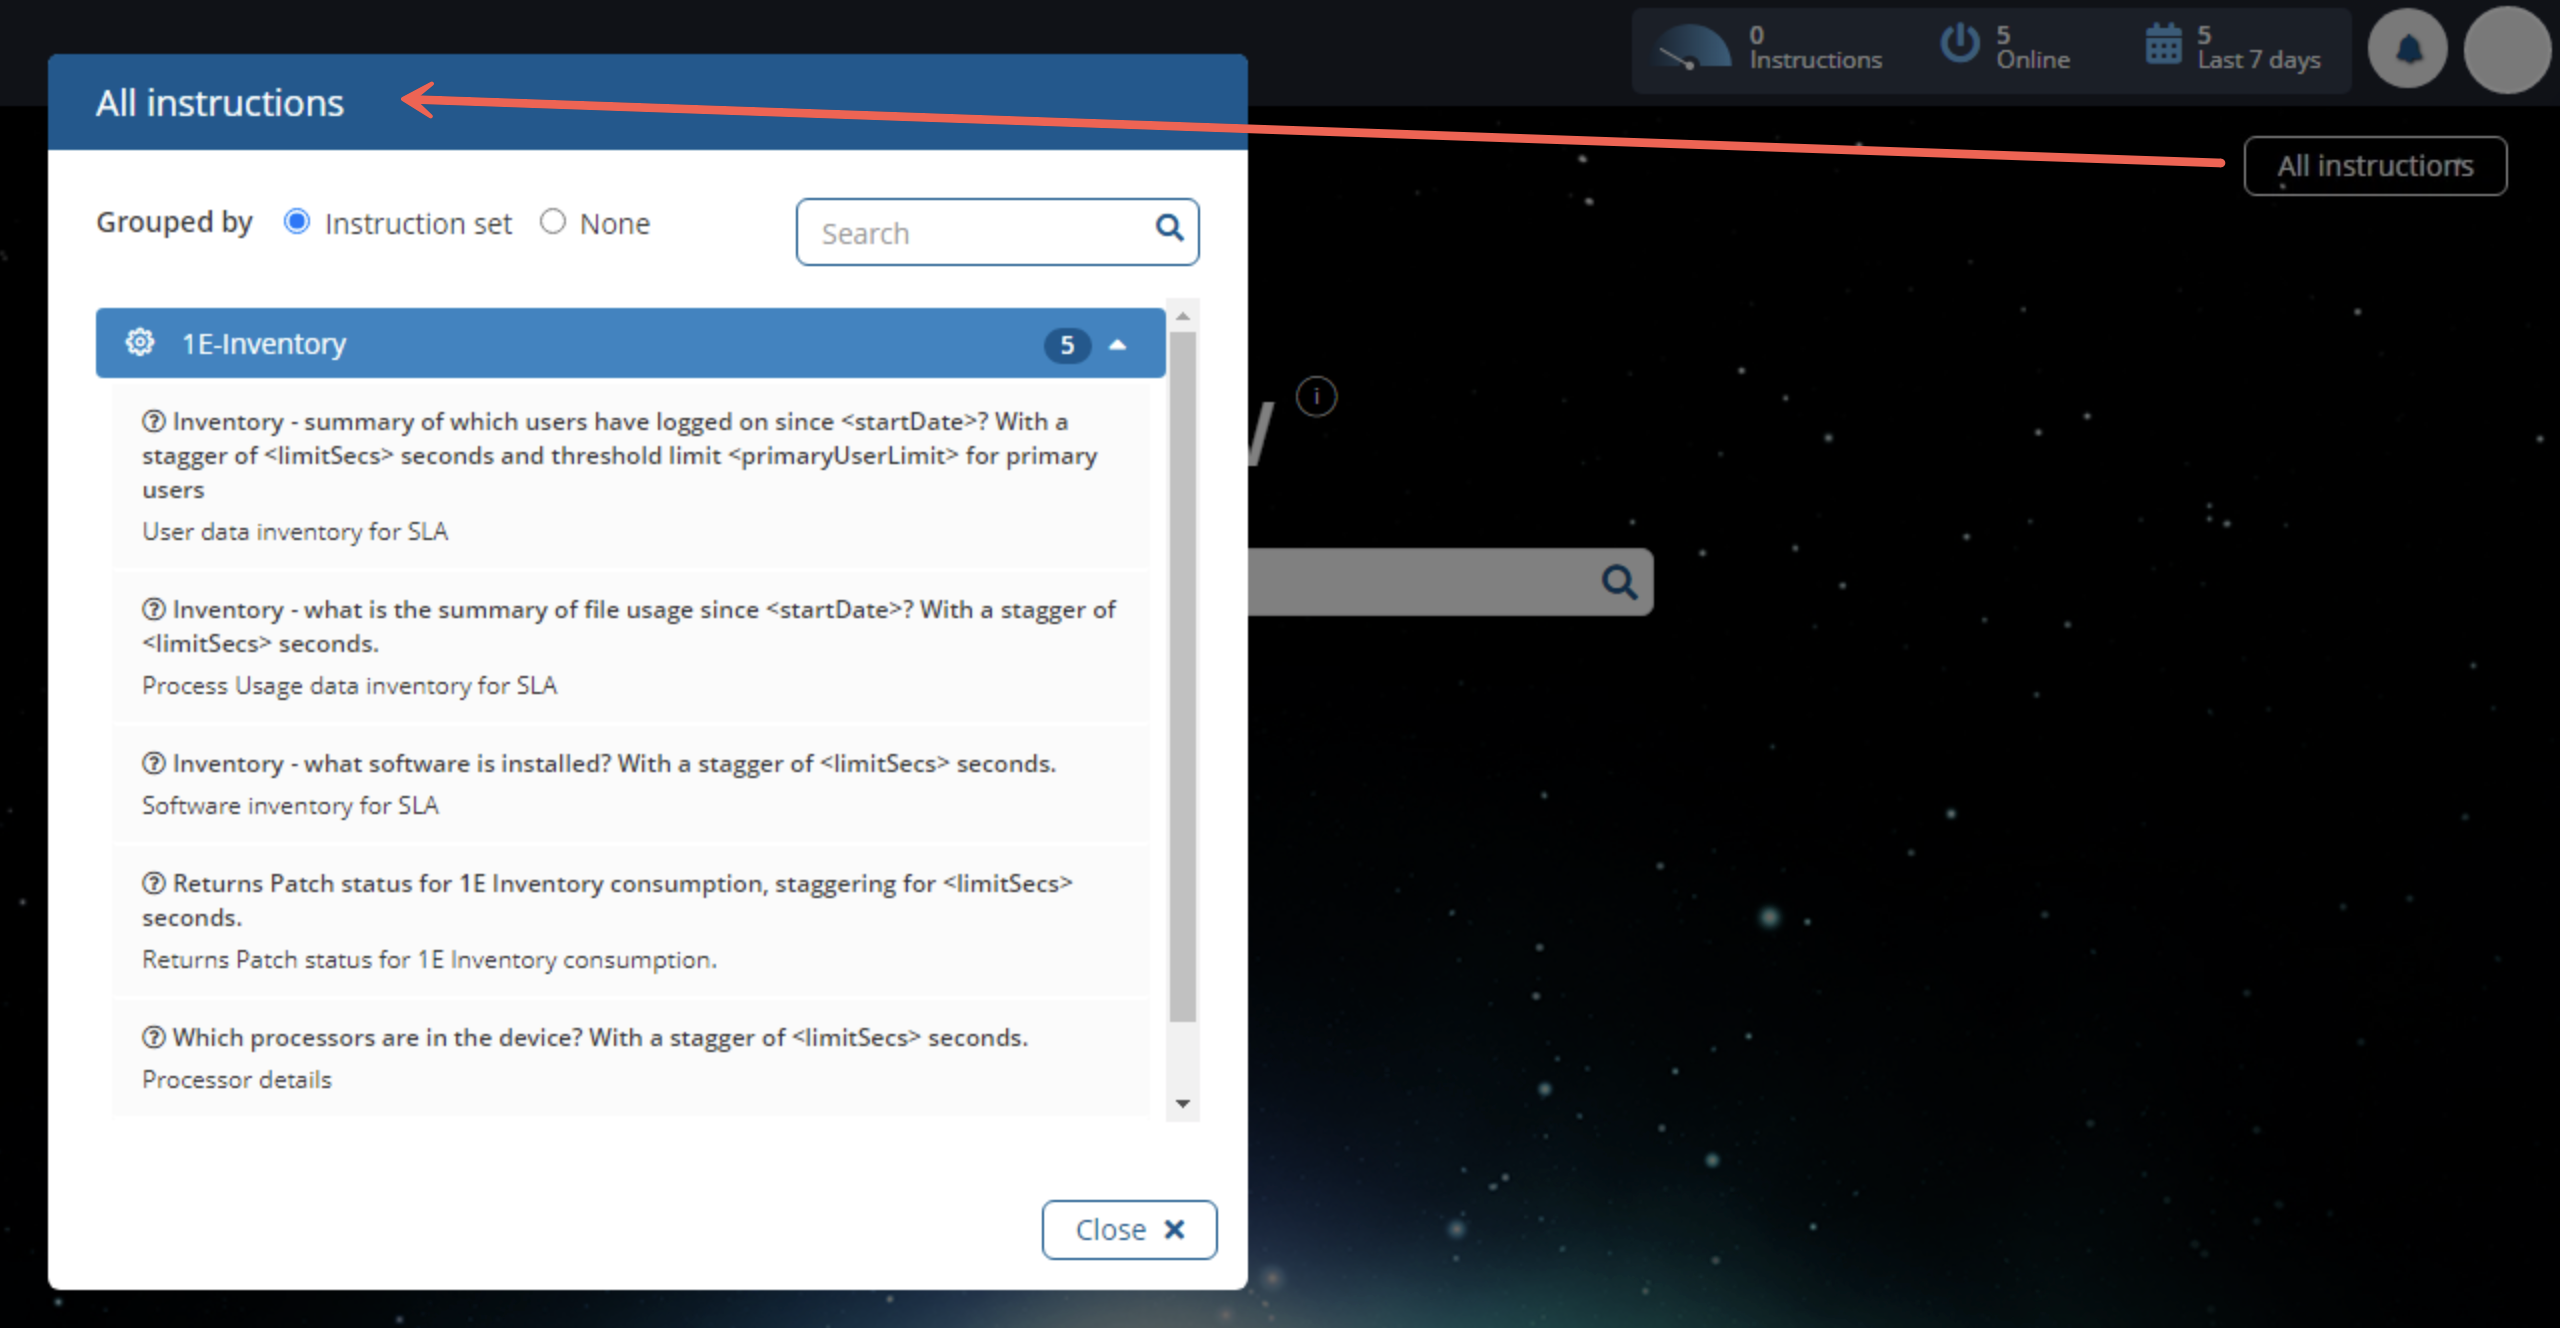
You can find all of the installed instructions by clicking on the All instructions button, as shown below.
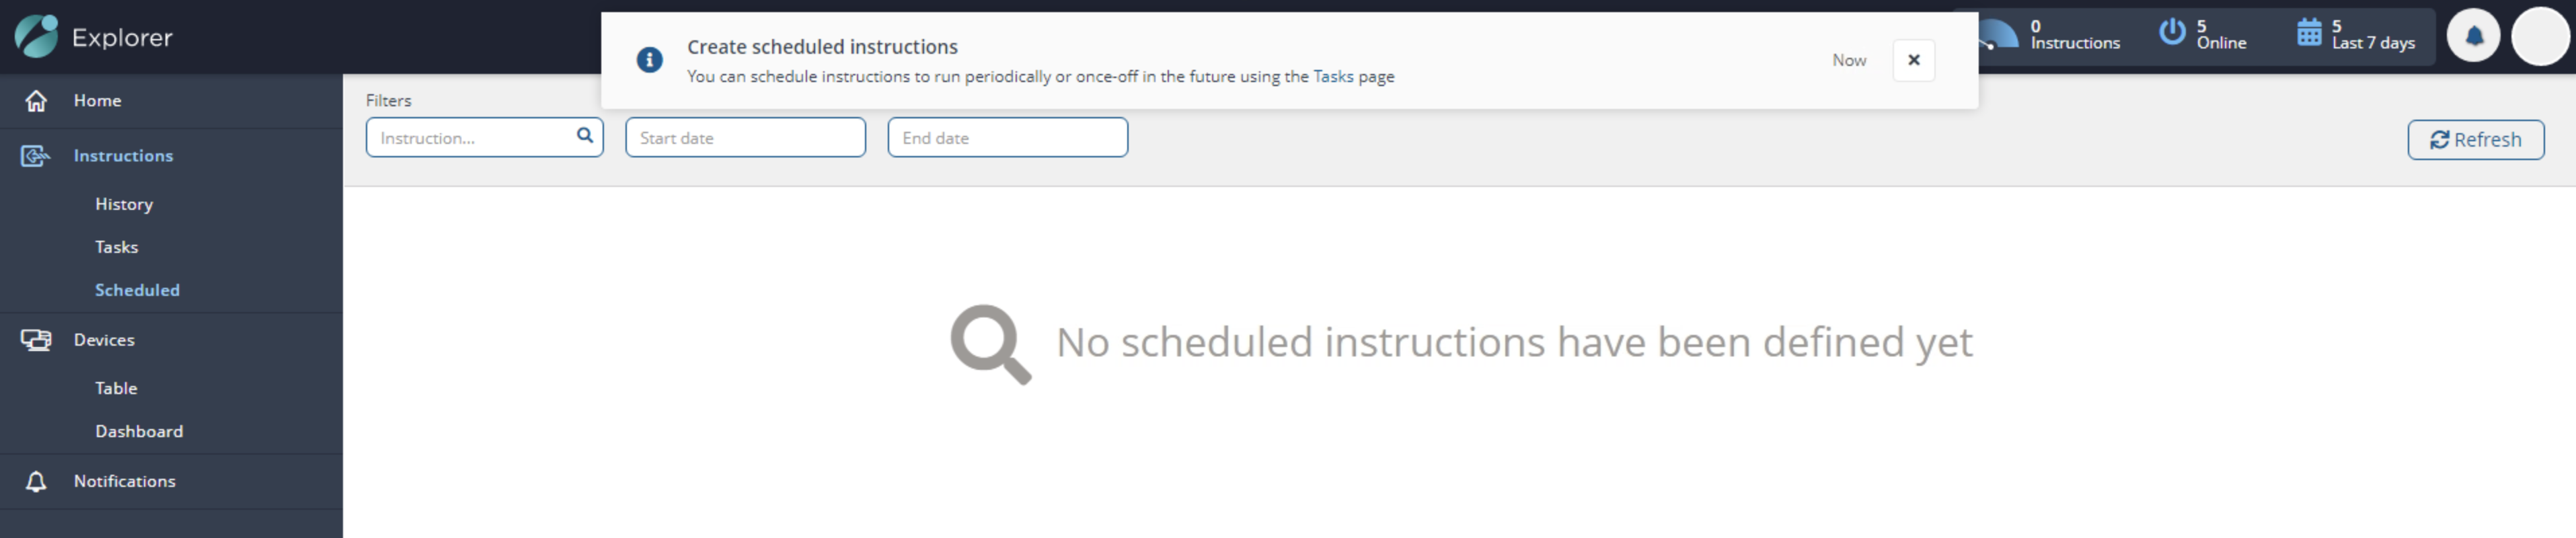
Scheduled Instructions
Typically in Explorer, you’ll invoke an instruction with a query. Like querying all endpoints for installed software and performances like I wanted to years ago! But, you can also invoke instructions on a schedule. Think scheduled tasks.
Perhaps you’d like to schedule an instruction to run every week that queries all endpoints and caches the response. Even though Tachyon supports querying hundreds of thousands of clients in real-time, you’ll rarely find a time when you catch them all online.
Maybe you’d like Tachyon to “listen” for new endpoints coming online and to query them before they disappear again (more on this neat feature in the next section). You could create a scheduled instruction to query endpoints at a certain interval to ensure you catch them all.
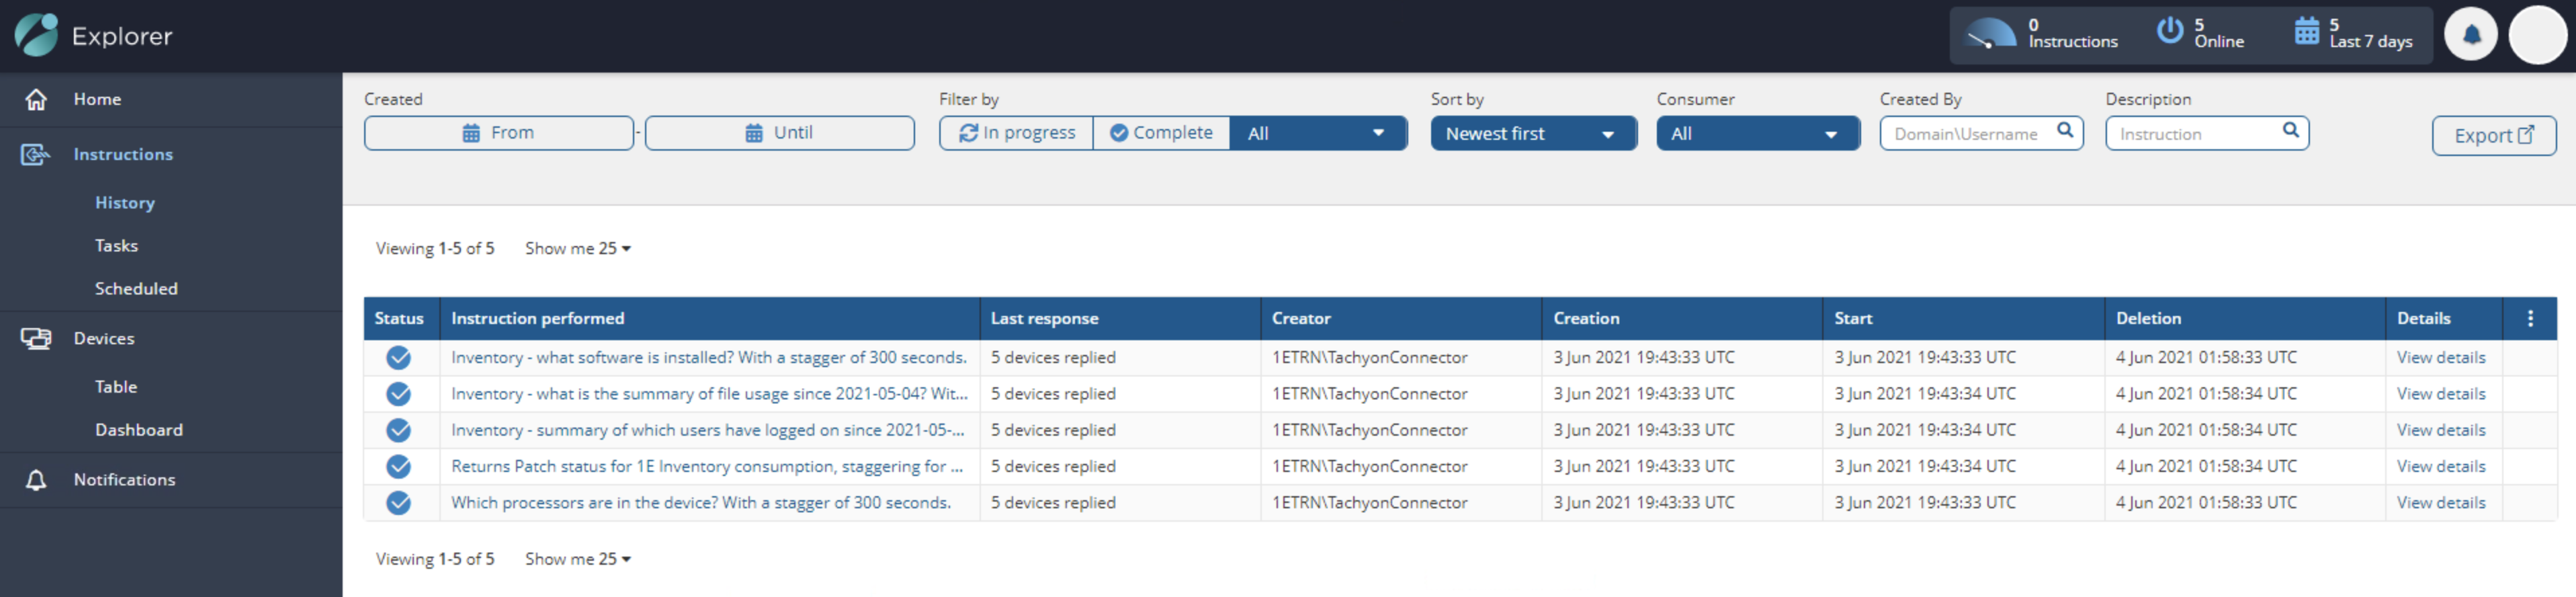
Instruction History
What software would be complete without full auditing capability? Click on the History section under Explorer and you’ll see the typical filterable log data with full exportability to CSV. This sure beats managing SQL Server Reporting Services (SSRS) and sifting through client logs!
Querying Endpoints
By now, you’ve learned the internals of Explorer and what it looks like standing still, but let’s now jump into how Explorer queries endpoints and manages their responses.
As mentioned previously, Explorer queries your endpoints in response to a question. It returns responses at lightning speed.
Question Parameters
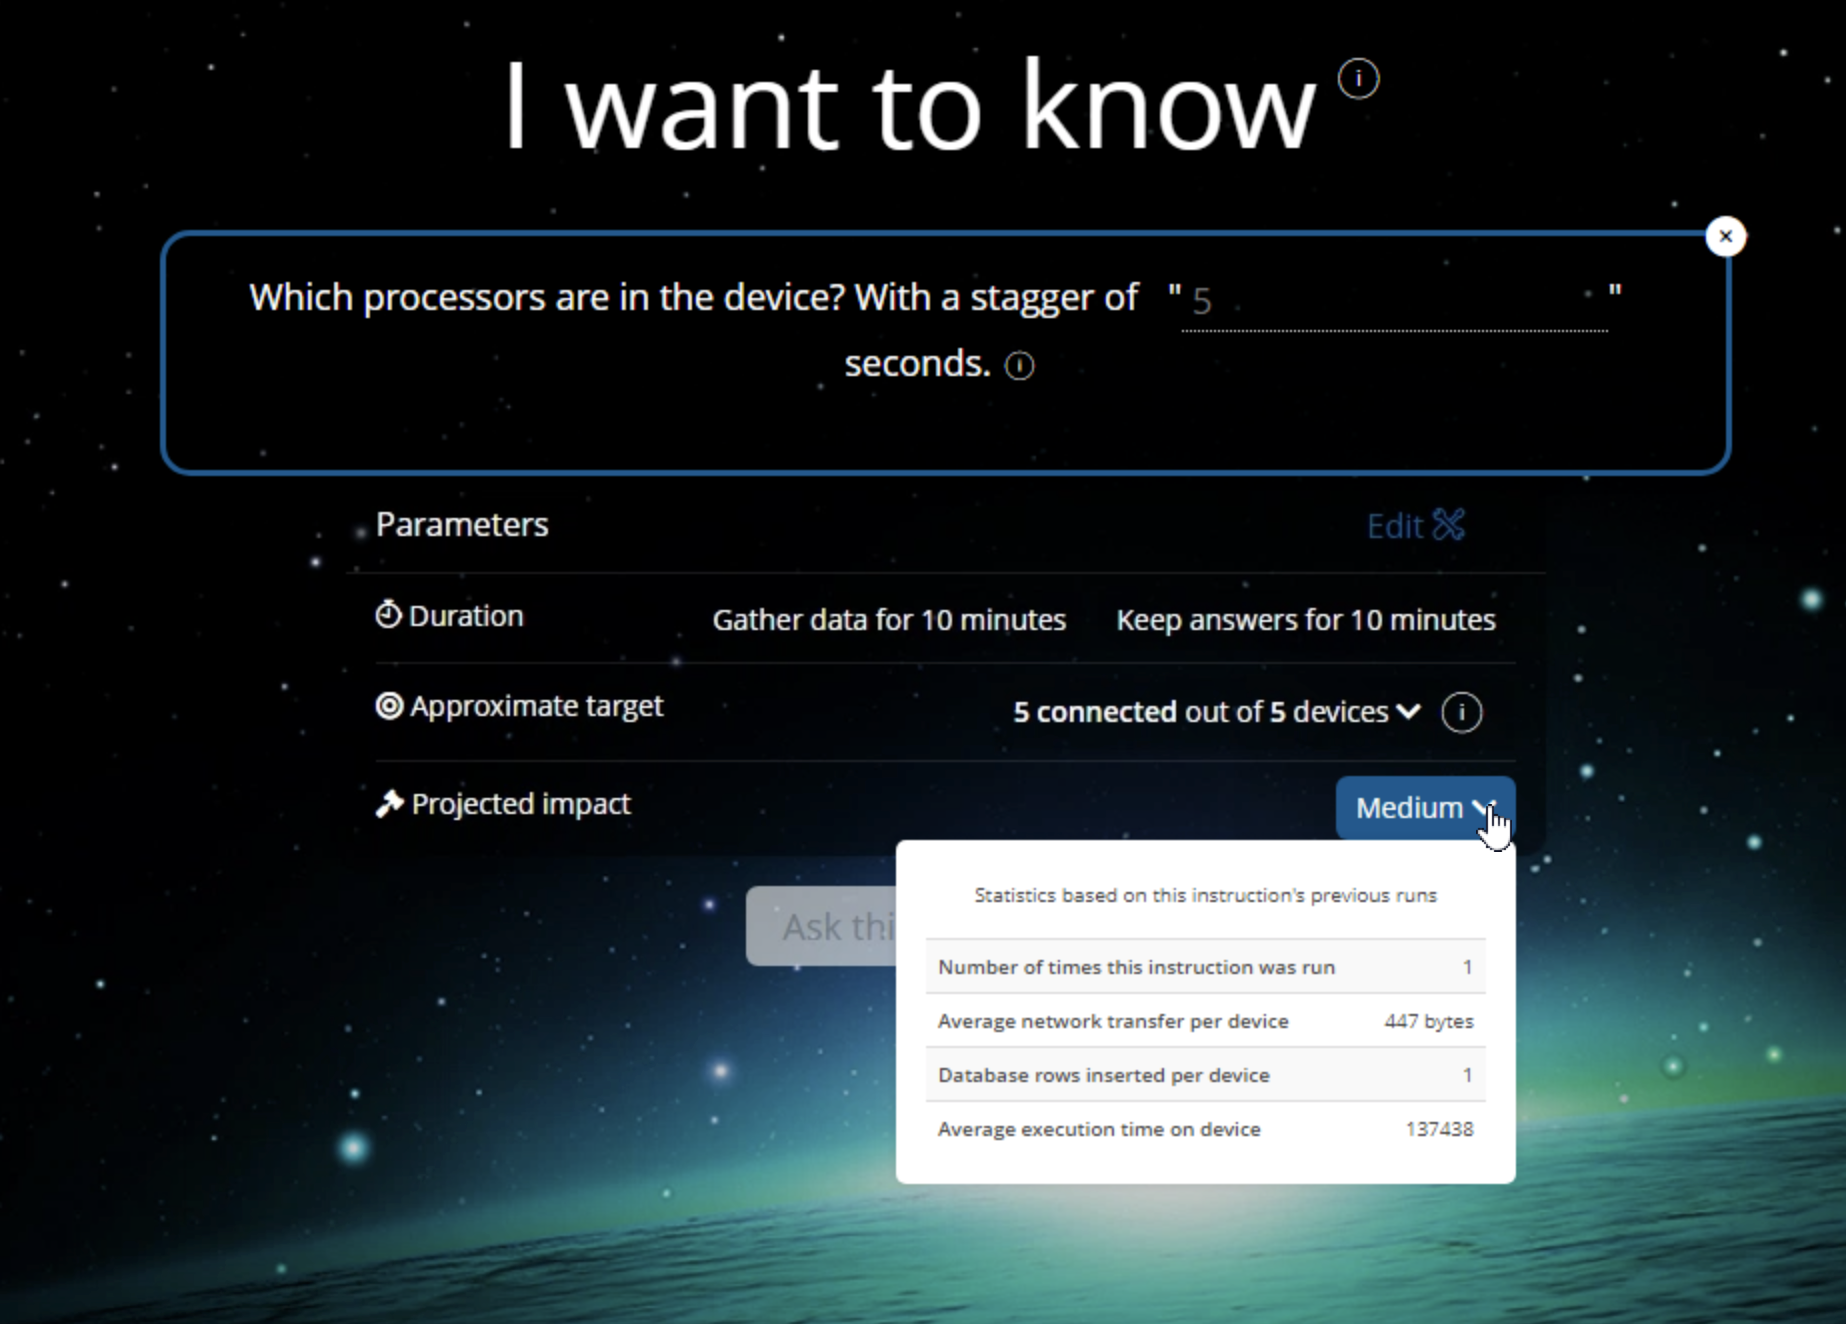
When you find and invoke a question, you’ll be prompted to provide some question parameters. In Explorer, every question has a set of common parameters:
- Duration
- Approximate target
- Projected impact
Each of these parameters controls how Tachyon will query the target endpoints.
Duration
The Duration parameter is my favorite. We all know those times when you need a recent inventory of some endpoint configuration and can’t get it because the devices just aren’t online. Laptops come and go and users are rebooting their computers right when it seems like you need to refresh inventory.
The Duration parameter allows you to tell Tachyon how long to query for new information. Rather than sending out a query at once and risking machines not being online right at that time, Tachyon will wait to see if any become available within a specified period of time.
Approximate Target
These are the endpoints Tachyon will query. Here you can choose all endpoints are select just a few.
Preferred Impact
The Preferred Impact parameter is another interesting parameter. This parameter defines how much performance impact this query will have on your environment. I like this parameter because it’s clear 1E is laser-focused on performance with Tachyon.
They took the time to develop a system to record metrics down to a single byte and microsecond level to show you how much impact the query will have. In the screenshot below, you can see when Tachyon sends out this request, the request will take cost 447 bytes and 137438 microseconds.
Demo: Tracking Down all Instances of Google Chrome
Enough talk about Explorer, let’s now run through a simple demo so you can see what it looks like hands-on! For this demo, I’m going to demonstrate how to discover all installations of Google Chrome and pretend like I’m in a pinch because one of those analysts is waiting for me!
1. On the Explorer home page, I’ll type in ‘software’. You’ll see below that the Inventory – what software is installed? question is already installed.
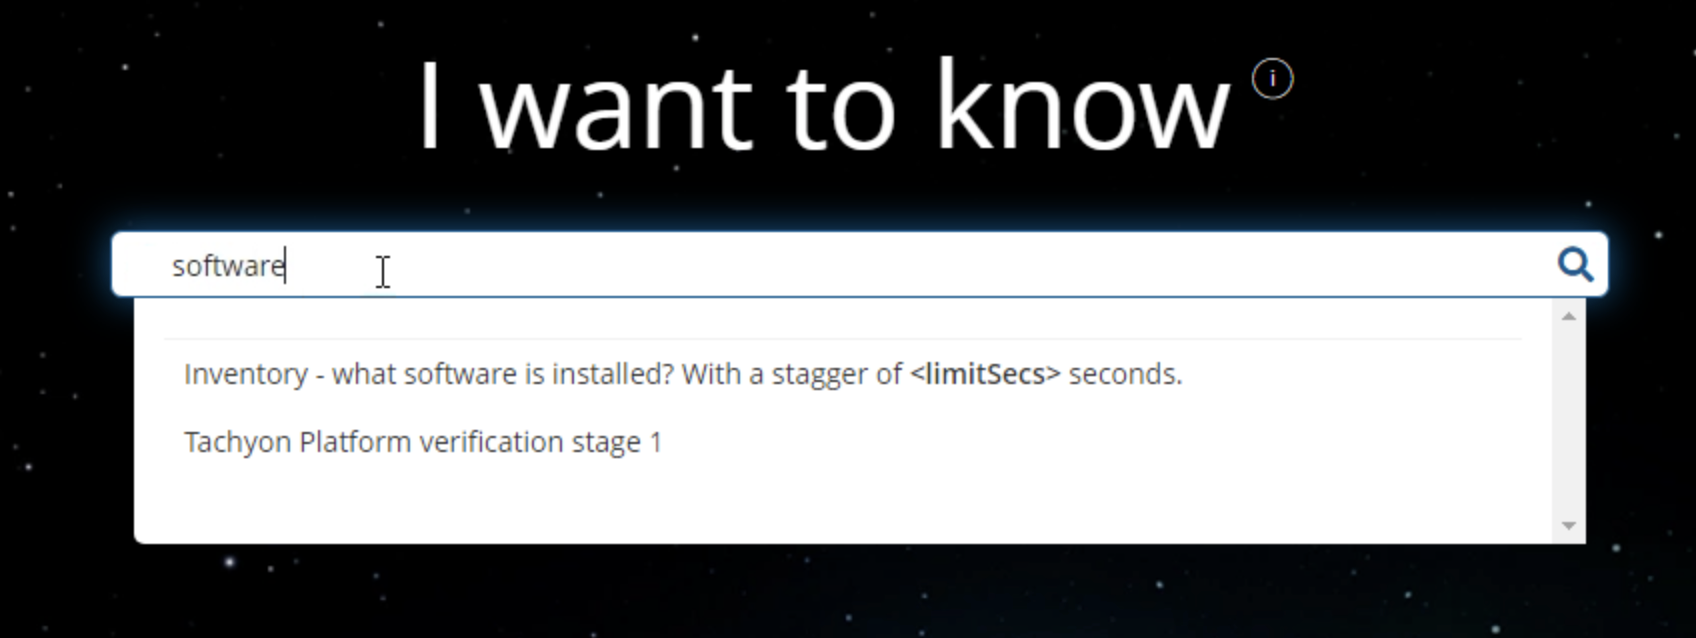
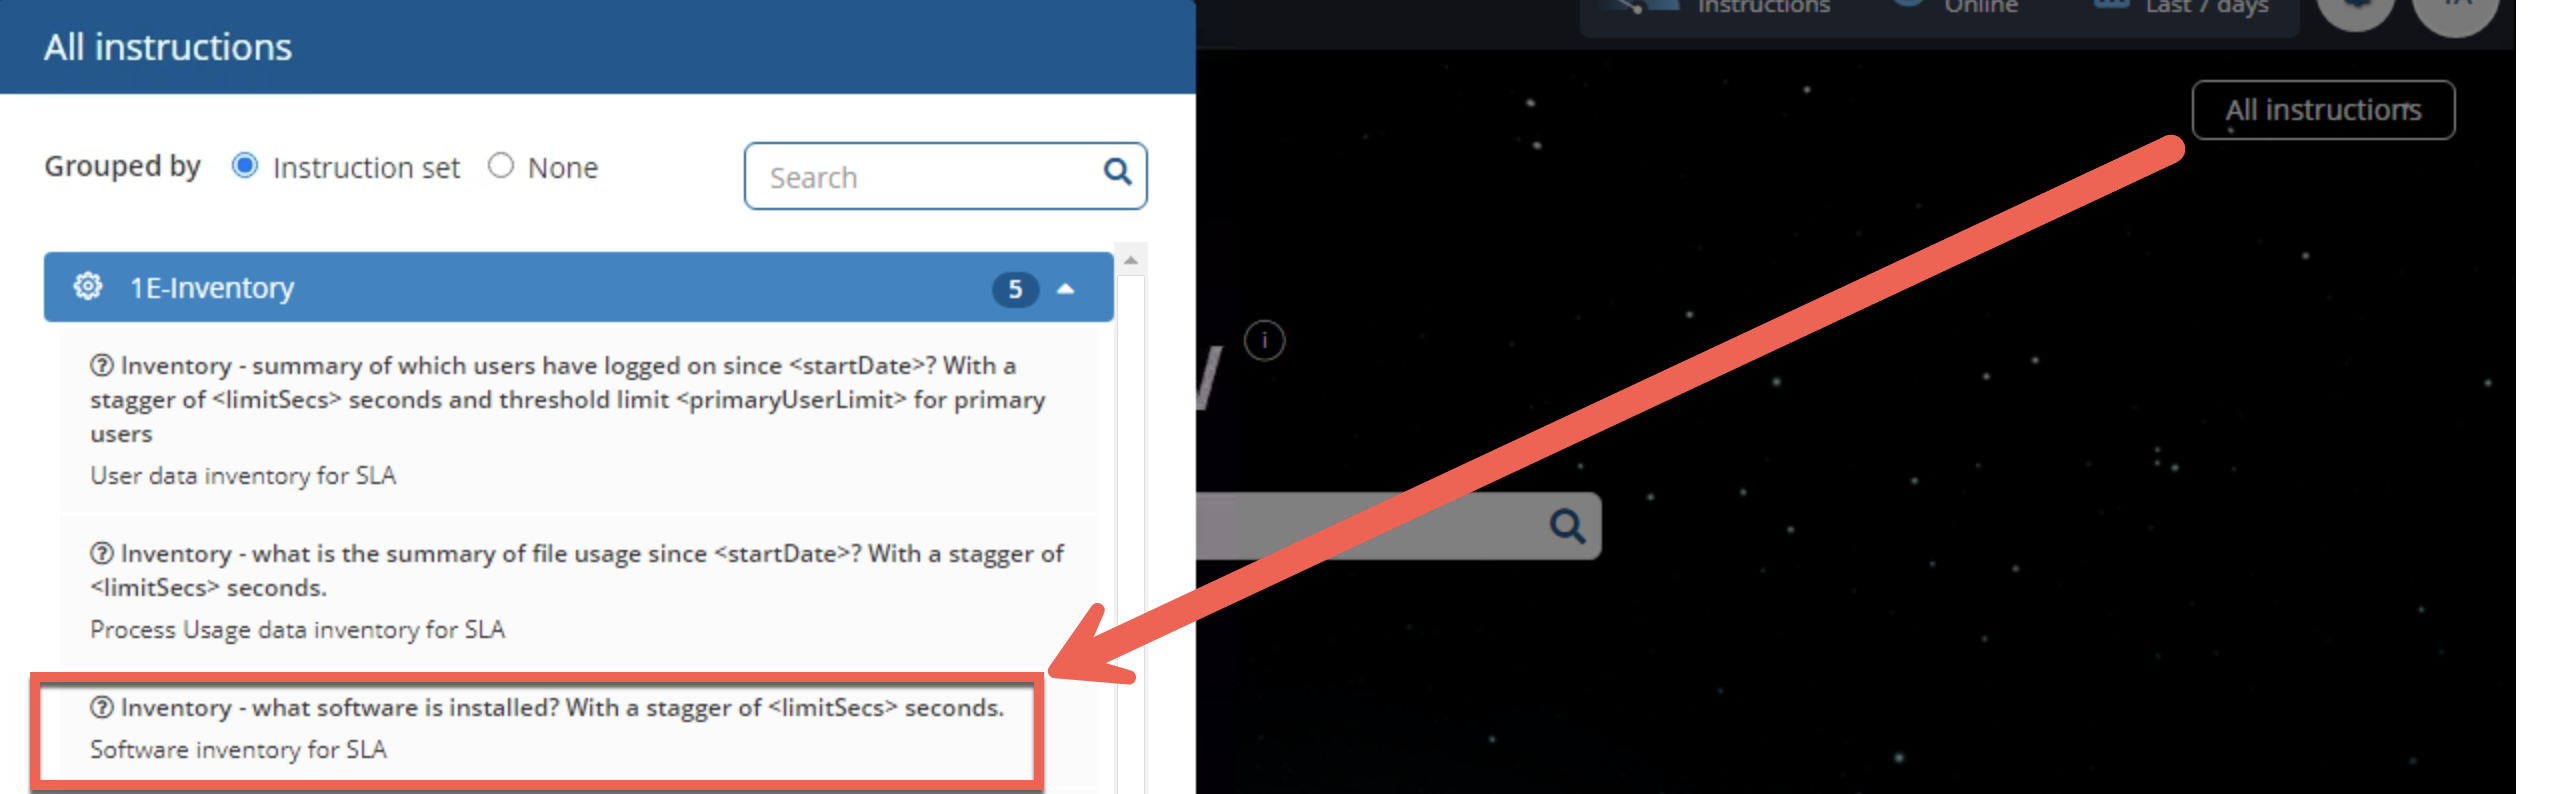
Explorer sees the what software is installed? question because Explorer comes with the 1E-Inventory product pack pre-installed. You can see the instruction that brings up this question by clicking on the All instructions button on the Explorer home page, as shown below.
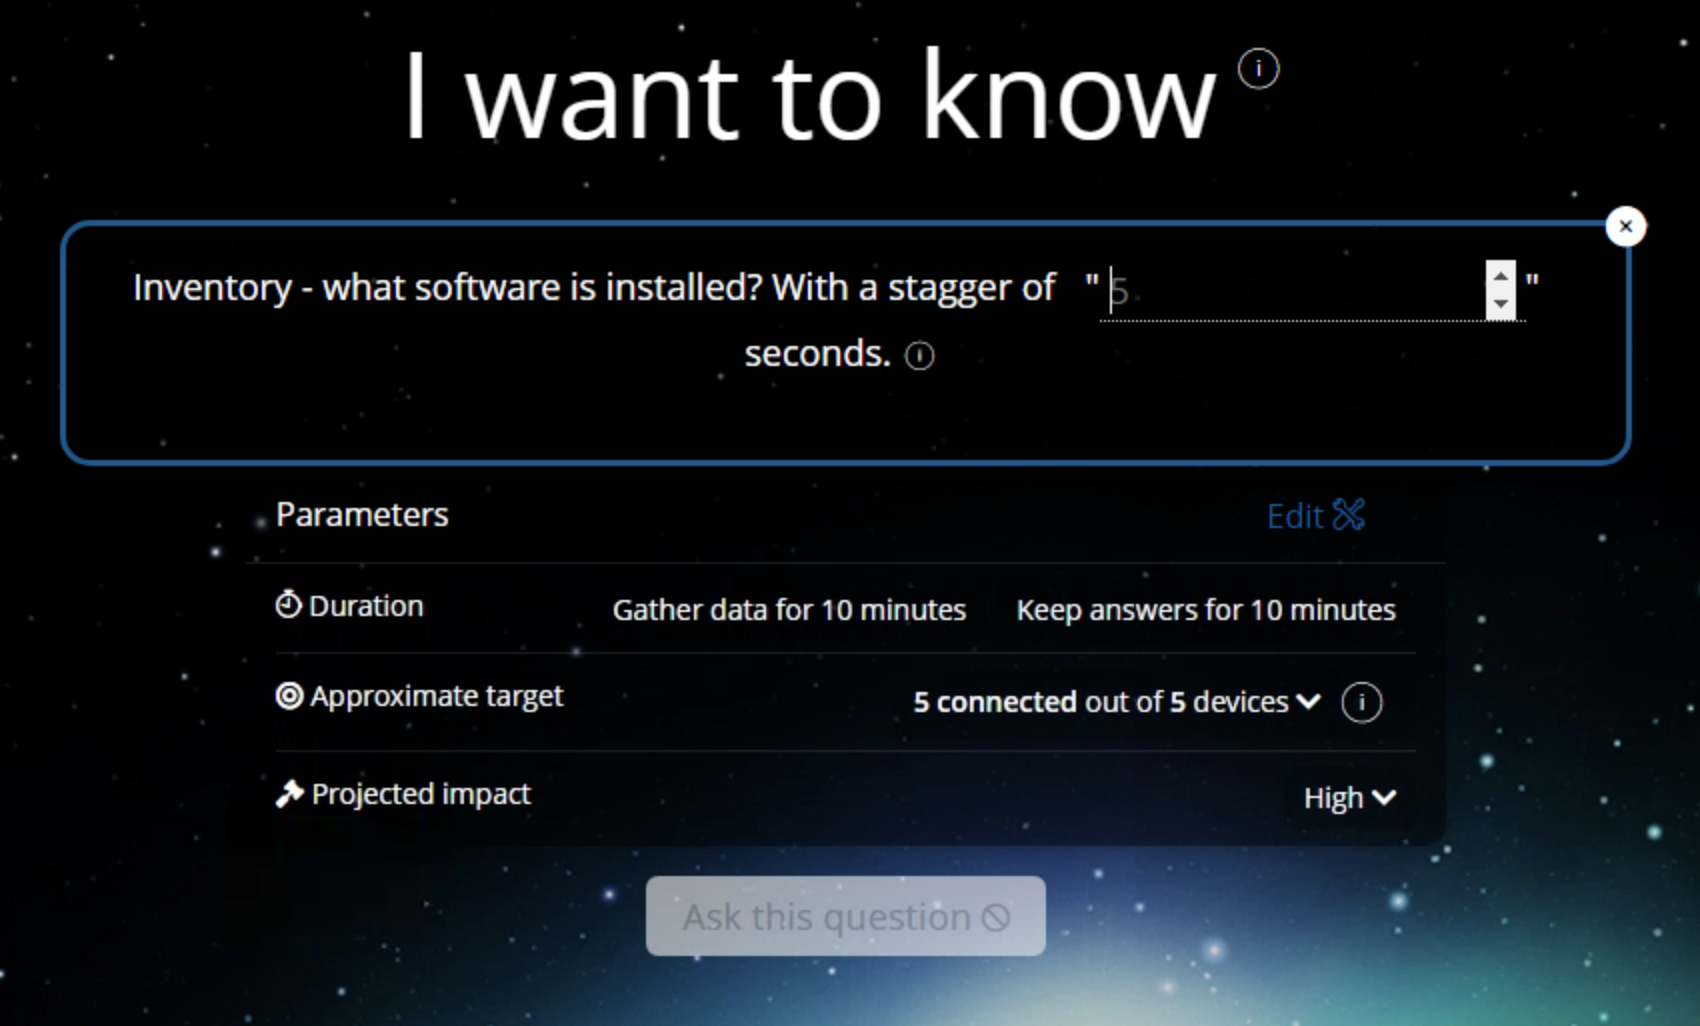
Once I click on the question, you’ll then see the question parameters appear. This particular question has a parameter of With a stagger of “____” seconds. Each question may have different custom parameters depending on how the product pack was built.
In this instance, the With a stagger of “____” seconds parameter gives you the ability to stagger the query across all endpoints. The default of five seconds means Tachyon will randomly query endpoints from 1-5 seconds to prevent network congestion.
2. I’ll leave the other common parameters at their defaults and click on Ask this question
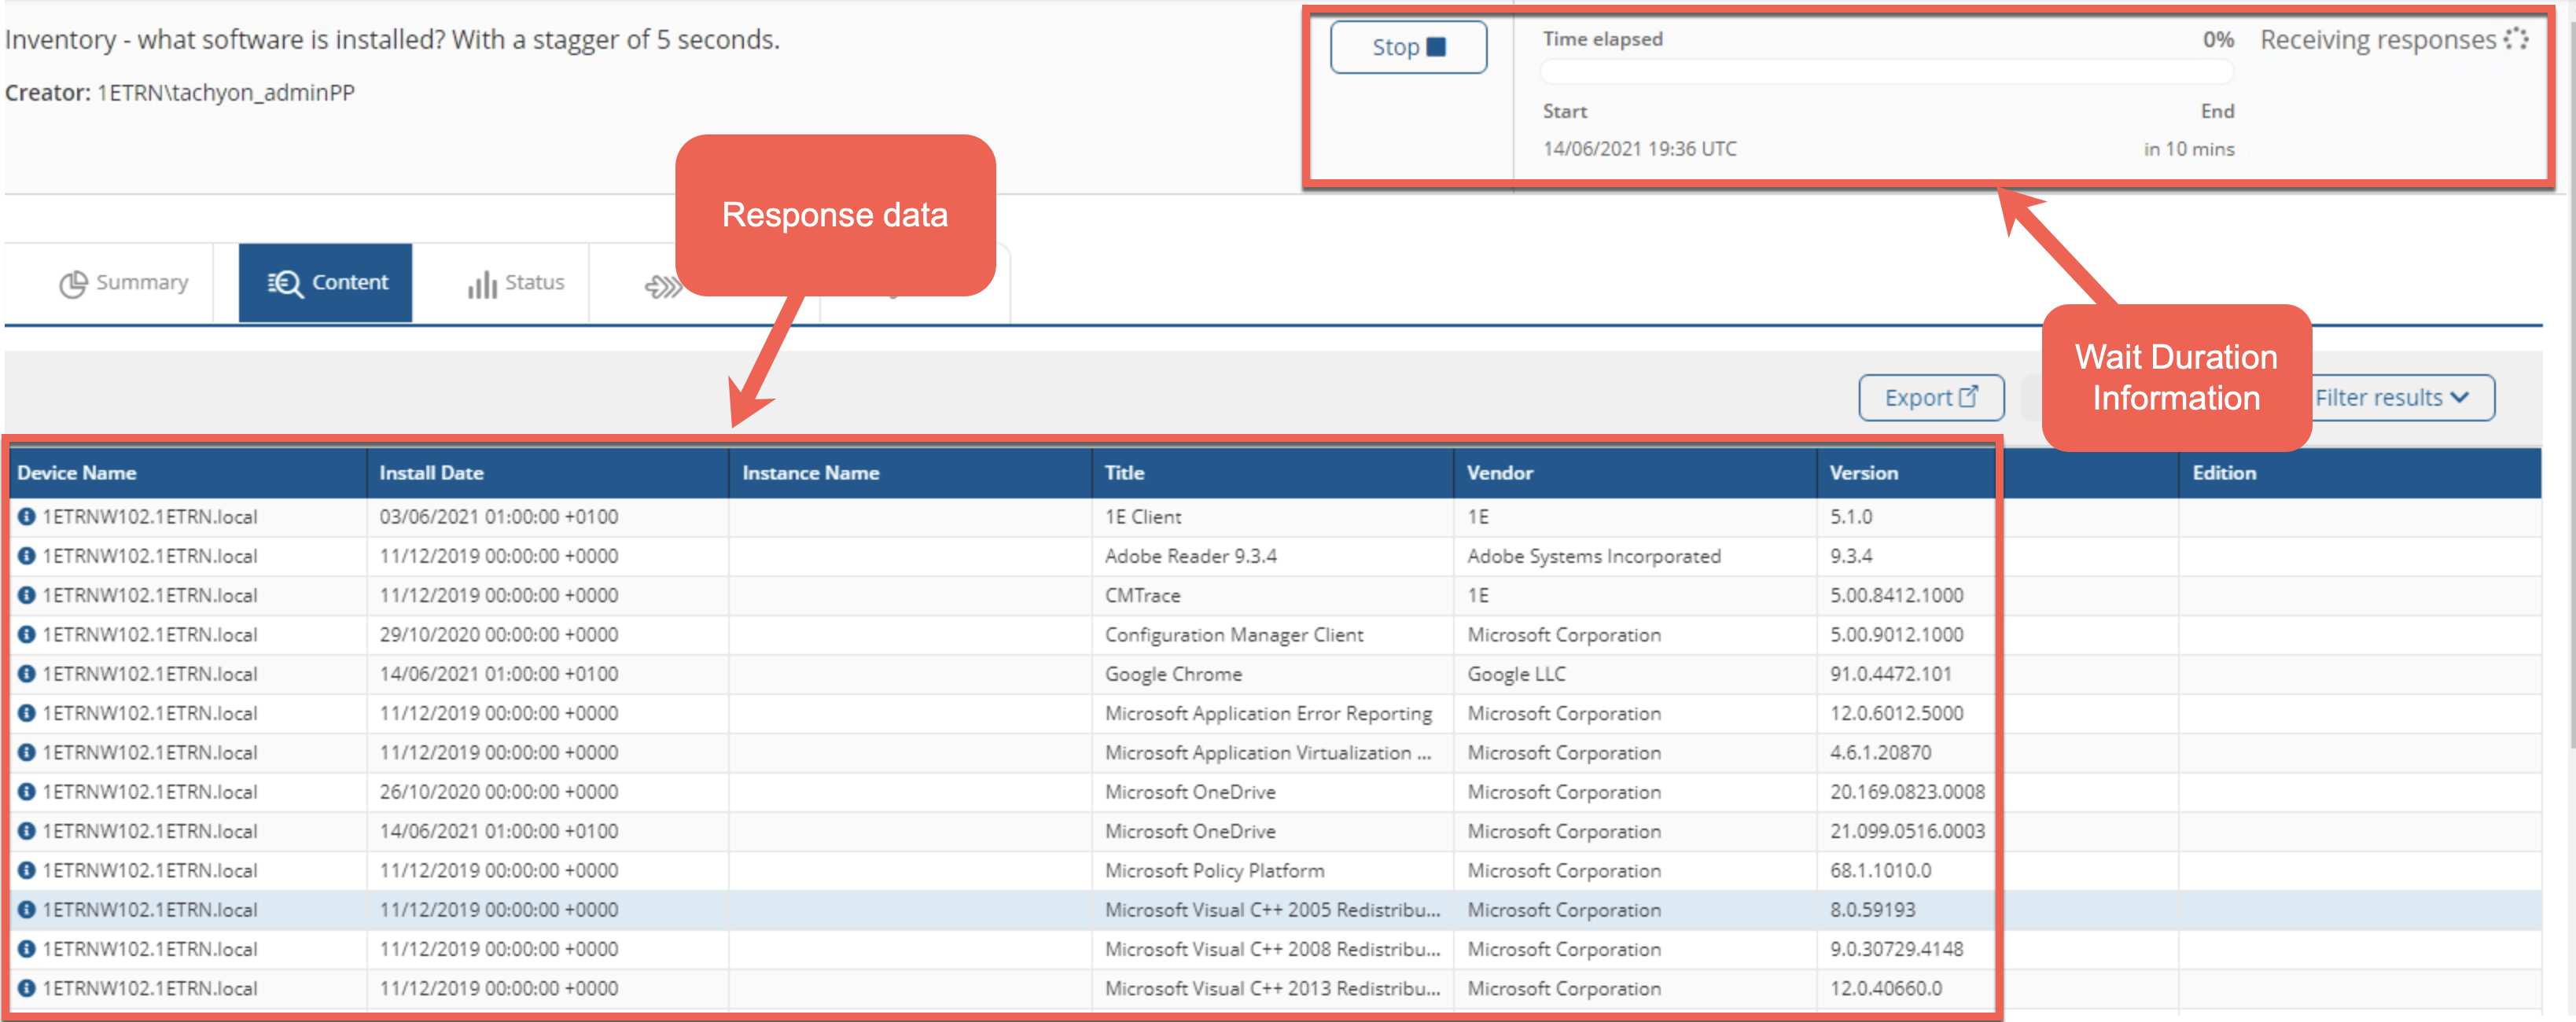
Tachyon will now do its thing and immediately bring back all of the software installed on all endpoints. You’ll see below that defaults to showing the Content tab which contains all of the response data.
Also, notice the wait duration information. This area tells you that Tachyon is still waiting for any remaining agents to report in and will do so for 10 minutes, in this case.
3. For this tutorial, I don’t care to see all software installed. I just need to see Google Chrome. To filter the data, click on the Filter results button, provide a value for the attribute to filter on, and click on the Search button.
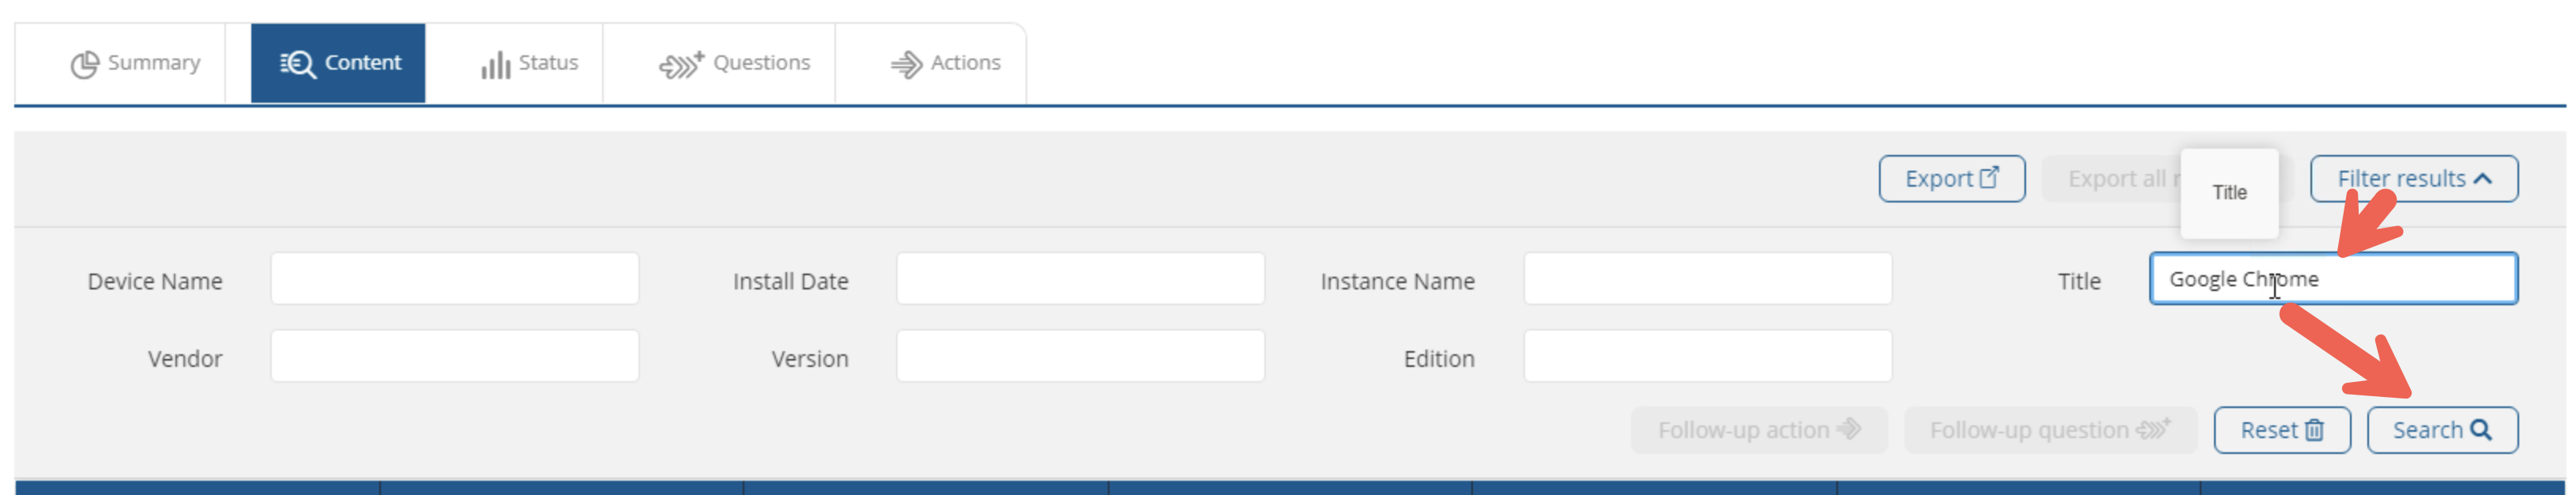
You’ll now see that the data has been filtered to Google Chrome below.
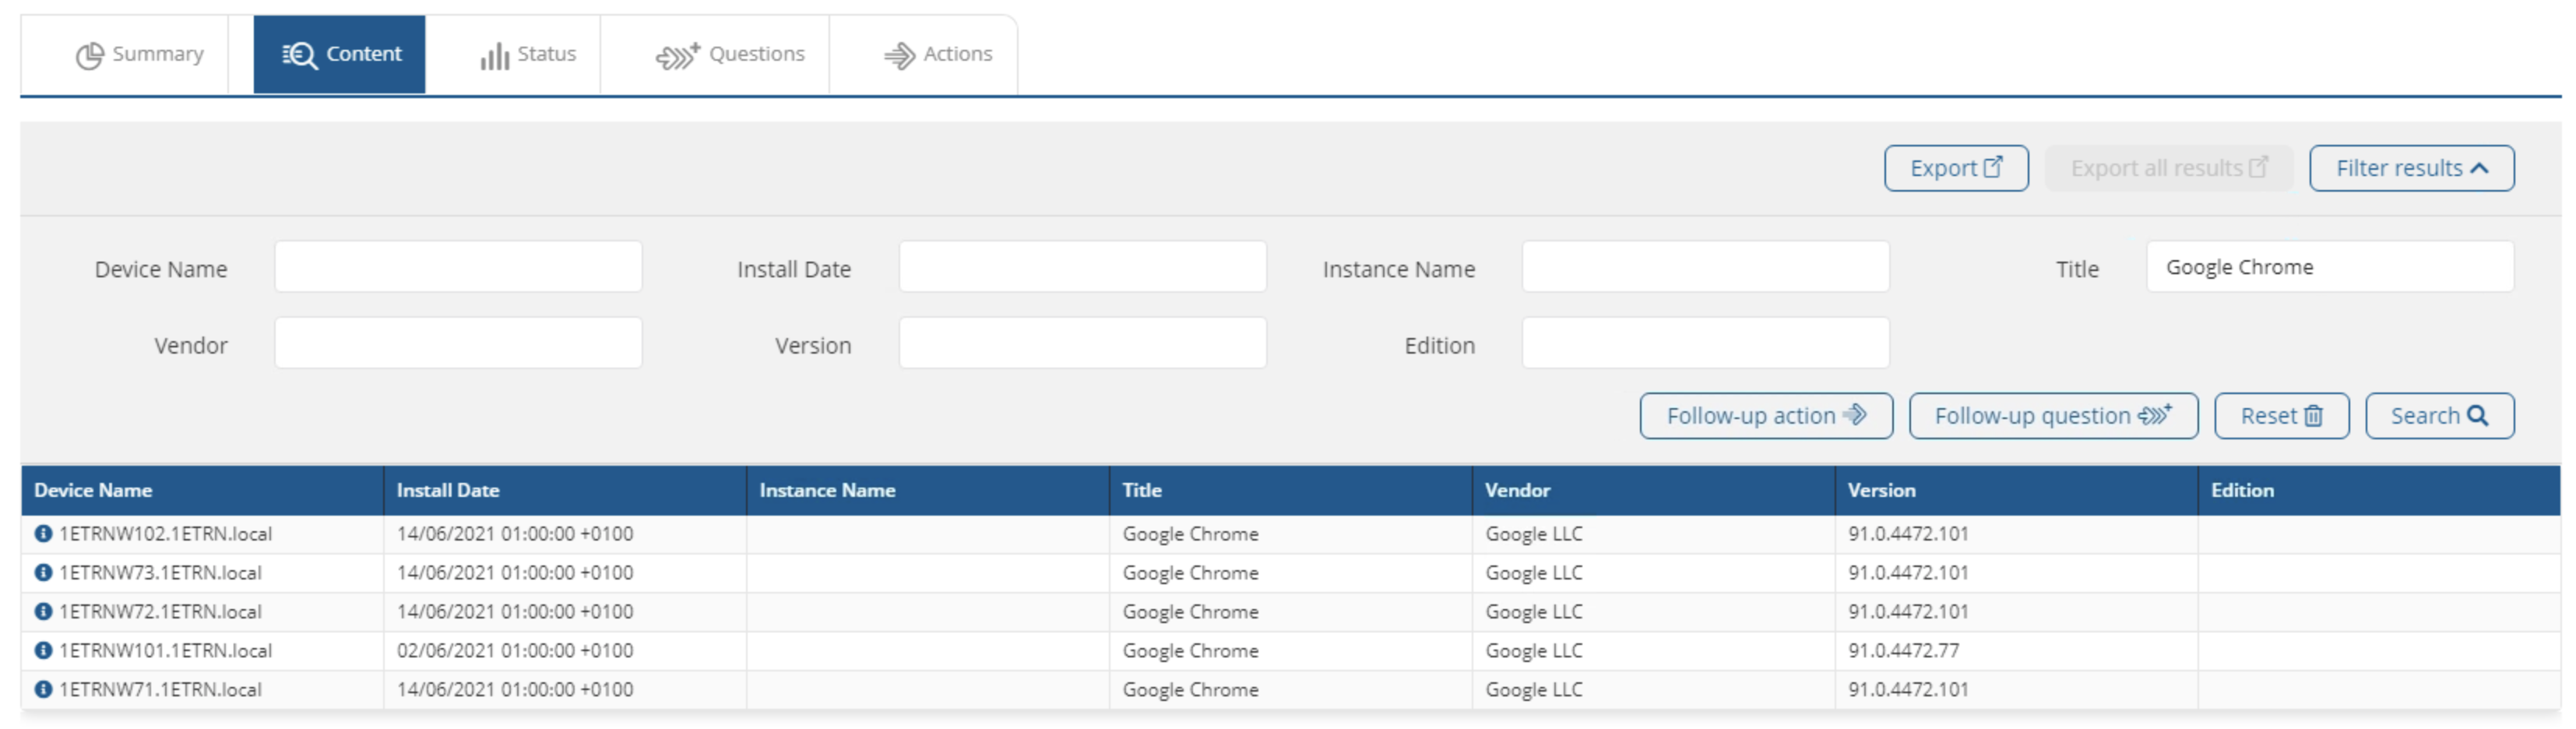
4. Finally, I need to provide the analyst with a CSV so I’ll click on the Export button which will immediately download a CSV file for me to send off to that pesky analyst!
Conclusion
There you have it! We went through a simple, yet routine set of tasks to showcase the basics of using 1E’s Tachyon Explorer.
Two big things set Tachyon Explorer apart from what I’m accustomed to: the natural language aspect to ask a question instead of provide a query and the real-time nature. These two aspects of Explorer make it hugely valuable and from my testing thus far, Explorer has worked great.


